

Abstract
The ventral striatum has long been proposed as an integrator of biologically significant associative information to drive actions. While inputs from the amygdala and hippocampus have been much studied, the role of prominent inputs from orbitofrontal cortex (OFC) are less well understood. Here we recorded single unit activity from ventral striatum core in rats with sham or ipsilateral neurotoxic lesions of lateral OFC, as they performed an odor-guided spatial choice task. Consistent with prior reports, we found that spiking activity recorded in sham rats during cue sampling was related to both reward magnitude and reward identity, with higher firing rates observed for cues that predicted more reward. Lesioned rats also showed differential activity to the cues, but this activity was unbiased towards larger rewards. These data support a role for OFC in shaping activity in the ventral striatum to represent the biological significance of associative information in the environment.
Keywords: ventral striatum, orbitofrontal cortex, single unit, rat
INTRODUCTION
The ventral striatum (VS) has long been proposed as an area critical to integrating affective information to drive actions 1–5. This role is evident in numerous single unit recording studies 6–14, which typically find that activity in this area is driven by some combination of the associative significance or value of cues and the required responses, and in the many well-controlled behaviors that depend on this region, such as Pavlovian-to-instrumental transfer (PIT) 15–18.
While the role of input from afferent regions such as the amygdala and hippocampus has been explored 4,5,19–24, relatively little attention has been given to the prominent input this area receives from the orbitofrontal cortex (OFC). OFC sends extensive input to the VS 25–29, and the OFC serves a role in behavior and decision-making that is somewhat similar though not identical to that of the VS. For example, like VS, the OFC is thought to signal biologically significant associative information 30–32. However, while the VS is necessary for both general and specific forms of PIT 15–18, the OFC has thus far been implicated in only specific, but not general, PIT 33. Likewise VS is necessary for unblocking based on either value or identity information, whereas the OFC is only necessary for identity-based unblocking 34. These partial dissociations raise interesting questions regarding which representations in VS depend on OFC and which might be OFC-independent.
To investigate this question, we recorded single unit activity from VS core in rats with ipsilateral sham or neurotoxic lesions of the lateral OFC. We chose VS core because this region appears to receive the heaviest direct input from lateral OFC in rats 25–29. Recordings were made as rats performed a simple odor-guided choice task, in which odors served as cues for the spatial location of the reward (left or right well). During each recording session, the identity and number of reward in each well was manipulated across blocks of trials. We found that neurons in sham rats showed differential activity to the cues that reflected the number and direction of the required response. Much of this activity seemed value related, inasmuch as higher firing was typically observed to the larger reward. In addition, we also found ample representation of value combined with reward identity. Lesioned rats also showed differential activity to the cues, but this activity was largely devoid of a bias towards representing larger or more valuable rewards. These data support a role for the OFC in biasing activity in the VS core to represent the biological significance of associative information in the environment. This role is consistent with anatomical and behavioral evidence and provides novel insight regarding how orbital regions may influence downstream processing.
RESULTS
Neurons were recorded during performance of an odor-guided choice task (illustrated in Fig. 1A). In this task, odor cues signaled the rat to respond left or right to receive small (one drop of ~0.05 mL) or large (three drops) amounts of two equally preferred chocolate or vanilla-flavored milk solutions (see Fig. 1B). Response-reward contingencies were stable across blocks of ~60 trials, but switched unpredictably between blocks. Contingencies were arranged so that 1) rewards in the two directions always differed in both number and flavor (e.g. large chocolate versus small vanilla or large vanilla versus small chocolate), and, 2) number and flavor switches alternated according to the sequence number-flavor-number-flavor across the five blocks of every session. After initial shaping to proficiency on the task (see Methods), rats received unilateral sham (n=4) or neurotoxic lesions (n=5; Fig. 1C) of the lateral OFC, and electrode arrays were implanted in ipsilateral VS core. After recovery, rats were retrained and then recording began.
Figure 1. Task and behavior.

A. After initiating a trial with a nose-poke and receiving an instructional odor, rats responded at one of two fluid wells for 1 or 3 drops of chocolate or vanilla milk, delivered 500ms after the well-poke. Two odors indicated forced choices, left or right; a third odor indicated free choice. Reward contingencies were stable across blocks of ~60 trials, but switched in number of drops (dashed lines) or flavor (dotted lines) in four unsignaled transitions. Rewards in the two directions always differed in both number and flavor (only one of four possible block sequences is shown).
B. Chocolate and vanilla milk solutions were equally preferred in a ten-minute consumption test conducted previously in a separate group of rats (mean ± standard error; n=6; t10 = 0.1, p=0.93).
C. Shown is the extent of unilateral neurotoxic lesions of orbitofrontal cortex (OFC) made in one group.
D,E. Control rats (sham lesions) were sensitive to the number of drops but not the flavor of reward (n=83 sessions). Number switches (left panel, D) had a large effect on choice rates independent of flavor. Flavor switches (right panel, D) had no effect on choice rates for big vanilla-> big chocolate or big chocolate->big vanillla switches. Line figures show average trial-by-trial choice rates; inset bar graphs compare average choice rates ± standard errors in the 25 trials before block switches versus the 25 trials after. In E, reaction time (odor offset to port exit; top panel) and accuracy (bottom panel) on forced choice trials reflected number but not flavor. Scatter plots in each panel show rat-by-rat difference scores; the length of lines in each dimension represents the standard error. No rat showed a significant effect of flavor on any measure.
F.G. Rats with unilateral OFC lesions were also sensitive to number but not flavor (n=67 sessions). Their behavior was not significantly different from shams, except that they had slower reaction times across all conditions and showed a greater effect of number on reaction time. Panels F and G follow the same conventions as D and E. No individual rat showed a significant effect of flavor on any measure.
During recording, rats in both groups attended to differences in reward number but not flavor. Thus, number switches resulted in a rapid and sustained change in choice rate on free-choice trials (Figs. 1D and F), and the rate of switching was independent of flavor and lesion status (see Table 1 for statistics). In addition, reaction time was faster and performance was more accurate on forced-choice trials when a large reward was at stake (Figs. 1E and G; see Table 2 for statistics). Again, these effects were independent of reward flavor and did not differ based on lesion status, although there was a general increase in reaction time in lesioned rats. Importantly, changes in behavior driven by reward number were similar for the two milk flavors for each individual rat analyzed separately, and switches between flavors had no effect on choice rate for each individual rat analyzed separately (see scatter plots in Figs. 1D–G, and Supplementary Table 1 for statistics). Thus performance on both free- and forced-choice trials was sensitive to reward number, reflecting the higher value of a large reward, but insensitive to flavor, reflecting the similar value placed on chocolate and vanilla. These effects were observed in both groups and within each individual rat, and there was no effect of unilateral lesions.
Table 1. Choice rates across block transitions, statistics.
Listed are the results of a mixed ANOVA on difference in free-choice rates across block transitions (choice rate over first 25 trials after transition minus choice rate over last 25 trials before transition).
| Main effects | Planned comparisons | |||||||
|---|---|---|---|---|---|---|---|---|
| group | initial flavor | transition type | interactions | choc-to-van vs. van-to choc | group X (magnitude of number transition effect) | group X (magnitude of flavor transition effect) | group X (choc-to-van vs. van-to-choc) | |
| F | 0.0 | 0.8 | 789 | F’s<1.2 | 0.0 | 0.0 | 0.0 | 0.4 |
| df | 1,146 | 1,146 | 1,146 | various | 1,146 | 1,146 | 1,146 | 1,146 |
| p | 0.93 | 0.37 | <10−6 | p’s > 0.27 | 0.91 | 0.94 | 0.95 | 0.53 |
Four types of transitions were included: 1-drop chocolate to 3-drops chocolate, 1-drop vanilla to 3-drops vanilla, 3-drops chocolate to 3-drops vanilla, 3-drops vanilla to 3-drops chocolate. Thus, the ANOVA factors were group (sham or lesion), initial flavor of transition (chocolate or vanilla), and transition type (number of drops or flavor), df = degrees of freedom.
Table 2. Reaction time and percent correct, statistics.
Listed are the results of mixed ANOVAs on reaction time and percent correct on forced choice trials in the last 25 trials of the last four blocks. Factors were group (sham or lesion), number of drops of available reward (1 or 3), and flavor of available reward (chocolate or vanilla).
| Main effects | Interactions | |||||
|---|---|---|---|---|---|---|
| group | number | flavor | group X number | group X flavor | ||
| reaction time | F | 27 | 55 | 0.0 | 13.9 | 0.3 |
| df | 1,148 | 1,148 | 1,148 | 1,148 | 1,148 | |
| p | <0.001 | <0.001 | 0.82 | <0.001* | 0.60 | |
| percent correct | F | 1.0 | 238 | 0.8 | 0.6 | 0.2 |
| df | 1,148 | 1,148 | 1,148 | 1,148 | 1,148 | |
| p | 0.33 | <10−6 | 0.38 | 0.43 | 0.69 | |
Although there was a significant group X number effect, there was still a significant effect of number at both levels of group (sham: F1,148=7.7, p<0.01; lesion: F1,148=56.3, p<0.001). df = degrees of freedom.
Activity integrates response direction and reward number
We recorded 592 single-units in VS core of sham and lesioned rats; recording locations and baseline firing rats were similar across groups (Figs. 2A and 2B). We were particularly interested in cue-evoked activity; such activity in VS has been frequently reported to encode associative information. For example, in a prior study in which we manipulated both the number and timing of reward, we found that cue-evoked activity was heavily influenced by these two variables 6. Here we found very similar effects in sham rats. As in the previous study, we defined the preferred direction for each unit as that for which firing rate during the cue epoch was highest across all conditions, and then tested for effects of the associated reward in that direction. Within the cue-responsive population (66 of 399 total single units recorded in sham rats), almost a quarter of the neurons (13) exhibited a main effect of number with no accompanying effect of flavor, and an approximately equal number (12) exhibited a number-by-flavor interaction or main effects of both number and flavor in their cue-evoked firing (Fig. 2C). The response-specific influence of reward number was evident in the evoked activity of individual units, which tended to fire most to the cues that predicted the high magnitude reward in a particular direction (Figs 2E, G). Notably, very few units responded differentially based on flavor alone (Fig. 2C). See Table 3 for a full accounting of neuron categorization and statistics.
Figure 2. Single-unit recordings of odor-responsive units.

A,B. Shown are recording locations and baseline firing rate distributions in the sham (A) and OFC-lesioned group (B). The width of each box (1 mm) represents the approximate spread of recording wires, and the height the estimated range through which the bundle was driven during recording sessions. Each box represents one rat. The scale bar represents 1 mm. CC = corpus callosum; AC = anterior commissure. Baseline firing rates were not significantly different in the two groups, for either the whole population (t590 = −0.15, p=0.88) or in the odor-responsive population, (t90 = −1.5, p=0.13).
C,D. Pie charts represent all odor-responsive units (defined as those with a significant increase over baseline during the odor epoch). Colored sections represent units with significant effects of number (black), flavor (blue), or both (cross-hatched), based on an ANOVA on firing rate in that unit’s preferred direction during the odor epoch.
There was no significant difference in the proportion of odor-responsive units in the two groups (by chi-square, p=0.25). However, with OFC lesions, units were significantly more likely to be flavor-selective and significantly less likely to be number-selective with no effect of flavor (chi-square on distribution of units across these categories p<0.0001). Indeed, by chi-square, in the sham group, the number of purely flavor-selective neurons (with no effect of number) was not significantly different from chance (p=0.74), while the number of purely number-selective neurons was significantly greater than chance (p<0.00001); in the lesion group, the opposite was true (purely flavor-selective, p<0.00001; purely number-selective, p=0.90).
E–H. Single-unit examples from the sham (E,G) and lesion groups (F,H). Black and gray bars indicate bins with a significant effect of number or flavor, respectively, by ANOVA on a sliding average of five bins. Significant effects were found mostly on the preferred side (left side of each panel). Units in the control group tended to prefer the odors predicting large outcomes, in some cases with no effect of flavor (E) and in other cases with an additional effect of flavor (G). Units in the lesion group were more likely to be flavor-selective without a strong effect of number.
Table 3. Number of significantly selective neurons in each condition.
Listed are the counts resulting from an ANOVA run on each neuron across trials, with factors number of drops of reward and flavor of reward. The χ2 test listed in the third row of each section compares the proportion of neurons in each category with what would be expected by chance. For the p-values with asterisks, this test revealed that the overall number of significant neurons was not more than would be expected by chance; for the other p-values, this test revealed whether the proportion of big-preferring vs. small-preferring or chocolate-preferring vs. vanilla-preferring was significantly biased away from 50/50. In addition to the tests shown, other χ2 tests revealed that in both shams and lesions, neurons were more likely to be significant late in blocks in the preferred vs. the anti-preferred directions (p<0.0001 and p<0.001, respectively), and that in the preferred direction late in blocks, lesions had a significantly different distribution than would be expected based on the sham distribution (p<0.0001).
| preferred direction | anti-preferred direction | ||||
|---|---|---|---|---|---|
| early in blocks | late in blocks | early in blocks | late in blocks | ||
| sham | big-preferring | 1 | 22 | 4 | 3 |
| small-preferring | 4 | 3 | 0 | 8 | |
| χ2 test p | 0.34* | <0.001 | 0.69* | 0.13 | |
| lesion | big-preferring | 0 | 4 | 0 | 4 |
| small-preferring | 2 | 4 | 2 | 3 | |
| χ2 test p | 0.53* | 1.0 | 0.53* | 0.71 | |
| sham | choc-preferring | 8 | 10 | 2 | 1 |
| van-preferring | 1 | 5 | 2 | 1 | |
| χ2 test p | <0.05 | 0.20 | 0.69* | 0.46* | |
| lesion | choc-preferring | 3 | 6 | 1 | 3 |
| van-preferring | 1 | 7 | 1 | 3 | |
| χ2 test p | 0.32 | 0.78 | 0.53* | 1.0 | |
The number-related activity was also evident in the population response of the cue-responsive neurons, which showed higher firing to the larger outcome in the preferred direction, with no overall effect of flavor (Fig. 3A). Note that we also saw, in some neurons, a strong phasic response occurring later in trial, at about the time of the reward, which appears in the population plot. However, unlike number-related activity during the cue, reward-responsive activity was not consistently found across the sham rats in our dataset, and thus we did not analyze these responses further (mixed ANOVA comparing activity during baseline and reward epoch, with between-subjects factor rat, found only a marginal effect of reward vs. baseline, F1,62=3.3, p=0.07, and a large interaction between reward vs. baseline and rat, F3,62=26.5, p<0.000001; across units from some individual rats, activity during the reward epoch was significantly lower than baseline (n=2), while in only one rat was it higher than baseline).
Figure 3. Outcome selectivity in ventral striatum of sham-lesioned rats.

A,B. Shown are population averages of normalized firing rate across the time of the trial, aligned to the end of the odor period, for all odor-responsive units (n=66). Activity is averaged by preferred (left panel) and anti-preferred (right panel) directions, and by the specific reward available at the end of the trial (in different colors). Preferred direction was defined for each unit by the direction with the highest average activity during the epoch from odor initiation to port withdrawal (in gray shading). Only correct forced-choice trials in the latter part of the block (after the first twenty correct trials) are included in the averages. Black bars indicate bins with a significant effect of number of drops of reward, by ANOVA on a sliding average of five bins across neurons. There were no bins with a significant effect of reward flavor.
B. Shown are number-selectivity indices during the odor epoch for each neuron in the population, separately for the preferred (left panels) and anti-preferred (right panels) directions. Insets show indices early in blocks immediately following number shifts. Number-selectivity index was defined as the difference in normalized firing rate between conditions with the large reward and those with the small reward. Dark-coded units are those in which this difference was significant across trials.
**, p<0.01, both the indices of the population and the proportion of significant neurons were significantly shifted to the right.
C. Shown are flavor-selectivity indices with the same conventions as in B., with insets showing the indices in the trials immediately after flavor shifts. Indices were not shifted towards either flavor (except early in the preferred direction), but had a larger magnitude (absolute value) and were more likely to be significant, in the preferred direction compared to the anti-preferred, late in blocks.
To quantify number-related activity during the cue, we calculated a number index score comparing firing in each neuron based on reward number, in both the preferred and anti-preferred direction, and both early and late in blocks. We calculated the score both as a simple subtraction index (the difference between mean normalized firing rates in high vs. low reward number conditions) and as a t-statistic comparing firing rates across trials in the two conditions. As shown in these figures, activity biased toward the cue predicting the larger magnitude reward was not present early in the trial blocks following a switch in number, but appeared later (Fig. 3B, and Table 4 for full statistics; see Supplementary Fig. 1 and Supplementary Table 2 for the same analyses using t-statistics). The development of the bias is consistent with it being an effect of training. Notably, index scores comparing firing based on reward flavor showed a similar pattern, with flavor selectivity in the neurons’ preferred directions developing with training after a flavor switch. This pattern was not evident in the average population response because both flavors were equally represented across the population (Fig. 3C). However, to the extent that flavor-selectivity was present, its magnitude (as measured by the absolute value of the flavor index) was greater in the preferred direction than in the anti-preferred direction, late in blocks. See Table 5 for full statistics on flavor-selectivity indices.
Table 4. Number selectivity in cue-selective neurons recorded in sham rats, statistics.
Listed are the results of a within-subjects ANOVA on number-selectivity indices across cue-selective neurons, with factors time (early or late in blocks) and direction (preferred or anti-preferred).
| Planned comparisons (each tests whether indices are significantly shifted from zero): | ||||||
|---|---|---|---|---|---|---|
| time X direction | preferred direction | anti-preferred direction | Effects of hemisphere | |||
| early in blocks | late in blocks | early in blocks | late in blocks | |||
| F | 22.2 | 8.0 | 10.5 | 2.2 | 4.5 | F’s<1.3 |
| df | 1,65 | 1,65 | 1,65 | 1,65 | 1,65 | 1,64 |
| p | <10−4 | <0.01 (small- preferring) | <0.01 (big- preferring) | 0.14 | <0.05 (small- preferring) | p’s>0.26 |
For the last column, the hemisphere in which the recording was made was included as an additional factor. Note that if “rat” were included as a factor in the ANOVA, the time X direction interaction would still be significant or nearly significant at 3 of the 4 levels of “rat” in spite of reduced power, with the lone exception being a rat which contributed only 5 units to the odor-responsive population (in each of the three cases, F1,62 > 3.5, p<0.07). df = degrees of freedom.
Table 5. Flavor selectivity in cue-selective neurons recorded in sham rats, statistics.
Listed are the results of a within-subjects ANOVA on flavor-selectivity indices across cue-selective neurons, with factors time (early or late in blocks) and direction (preferred or anti-preferred). These results show that neurons do not in general prefer chocolate or vanilla in any condition. For the last column, the magnitude of the indices (absolute value) was compared between the preferred and anti-preferred directions late in blocks.
| Planned comparisons (each tests whether indices are significantly shifted from zero): | ||||||
|---|---|---|---|---|---|---|
| preferred direction | anti-preferred direction | absolute value of indices late in blocks, preferred vs. anti-preferred | ||||
| time X direction | early in blocks | late in blocks | early in blocks | late in blocks | ||
| F | 0.7 | 3.4 | 1.5 | 1.4 | 0.4 | 16.6 |
| df | 1,65 | 1,65 | 1,65 | 1,65 | 1,65 | 1,65 |
| p | 0.41 | 0.07 | 0.22 | 0.23 | 0.55 | <0.001 |
This significant result demonstrates that neurons show greater selectivity to flavor on the preferred side. df = degrees of freedom.
Thus, overall, cue-evoked activity in VS of sham rats was highly associative. We replicated earlier findings showing that this activity was strongly driven by the required response direction and the number of the predicted outcome. Further, we found that while flavor information was integrated into this single-unit value/direction representation, there was relatively little encoding of the predicted outcome flavor independent of its number. Indeed only 3 of 66 neurons exhibited a main effect of flavor in their firing without any additional effect of number (Fig. 2C), a fraction of units that is not significantly different from chance (by chi-square test, p=0.74).
OFC lesions eliminate reward-number representations
The pattern of activity observed in cue-responsive units was dramatically altered when OFC was lesioned unilaterally on the side of the recording electrode. Whereas the prevalence (26/193 units) of cue-responsive neurons in VS was unaffected by the lesions, these units were much more likely to respond to specific flavors independent of their number (Figs. 2F, H). Across the population, there was less number selectivity independent of flavor, and much more flavor selectivity independent of number (Fig. 2D). Indeed only 1 neuron exhibited a pure number-related response (with no additional effect of flavor), a proportion that is not significantly different from chance (by chi-square test, p=0.90). See Table 3 for a full accounting of neuron categorization and statistics.
The effects of OFC lesions were also evident in the population response, which while showing a robust cue-response, was not biased to fire to the large reward as a population, in either the preferred or anti-preferred direction (Fig. 4; see Table 6 for full statistics; see Supplementary Fig. 2 for the same analyses using t-statistics). Number indices comparing firing based on reward number confirmed this lack of representation; late in blocks in the preferred direction, the mean index score (using either the subtraction index or a t-statistic) was not significantly shifted towards from zero, and the number of significantly selective neurons (4 small-preferring vs. 4 large-preferring) was equally distributed. In addition, a direct comparison of the t-statistic showed that number-selectivity indices of the populations in lesion and sham rats were significantly different (see Supplementary Table 4 for full statistics). The effect of lesions on number encoding could also be seen by comparing the development of number-selectivity with changes in choice behavior after number switches: in shams, average number-indices showed a steady increase paralleling the development of choice rate towards the newly large side; in the lesion group, average number indices were unstable at the beginning of blocks and failed to show a steady increase (Figure 5; see Supplementary Fig. 3 for the same analyses using t-statistics).
Figure 4. Outcome selectivity in ventral striatum of OFC lesioned rats.

A. Shown are population averages of normalized firing rate across the time of the trial, aligned to the end of the odor period, for all odor-responsive units (n=26). Activity is averaged by preferred (left panel) and anti-preferred (right panel) directions, and by the specific reward available at the end of the trial (in different colors). Preferred direction was defined for each unit by the direction with the highest average activity during the epoch from odor initiation to response initiation (in gray shading). Only correct forced-choice trials in the latter part of the block (after the first twenty correct trials) are included in the averages. There were no bins with significant effects of number or flavor, by ANOVA on a sliding average of five bins across neurons.
B. Shown are number-selectivity indices during the odor epoch for each neuron in the population, separately for the preferred (left panels) and anti-preferred (right panels) directions. Insets show indices early in blocks immediately following number shifts. Number-selectivity index was defined as the difference in normalized firing rate between conditions with the large reward and those with the small reward. Dark-coded units are those in which this difference was significant across trials. Unlike in controls, indices were not more likely to prefer the large outcome in any condition (see below for detailed statistics)
C. Shown are flavor-selectivity indices with the same conventions as in B., with insets showing the indices in the trials immediately after flavor shifts. Indices were not shifted towards either flavor in any condition, but like controls had a larger magnitude (absolute value) and were more likely to be significant, in the preferred direction compared to the anti-preferred, late in blocks. In the preferred direction, flavor indices were significantly larger in magnitude in the lesion group compared to the sham group consistent with a stronger representation of flavor after OFC lesions.
Table 6. Number selectivity in cue-selective neurons recorded in lesion vs. sham rats, statistics.
Listed are the results of a mixed ANOVA on number-selectivity indices across cue-selective neurons in both groups, with factors group (sham or lesion), time (early or late in blocks), and direction (preferred or anti-preferred).
| Planned comparisons (each tests whether indices are significantly shifted from zero): | Planned comparison: lesion vs. sham | ||||||
|---|---|---|---|---|---|---|---|
| time X direction group | lesion preferred direction |
lesion anti-preferred direction |
late in blocks preferred direction lesion vs. sham | effects of hemisphere | |||
| early in blocks | late in blocks | early in blocks | late in blocks | ||||
| F | 5.7 | 2.0 | 0.1 | 3.1 | 1.1 | 3.1 | F’s<0.5 |
| df | 1,90 | 1,90 | 1,90 | 1,65 | 1,90 | 1,90 | 1,88 |
| p | <0.05 | 0.16 | 0.71 | 0.08 | 0.30 | 0.081 | p’s>0.47 |
For the last column, the hemisphere in which the recording was made was included as an additional factor. An additional ANOVA comparing the magnitude of number indices (absolute value) late in the block in the preferred direction revealed that number indices were significantly larger in lesions vs. shams (sham: μ=0.085±0.008; lesion: μ=0.13±0.018, F1,90=5.8, p<0.05). df = degrees of freedom.
Figure 5. Number-selectivity of VS cue-responsive neurons develops with choice performance after number switches in the sham group but not in the OFC-lesion group.
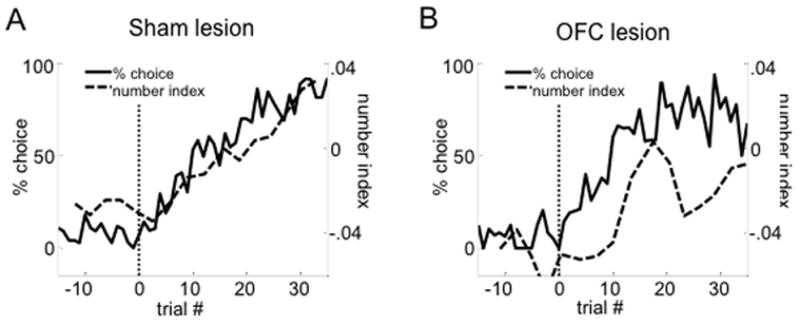
The solid lines show the average percentage of choice of the side on which the large reward was delivered after the block switch (marked by the vertical dotted line). Only free-choice trials that occurred at each trial position of the block were included. The dashed lines show the average number-selectivity index for the comparison of a sliding group of ten forced-choice trials towards the side on which the large reward was delivered around a number block switch minus the corresponding ten forced choice trials towards the same side when the small reward was delivered. Each index value was aligned with the average trial number, relative to the block switch, of the groups of trials with which it was calculated. A shows this comparison for the control group, B for the OFC lesion group. All cue-responsive neurons were included.
In lesioned rats, flavor encoding was similar to that in shams, in that, 1) it was equally distributed between chocolate-preferring and vanilla-preferring, 2) it developed across the block, and 3) it was of greater magnitude (i.e. absolute value of the flavor indices) and more likely to be significant in the preferred direction compared to the anti-preferred. However, it was different than that in shams in that there was a greater proportion of flavor-selective neurons (as mentioned earlier), and the magnitude of indices was greater in the lesioned rats. Thus ipsilateral OFC lesions not only altered and reduced number-related activity, it also seemed to increase flavor-related activity in VS neurons. See Table 7 for full statistics on flavor-selectivity indices in the lesion group.
Table 7. Flavor selectivity in cue-selective neurons recorded in lesion vs. sham rats, statistics.
Listed are the results of a mixed ANOVA on flavor-selectivity indices across cue-selective neurons in both groups, with factors group (sham or lesion), time (early or late in blocks), and direction (preferred or anti-preferred).
| Planned comparisons (each tests whether indices are significantly shifted from zero): | |||||||
|---|---|---|---|---|---|---|---|
| time X direction X group | lesion: preferred direction |
lesion: anti-preferred direction |
absolute value of indices | ||||
| early in blocks | late in blocks | early in blocks | late in blocks | late in blocks, preferred vs. anti- preferred @ lesion | late in blocks, (preferred vs. anti-preferred) X (sham vs. lesion) | ||
| F | 0.0 | 1.7 | 0.3 | 0.4 | 1.6 | 17.0 | 20.8 |
| df | 1,90 | 1,90 | 1,90 | 1,90 | 1,90 | 1,90 | 1,90 |
| p | 0.88 | 0.19 | 0.57 | 0.54 | 0.21 | <0.0001 | <0.0001 |
In addition to the results in the table, there were no effects of group: main effect, F1,90=0.06, p=0.81; group X time, F1,90=0.62, p=0.43; group X direction, F1,90=1.3, p=0.26. In the last two columns, the magnitude of flavor indices (absolute value) late in the block was tested, demonstrating that neurons in the lesion group, like shams, had significantly larger indices in the preferred direction, and also that lesions enhanced the degree to which neurons encode flavor, compared to shams. df = degrees of freedom.
Activity on free-choice trials
Free-choice trials were included primarily as a way to monitor behavior. It is difficult to analyze the influence of reward and direction on neural activity on these trials, because after learning there is a large asymmetry in the number of choices towards the large vs. small reward (~85% large choice). Nevertheless, it is worth asking whether the firing patterns observed on forced-choice trials described above are similar on free-choice trials. To address this question, we identified 33 and 19 cue-responsive neurons in sham and lesioned rats, respectively, that were recorded in sessions in which the rat made at least one free-choice response after learning in the neuron’s preferred direction in each block. When data from each neuron’s preferred direction was considered, the outcome-index scores of these neurons on free-choice trials were significantly correlated with the scores on forced-choice trials, with the exception of flavor-selectivity indices in shams (Figure 6). These results suggest that the firing patterns observed on forced-choice trials are generally also present in the less reliable free-choice data.
Figure 6. Number-selectivity indices measured on free-choice trials were correlated with those on forced-choice trials, in both the sham and OFC lesion groups. Flavor-selectivity indices were uncorrelated in the sham group but correlated in the OFC lesion group.
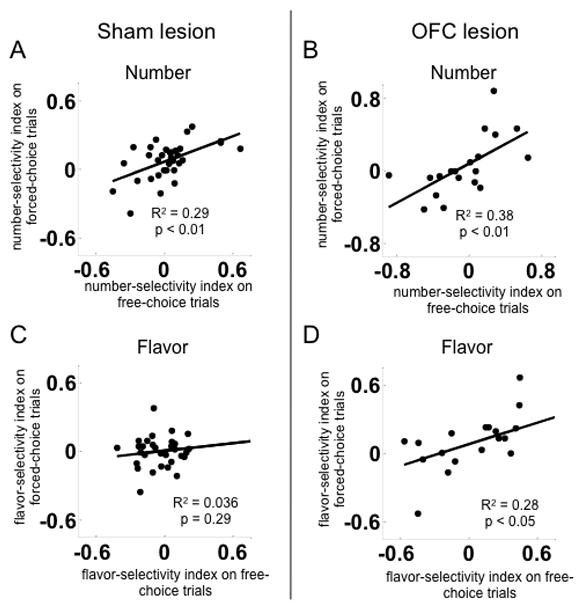
Scatter plots show number-selectivity indices (A and B) on free-choice and matched forced-choice trials, in each neuron’s preferred side, or the corresponding flavor-selectivity indices (C and D) Neurons were only included when recorded in sessions with at least one free-choice trial in each condition on the preferred side.
DISCUSSION
Here we recorded single-unit activity in the VS core in rats performing an odor-guided choice task in which cues predicted different numbers of rewards--a feature related to value--or different flavors of rewards--a feature related to identity--across blocks of trials. Neurons recorded in sham-lesioned rats exhibited differential activity to the cues that reflected information about the expected reward. This activity integrated information about the response required and the value of the expected reward, either alone or in combination with its identity, with relatively little representation of identity alone. Neurotoxic lesions of the OFC ipsilateral to the recording electrode did not affect the proportion of cue-evoked firing nor did it diminish its directional or cue-selectivity; however, the cue-selectivity was more heavily influenced by reward identity and much less by value.
These results demonstrate that the OFC plays a strong role in shaping cue-evoked activity in the VS core. Input from OFC seems to bias what are otherwise largely neutral associative representations reflecting sensory information to represent this information in conjunction with its value or biological significance. Thus in shams, there was significant coding of reward number independent of flavor and an over-representation of the cues predictive of the larger, more valuable reward. Without input from ipsilateral OFC, these representations became more neutral. This was evident in an increase in the number of neurons that responded simply based on the flavor or identity of the predicted reward; however, it was also evident in the loss of the bias in signaling the larger reward. Notably, the loss of this bias was not due to a loss in signaling based on reward number; the prevalence of number-selective neurons was not different between the two groups when those with a flavor interaction were included in the count, and the absolute value of number selectivity index scores (either subtraction or t-statistic) across the population was also not different between the groups. Instead, the number selectivity was simply no longer biased toward the larger reward in the lesion group. In other words, number became more like the other features (flavor, response direction) that continued to be signaled by VS core neurons in the lesioned rats.
What are the implications of this finding? First, it is important to note that, while the OFC projects directly to this region of VS, it also influences processing in a host of other regions, such as amygdala and ventral tegmental area, through which OFC output could impact processing in VS indirectly. Thus the effects of the lesions may be due to the loss of either direct or indirect influence of output from the OFC on processing in VS. Indeed given how strongly these areas are linked, it is particularly interesting that much of the cue-evoked activity in VS was not dependent on the OFC. Overall phasic firing to the cues was largely unaffected, as was the proportion that showed differential activity; it was only the information content of that firing that was shifted.
Second, it is important to note that we used lesions to remove the influence of OFC. Lesions allow for downstream compensation, thus it is possible that over time the VS reorganized to become more sensory specific and less general in the process. This seems somewhat unlikely given that some of the above studies used lesions to disrupt the behaviors, but it cannot be ruled out. The lesions were also unilateral, thus there was preserved processing in the contralateral hemisphere. It is possible that part of the compensation might have even involved strengthening of crossed connections, thus it is possible that the effects of bilateral lesions would be qualitatively different.
These caveats aside, the current results are novel given the apparent differential involvement of VS core and OFC in behaviors such as PIT and unblocking, in which behavior can be driven by either the general value of Pavlovian cues or their ability to predict specific properties of the associated rewards 16,18,32–35. OFC is clearly necessary for the latter process 32–35, whereas the VS core is most commonly proposed to be involved only in the former 16,18 (but see 34). Based on this apparent dichotomy, we expected OFC input to be important for maintaining the specificity of the representations, whereas our results appear to show the opposite. While the OFC has been implicated in specific PIT 33, its role in general PIT has not been directly tested to the best of our knowledge. The current results suggest that it might be important for both. Further, the current results suggest that disconnection of lateral OFC and VS core might also impact general PIT.
Additionally, the current results provide novel insight into how input from OFC impacts processing in downstream areas. The impact of OFC input is subtle. Associative representations in VS core were not silenced by the irreversible loss of OFC input. Indeed they remained largely unchanged in many ways. This is consistent with the relatively subtle effects of OFC damage on behavior. Many if not most simple associative behaviors are not affected by OFC damage 36.
These results also highlight the importance of OFC to determining the biological significance of associative information. Although our design does not explicitly dissociate incidental and biologically meaningful associative information, the associations between the cues and the specific sensory properties of the outcomes would consist of both. The VS receives input from other areas, such as hippocampus, which might be able to signal associative information independent of its significance or value, and neurons in VS core have recently been shown to signal incidental associative information 37. By contrast, the OFC would be more critical for driving the over-representation of specific sensory associations that have biological significance. This is consistent with lesion studies that have typically found that behaviors requiring predictions about the value of outcomes are affected by OFC lesions. That the loss of this information did not impact behavior may reflect the over-training these rats had and/or the operation of the intact hemisphere. Notably, bilateral lesions of VS core have been shown to disrupt value-based changes in the speed of choice behavior in this setting 38. The current results suggest that these effects may reflect the loss of this shaping function of OFC input.
METHODS
Subjects
Male Long-Evans rats were obtained at 175–200g from Charles River Labs, Wilmington, MA. Rats were tested at the University of Maryland School of Medicine in accordance with SOM and NIH guidelines.
Surgical procedures and histology
Surgical procedures followed guidelines for aseptic technique. Electrodes, consisting of drivable bundles of eight 25-um diameter FeNiCr wires (Stablohm 675, California Fine Wire, Grover Beach, CA) electroplated with platinum to an impedance of ~300 kOhms, were manufactured and implanted as in prior recording experiments. Driveable electrodes were implanted bilaterally in ventral striatum (1.6 mm anterior to bregma, ±1.5 mm laterally, and, to begin, 6.0 mm ventral to the surface of the brain) in each rat. Neurotoxic or sham lesions were made by infusing NMDA (or just lowering a pipette) at four different positions in one hemisphere (at 4.0 mm anterior to bregma, 3.7 mm and 2.2 mm laterally, and at 3.0 mm anterior to bregma, 4.2 mm and 3.2 mm laterally; infusions consisted of 0.1 μl of 12.5 mg/ml NMDA solution in saline, except for the final position, which consisted of 0.05 μl of the same solution). Lesions were made in the left hemisphere in two rats, and the right hemisphere in the other three. Results of the neural analysis did not differ by location of lesion, and hence the two lesion groups were combined. Recorded units from hemispheres contralateral to lesions showed some characteristics in common with those from ipsilateral hemispheres; however, because the number of units from the contralateral side was relatively low (n=139), we could not draw strong conclusions about the effects of contralateral vs. ipsilateral lesions. Therefore, only units from the ipsilateral side were included in the final analysis. In sham rats, results did not differ by recorded hemisphere and hence both were included. At the end of the study, final electrode positions were marked, the rats were euthanized with an overdose of isoflurane and perfused, and the brains were removed from the skulls and processed using standard techniques. Some sections from one sham and one lesioned rat were lost during a laboratory move; results did not differ in these rats versus other subjects nor did the main findings depend on their inclusion.
Behavioral task
Recording was conducted in aluminum chambers, on one wall of which was a panel with an odor port and two fluid wells arranged below it (see Figure 1). The odor port was connected to an air flow dilution olfactometer to allow the rapid delivery of olfactory cues. The fluid wells were connected to fluid delivery lines containing flavored milk (Nesquick brand chocolate or vanilla) diluted 50% with water. Delivery of odors at the odor port and the fluids at the fluid wells was controlled by a custom C++ program interfaced with solenoid valves. Photobeam breaks at the port and wells were monitored and recorded by the program. A houselight was also controlled by the program.
Rats were shaped to nosepoke and respond at the fluid wells according to instructional odor cues before undergoing surgery to create lesions and implant electrodes. After recovery, we retrained rats to work with the recording cable. Each training session included as many trials as a rat would perform before quitting, ~150–250. Recording was begun when rats could complete five blocks of trials (at least 260 trials) with the cable.
Each recording session consisted of a series of self-paced trials organized into five blocks. Rats could initiate a trial by poking into the odor port while the house light was illuminated. Beginning 500 ms after the odor poke, an odor would be delivered for 500 ms. If the rat withdrew from the odor port before completion of the 1000 ms pre-odor + odor period, the trial would be aborted and the houselight turned off. At the end of the odor, rats could respond by moving from the odor port to the left fluid well or the right fluid well, after which they had to wait for 500 ms before fluid delivery began; if they exited the well during this period, no fluid was delivered and the trial ended. The identity of the odor specified whether they could receive reward at the left well (forced-choice left), the right well (forced-choice right), or either well (free-choice). The identity and meaning of these odors remained the same across the entire experiment. Odors were presented in a pseudorandom sequence such that the free-choice odor was presented on 7/20 trials and the left/right odors were presented in equal numbers (±1 over 250 trials). In addition, the same odor could be presented on no more than 3 consecutive trials.
Rewards were either one bolus or three boli of chocolate or vanilla milk, with bolus number ~0.05 ml and 500 ms between boli. Response-reward contingencies were consistent within blocks of trials, such that the same reward would be delivered for every correct right response, either free- or forced-choice, and a different reward would be delivered for every correct left response, free- or forced-choice. The reward schedule was arranged so that in each block, reward features available on one side were always paired with the opposite reward features on the other side – thus when one drop of chocolate milk was available on the left, three drops of vanilla was available on the right, etc., resulting in a total of four different reward combinations. On the first block, which was used to set the rats’ expectations before the initial block switch, one of these combinations was randomly chosen. The subsequent four block transitions then followed, in order: 1) a drop-number transition, in which the side with one drop changed to three drops and vice versa, but the side-flavor contingencies remained the same; 2) a flavor transition, in which the side with chocolate changed to vanilla and vice versa, but the side-number contingencies remained the same, 3) another drop-number transition, 4) another flavor transition. These block transitions were not explicitly signaled.
During testing, rats were limited to 10 minutes of ad lib water each day, in addition to fluid earned in the task.
Flavor preference testing
In six rats from a separate experiment (same strain and source, and same water restriction regimen) we compared consumption of the chocolate vs. vanilla milk solution in two-bottle tests. All rats were tested for ten total minutes, with the location of the bottles swapped every 30 seconds. Two rats were given five 2-minute tests while the other four rats were given one 10-minute test each.
Single-unit recording
Procedures were the same as described previously39. Wires were screened for activity daily; if no activity was detected, the rat was removed and the electrode assembly was advanced 40 or 80 um. Otherwise a session was conducted, and the electrode was advanced by at least 40 um at the end of the session. Neural activity was recorded using Plexon Multichannel Acquisition Processor systems (Dallas, TX), interfaced with odor discrimination training chambers. Signals from the electrode wires were amplified and filtered by standard procedures described in previous studies. Waveforms (>2.5:1 signal-to-noise) were extracted from active channels and recorded with event timestamps sent by the behavioral program. Waveforms were not inverted before data analysis.
Data analysis
Units were sorted using Offline Sorter software from Plexon Inc. (Dallas, TX), using a template matching algorithm. Sorted files were then processed in Neuroexplorer to extract unit timestamps and relevant event markers. These data were subsequently analyzed in Matlab (Natick, MA).
To analyze cue-evoked activity, we examined firing rate in the epoch between initiation of odor delivery and odor port exit. We first screened for odor-responsive neurons by testing, across all correct forced-choice trials, for units that showed a significant increase over baseline (defined as firing rate between two seconds before odor poke to one second before odor poke; t-test, p<0.05). Among these units, we next tested for effects of predicted outcome. We divided trials by whether they occurred before (early) or after (late) the twentieth correct trial in each block. We then assigned each unit’s preferred direction as that which had the highest average firing rate during the odor epoch on correct forced-choice trials occurring late in blocks. We performed an ANOVA with factors number (3 drops or 1 drop) and flavor (chocolate or vanilla) on firing rate in the preferred direction, and for comparison, in the anti-preferred direction. Neurons were coded as significantly number-encoding when there was an effect of number or an interaction of number with flavor, and significantly flavor-encoding when there was an effect of flavor or an interaction of flavor with number (α= 0.05). An ANOVA with direction as an additional factor resulted in qualitatively similar results.
To measure the degree of number- and flavor-selectivity, we calculated a number and flavor index for each neuron in each direction. To do so, we peak-normalized each neuron by dividing all firing rates by a normalization factor, which was the peak firing rate across the trial in 500 ms bins after averaging across the first ten and last ten of each of the eight number-flavor-well conditions in the last four blocks. We then calculated the number and flavor indices separately in the preferred and anti-preferred directions as:
For the “early” condition, the above formulas only included trials occurring before the first twenty correct trials in blocks immediately after number switches for the number index and immediately after flavor switches for the flavor index. The “late” condition included trials occurring after the first twenty in any block.
We also recalculated all indices as the t-statistic resulting from the comparison of the two conditions across trials (e.g. 3-drop trials occurring after the first twenty in any block vs. 1-drop trials occurring after the first twenty in any block).
We tested the development of number-selectivity at the start of blocks by calculating a moving average of the subtraction index and the t-statistic across all cue-responsive neurons, using a block of ten trials in each condition before the block switch, and then stepping the blocks of ten up by one trial, across the block. These moving averages were aligned to the average trial, relative to the block switch, across the trials that were used for each index or t-statistic, and plotted against the choice percentage towards the large reward at the same trial position in the block.
The neural analyses described above all used forced-choice trials, because these trials were equally distributed between the two sides across all blocks. To examine encoding on free-choice trials, we matched free-choice trials with forced-choice trials occurring in the same block and direction, and approximately the same position within the block. Specifically, for each free-choice trial, we took the closest forced-choice trial that occurred before the free-choice trial (in the same direction and block) and the closest forced-choice trial that occurred after the free-choice trial (in the same direction and block), and averaged the binned firing rates between those two trials. We then compared indices based on free-choice trials with the corresponding indices based on the matched set of forced-choice trials.
To test whether the population neural results were consistent across recordings from different rats, we performed separate ANOVAs with “rat” as an additional factor (with neuron being the subject), and examined interactions between factors of interest and “rat”.
Statistics were done using Matlab, Excel, and Statistica. For displays of neural activity, bin-number was 100 ms. Neural activity in the displays was smoothed with a boxcar algorithm, with a 3-bin boxcar for population plots and a 9-bin boxcar for single-unit plots. To display bin-by-bin effects of number or flavor, we calculated a sliding average of 5 bins and performed an ANOVA, separately for data from each side (across trials for the single-unit data, and across neurons for the population data). To meet significance, a set of bins had to be part of at least three consecutive sliding bin-sets that showed a main effect (at p<0.05). Significant bin-sets were then plotted across the middle 3 bins for each set on the activity plots, separately for number and flavor main effects. To make plots of trial-by-trial choice rate (Figure 1), we first aligned all rewarded trials for all blocks, and for each trial (1st, 2nd, 3rd, etc. after the block switch) we took the proportion of choices towards the side with the 3-drop reward, excluding all blocks in which a forced-choice trial happened to occur on that trial. The line was then smoothed using a 3-bin boxcar, separately for before and after the switch.
Supplementary Material
Acknowledgments
This work was supported by funding from NIDA. The opinions expressed in this article are the authors’ own and do not reflect the view of the National Institutes of Health, the Department of Health and Human Services, or the United States government.
Footnotes
AUTHOR CONTRIBUTIONS
N.K.C., T.A.S., and G.S. conceived the experiments; N.K.C. carried out the experiments, with assistance from S.C., M.A.M., T-L.L. and H.W. T.A.S. and N.K.C. analyzed the results, and the manuscript was prepared by T.A.S., N.K.C., and G.S. with input from the other authors.
COMPETING FINANCIAL INTERESTS
The authors declare no competing financial interests.
References
- 1.Mogenson GJ, Jones DL, Yim CY. From motivation to action: functional interface between the limbic system and the motor system. Progress in Neurobiology. 1980;14:69–97. doi: 10.1016/0301-0082(80)90018-0. [DOI] [PubMed] [Google Scholar]
- 2.Groenewegen HJ, Wright CI, Beijer AV, Voorn P. Convergence and segregation of ventral striatal inputs and outputs. Ann N Y Acad Sci. 1999;877:49–63. doi: 10.1111/j.1749-6632.1999.tb09260.x. [DOI] [PubMed] [Google Scholar]
- 3.Cador M, Robbins TW, Everitt BJ. Involvement of the amygdala in stimulus-reward associations: interactions with the ventral striatum. Neuroscience. 1989;30:77–86. doi: 10.1016/0306-4522(89)90354-0. [DOI] [PubMed] [Google Scholar]
- 4.Everitt BJ, Morris KA, O’Brien A, Robbins TW. The basolateral amygdala-ventral striatal system and conditioned place preference: further evidence of limbic-striatal interactions underlying reward-related processes. Neuroscience. 1991;42:1–18. doi: 10.1016/0306-4522(91)90145-e. [DOI] [PubMed] [Google Scholar]
- 5.Johnson A, van der Meer MAA, Redish AD. Integrating hippocampus and striatum in decision-making. Current Opinion in Neurobiology. 2007;17:692–697. doi: 10.1016/j.conb.2008.01.003. [DOI] [PMC free article] [PubMed] [Google Scholar]
- 6.Roesch MR, Singh T, Brown PL, Mullins SE, Schoenbaum G. Ventral striatal neurons encode the value of the chosen action in rats deciding between differently delayed or sized rewards. Journal of Neuroscience. 2009;29:13365–13376. doi: 10.1523/JNEUROSCI.2572-09.2009. [DOI] [PMC free article] [PubMed] [Google Scholar]
- 7.Roitman MF, Wheeler RA, Carelli RM. Nucleus accumbens neurons are innately tuned for rewarding and aversive taste stimuli, encode their predictors, and are liinked to motor output. Neuron. 2005;45:587–597. doi: 10.1016/j.neuron.2004.12.055. [DOI] [PubMed] [Google Scholar]
- 8.Cheer JF, et al. Coordinated accumbal dopamine release and neural activity drive goal-directed behavior. Neuron. 2007;54:237–244. doi: 10.1016/j.neuron.2007.03.021. [DOI] [PubMed] [Google Scholar]
- 9.Day JJ, Jones JL, Carelli RM. Nucleus accumbens neurons encode predicted and ongoing reward costs in rats. European Journal of Neuroscience. 2011;33:308–321. doi: 10.1111/j.1460-9568.2010.07531.x. [DOI] [PMC free article] [PubMed] [Google Scholar]
- 10.Saddoris MP, Stamatakis A, Carelli RM. Neural correlates of Pavlovian-to-instrumental transfer in the nucleus accumbens shell are selectively potentiated following cocaine self-administration. European Journal of Neuroscience. 2011;33:2274–2287. doi: 10.1111/j.1460-9568.2011.07683.x. [DOI] [PMC free article] [PubMed] [Google Scholar]
- 11.Nicola SM, Yun IA, Wakabayashi KT, Fields HL. Cue-evoked firing of nucleus accumbens neurons encodes motivational significance during a discriminative task. Journal of Neurophysiology. 2004;91:1840–1865. doi: 10.1152/jn.00657.2003. [DOI] [PubMed] [Google Scholar]
- 12.Goto Y, O’Donnell P. Timing-dependent limbic-motor synaptic integration in the nucleus accumbens. Proceedings of the National Academy of Science. 2002;99:13189–13193. doi: 10.1073/pnas.202303199. [DOI] [PMC free article] [PubMed] [Google Scholar]
- 13.Janak PH, Chen MT, Caulder T. Dynamics of neural coding in the accumbens during extinction and reinstatement of rewarded behavior. Behavioral Brain Research. 2004;154:125–135. doi: 10.1016/j.bbr.2004.02.003. [DOI] [PubMed] [Google Scholar]
- 14.Bissonette GB, et al. Separate populations of neurons in ventral striatum encode value and motivation. PLos One. 2013;8:e64673. doi: 10.1371/journal.pone.0064673. [DOI] [PMC free article] [PubMed] [Google Scholar]
- 15.Balleine BW, Killcross S. Effects of ibotenic acid lesions of the nucleus accumbens on instrumental action. Behavioral Brain Research. 1994;65:181–193. doi: 10.1016/0166-4328(94)90104-x. [DOI] [PubMed] [Google Scholar]
- 16.Corbit LH, Muir JL, Balleine BW. The role of the nucleus accumbens in instrumental conditioning: evidence of a functional dissociation between accumbens core and shell. Journal of Neuroscience. 2001;21:3251–3260. doi: 10.1523/JNEUROSCI.21-09-03251.2001. [DOI] [PMC free article] [PubMed] [Google Scholar]
- 17.Bertran-Gonzalez J, Chieng B, Laurent V, Valient E, Balleine BW. Striatal cholinergic interneurons display activity-related phosphorylation of ribosomal protein S6. PLoS ONE. 2012;7:e53195. doi: 10.1371/journal.pone.0053195. [DOI] [PMC free article] [PubMed] [Google Scholar]
- 18.Corbit LH, Balleine BW. The general and outcome-specific forms of Pavlovian-instrumental transfer are differentially mediated by the nucleus accumbens core and shell. Journal of Neuroscience. 2011;31:11786–11794. doi: 10.1523/JNEUROSCI.2711-11.2011. [DOI] [PMC free article] [PubMed] [Google Scholar]
- 19.Setlow B, Holland PC, Gallagher M. Disconnection of the basolateral amygdala complex and nucleus accumbens impairs appetitive Pavlovian second-order conditioned responses. Behavioral Neuroscience. 2002;116:267–275. doi: 10.1037//0735-7044.116.2.267. [DOI] [PubMed] [Google Scholar]
- 20.van der Meer MA, Redish AD. Covert expectation of reward in rat ventral striatum at decision points. Frontiers in Integrative Neuroscience. 2009;3 doi: 10.3389/neuro.07.001.2009. Epub 2009 Feb 2005. [DOI] [PMC free article] [PubMed] [Google Scholar]
- 21.Hall J, Parkinson JA, Connor TM, Dickinson A, Everitt BJ. Involvement of the central nucleus of the amygdala and nucleus accumbens core in mediating Pavlovian influences on instrumental behavior. European Journal of Neuroscience. 2001;13:1984–1992. doi: 10.1046/j.0953-816x.2001.01577.x. [DOI] [PubMed] [Google Scholar]
- 22.Cardinal RN, et al. Effects of selective excitotoxic lesions of the nucleus accumbens core, anterior cingulate cortex, and the central nucleus of the amygdala on autoshaping performance in rats. Behavioral Neuroscience. 2002;116:553–567. doi: 10.1037//0735-7044.116.4.553. [DOI] [PubMed] [Google Scholar]
- 23.Stuber GD, et al. Excitatory transmission from the amygdala to nucleus accumbens facilitates reward seeking. Nature. 2011;475:377–380. doi: 10.1038/nature10194. [DOI] [PMC free article] [PubMed] [Google Scholar]
- 24.Lansink CS, Goltstein PM, Lankelma JV, McNaughton BL, Pennartz CM. Hippocampus leads ventral striatum in replay of place-reward information. PLoS biology. 2009;7:e1000173. doi: 10.1371/journal.pbio.1000173. [DOI] [PMC free article] [PubMed] [Google Scholar]
- 25.Voorn P, Vanderschuren LJMJ, Groenewegen HJ, Robbins TW, Pennartz CMA. Putting a spin on the dorsal-ventral divide of the striatum. Trends in Neurosciences. 2004;27:468–474. doi: 10.1016/j.tins.2004.06.006. [DOI] [PubMed] [Google Scholar]
- 26.Groenewegen HJ, Berendse HW, Wolters JG, Lohman AHM. The anatomical relationship of the prefrontal cortex with the striatopallidal system, the thalamus and the amygdala: evidence for a parallel organization. Progress in Brain Research. 1990;85:95–118. doi: 10.1016/s0079-6123(08)62677-1. [DOI] [PubMed] [Google Scholar]
- 27.Wright CI, Beijer AVJ, Groenewegen HJ. Basal amygdaloid complex afferents to the rat nucleus accumbens are compartmentally organized. Journal of Neuroscience. 1996;16:1877–1893. doi: 10.1523/JNEUROSCI.16-05-01877.1996. [DOI] [PMC free article] [PubMed] [Google Scholar]
- 28.Berendse HW, Galis-de Graaf Y, Groenewegen HJ. Topographical organization and relationship with ventral striatal compartments of prefrontal corticostriatal projections in the rat. Journal of Comparative Neurology. 1992;316:314–347. doi: 10.1002/cne.903160305. [DOI] [PubMed] [Google Scholar]
- 29.Shi CJ, Cassell MD. Cortical, thalamic, and amygdaloid connections of the anterior and posterior insular cortices. Journal of Comparative Neurology. 1998;399:440–468. doi: 10.1002/(sici)1096-9861(19981005)399:4<440::aid-cne2>3.0.co;2-1. [DOI] [PubMed] [Google Scholar]
- 30.Schoenbaum G, Roesch M. Orbitofrontal cortex, associative learning, and expectancies. Neuron. 2005;47:633–636. doi: 10.1016/j.neuron.2005.07.018. [DOI] [PMC free article] [PubMed] [Google Scholar]
- 31.Bermpohl F, et al. Altered representation of expected value in the orbitofrontal cortex in mania. Human brain mapping. 2010;31:958–969. doi: 10.1002/hbm.20909. [DOI] [PMC free article] [PubMed] [Google Scholar]
- 32.Delamater AR. The role of the orbitofrontal cortex in sensory-specific encoding of associations in pavlovian and instrumental conditioning. Annals of the New York Academy of Science. 2007;1121:152–173. doi: 10.1196/annals.1401.030. [DOI] [PubMed] [Google Scholar]
- 33.Ostlund SB, Balleine BW. Orbitofrontal cortex mediates outcome encoding in Pavlovian but not instrumental learning. Journal of Neuroscience. 2007;27:4819–4825. doi: 10.1523/JNEUROSCI.5443-06.2007. [DOI] [PMC free article] [PubMed] [Google Scholar]
- 34.McDannald MA, Lucantonio F, Burke KA, Niv Y, Schoenbaum G. Ventral striatum and orbitofrontal cortex are both required for model-based, but not model-free, reinforcement learning. Journal of Neuroscience. 2011;31:2700–2705. doi: 10.1523/JNEUROSCI.5499-10.2011. [DOI] [PMC free article] [PubMed] [Google Scholar]
- 35.Burke KA, Franz TM, Miller DN, Schoenbaum G. The role of the orbitofrontal cortex in the pursuit of happiness and more specific rewards. Nature. 2008;454:340–344. doi: 10.1038/nature06993. [DOI] [PMC free article] [PubMed] [Google Scholar]
- 36.Schoenbaum G, Takahashi YK, Liu TL, McDannald M. Does the orbitofrontal cortex signal value? Annals of the New York Academy of Sciences. 2011;1239:87–99. doi: 10.1111/j.1749-6632.2011.06210.x. [DOI] [PMC free article] [PubMed] [Google Scholar]
- 37.Cerri DH, Saddoris MP, Carelli RM. Nucleus accumbens core neurons encode value-independent associations necessary for sensory preconditioning. Behavioral Neuroscience. 2014;128:567–578. doi: 10.1037/a0037797. [DOI] [PMC free article] [PubMed] [Google Scholar]
- 38.Burton AC, Bissonette GB, Lichtenberg NT, Kashtelyan V, Roesch MR. Ventral striatum lesions enhance stimulus and response encoding in dorsal striatum. Biological Psychiatry. 2014;75:132–139. doi: 10.1016/j.biopsych.2013.05.023. [DOI] [PMC free article] [PubMed] [Google Scholar]
- 39.Stalnaker TA, Calhoon G, Ogawa M, Roesch MR, Schoenbaum G. Neural correlates of stimulus-response and response-outcome associations in dorsolateral versus dorsomedial striatum. Frontiers in Integrative Neuroscience. 2010;4 doi: 10.3389/fnint.2010.00012. [DOI] [PMC free article] [PubMed] [Google Scholar]
Associated Data
This section collects any data citations, data availability statements, or supplementary materials included in this article.