

Abstract
As image guided surgical procedures become increasingly diverse, there will be more scenarios where point-based fiducials cannot be accurately localized for registration and rigid body assumptions no longer hold. As a result, procedures will rely more frequently on anatomical surfaces for the basis of image alignment and will require intraoperative geometric data to measure and compensate for tissue deformation in the organ. In this paper we outline methods for which a laser range scanner may be used to accomplish these tasks intraoperatively. A laser range scanner based on the optical principle of triangulation acquires a dense set of three-dimensional point data in a very rapid, noncontact fashion. Phantom studies were performed to test the ability to link range scan data with traditional modes of image-guided surgery data through localization, registration, and tracking in physical space. The experiments demonstrate that the scanner is capable of localizing point-based fiducials to within 0.2 mm and capable of achieving point and surface based registrations with target registration error of less than 2.0 mm. Tracking points in physical space with the range scanning system yields an error of 1.4±0.8 mm. Surface deformation studies were performed with the range scanner in order to determine if this device was capable of acquiring enough information for compensation algorithms. In the surface deformation studies, the range scanner was able to detect changes in surface shape due to deformation comparable to those detected by tomographic image studies. Use of the range scanner has been approved for clinical trials, and an initial intraoperative range scan experiment is presented. In all of these studies, the primary source of error in range scan data is deterministically related to the position and orientation of the surface within the scanner’s field of view. However, this systematic error can be corrected, allowing the range scanner to provide a rapid, robust method of acquiring anatomical surfaces intraoperatively.
I. INTRODUCTION
Tissue deformation and organ shift are presently one of the largest challenges that image-guided surgery research faces today. To overcome these obstacles, there have been numerous efforts to incorporate intraoperative data into surgical navigation as well as to model the deformation using biomechanical principles. The most accurate and complete method to account for tissue deformation is to acquire image data during surgery with intraoperative tomographic imaging. Intraoperative CT was proposed,1 but it was found to expose the patient to excessive amounts of radiation. More recently, intraoperative MR (iMR) imaging has become a candidate to account for tissue deformation. There have been many groups who have implemented iMR into their image-guided surgical systems, and a sampling of the research can be found in the literature.2–7
While iMR does provide a complete set of updated volumetric data, there are some disadvantages. Currently, it is difficult, time-consuming, and expensive to install an intraoperative magnetic resonance unit into an operating suite. MR scanners (including open magnet configurations) and head receiver coils, combined with the limited space generally available in operating rooms, can hinder access to the surgical site.8 Nonferrous surgical instruments, often not of the same quality as standard surgical instruments, must be used during procedures close to the magnet.8,9 Finally, there are issues with image quality, whether from low field strength magnets or from surgically induced contrast enhancement.10
Other methods have been proposed to help compensate for tissue deformation during surgery. Ultrasound is conventionally used to provide real-time information for guidance during surgical procedures. Currently, most surgeons subjectively analyze data from ultrasound to make their decisions regarding tissue deformation. However, there is some research concerned with mathematically integrating ultrasound into image-guided neurosurgery systems.11–14
Some methods of deformation compensation do not involve any intraoperative imaging. Finite element models have been used to predict organ deformation that results from various events that occur during surgery. Since a majority of image-guided research is based in neurosurgery, where accuracy is paramount, most surgical-based modeling studies have been performed with respect to the brain. Some recent strategies used for modeling the biomechanics of brain deformation have included biphasic descriptions of the continuum based on consolidation theory.15 These models simulate deformation effects from mechanical loading as well as from interstitial fluid flow.16,17 Edwards et al.18 developed a three-component model to account for the interactions between bone, cerebrospinal fluid, and brain tissue. In other cases, finite element modeling is not as concerned with the underlying biomechanics of the tissue, but rather as an interpolation method for registration.6 Other models of the brain that have been proposed use linear elastic19 and viscoelastic20 models. In large part, finite element modeling has not been used for image-guided surgical updating outside the neurosurgical context. However, computer models are increasingly being used for planning, simulation, and evaluation applications for a host of surgical procedures.21–25
One novel method of intraoperative data acquisition is laser range scanning. This modality acquires a dense amount of surface data, which is represented as a three-dimensional point cloud. Unlike most surface acquisition methods used in an operating room, laser range scanners do not require any contact with the patient. Preliminary work by Audette et al.26 has examined laser range scanning for cortical surface tracking and brain shift issues. Raabe et al.27 illuminated the skin surface with a laser and used optical localization systems to triangulate the depth of the laser spot. Furushiro et al.28 have used range scanners to detect ridgelines in liver phantoms for registration purposes. In other phantom studies, Sinha et al.29 registered range scanner data with texture mapped video information to MR volumes using the simulated cortical surface vessel patterns.
We present accuracy studies characterizing the range scanner’s ability to capture organ shape. Registration to tomographic image data and optical localization methods techniques are implemented to determine the ability for range scan data to be used accurately with common image-guided surgery components. Additionally, the range scanner is used to observe deformation in an organ phantom. Finally, we present some of our initial experiences with the use of the laser range scanner in a clinical setting.
II. METHODS
A. Laser scanner
Three-dimensional surfaces were acquired with a commercially available laser range scanner (Real Scan 200C, 3-D Digital Corporation, Bethel, CT), which is displayed in Fig. 1. The scanner works on the optical principle of triangulation. A laser light source is emitted from the scanner, which illuminates the surface of interest. Light reflected off the surface is received by a CCD camera, which is contained within the scanner. The depth is calculated based on the reflected light pattern that appears on the CCD and the known trigonometric relationship between the scanner’s camera and source. Our range scanner is capable of acquiring a dense point set of three-dimensional data within 5–20 seconds. It can acquire up to 494 samples per line and as many as 500 lines per scan. The specifications of the scanner30 state that the average deviation from planarity is 300 μm at 300 mm depth and 1000 μm at 800 mm depth.
Fig. 1.

The RealScan 3-D Laser range scanner mounted to an OR mechanical arm.
B. Imaging phantom
A phantom was constructed for all localization and registration experiments. The phantom, shown in Fig. 2, was designed to contain a wealth of surface and fiducial point information that could be highly localized in many modalities. The liver model in Fig. 2 was constructed with poly (dim-ethyl) siloxane (rubber silicone) to represent our test surface. Teflon spheres (Small Parts Inc., Miami Lakes, FL) served as point-based fiducials for our experiments. The spheres were precisely machined to 12.70 mm with a 25 μm tolerance. To obtain fiducial point data from the range scans, centroids of the sphere were calculated with a geometric fitting of the sphere using a least squares method, as proposed by Ahn et al.31 An example of the results from the sphere fit is shown in Fig. 3, where the range scan points have been overlaid on top of the sphere obtained using the fitting process. Additionally, the model liver and spheres were placed on a Plexiglas® base that had been painted black. The black paint absorbs a majority of the laser light illuminating the base, and the reflected light signal is so small that it simulates an infinite distance. As a result, no range scan data of the base is acquired, making the phantom liver and the spheres much easier to identify.
Fig. 2.

The imaging phantom consists of a model organ surface as well as white Teflon balls used as fiducials. To eliminate unwanted data, the base of the phantom has been painted black so there will not be enough signal for the range scanner to calculate depth at that point, making the surface and fiducials easier to identify.
Fig. 3.

An example of the sphere-fitting algorithm. The black dots represent points from the range scanner and the gray sphere is the sphere fitted from this data. If a point is completely visible, then it lies outside the sphere surface. Points inside the sphere are partially or completely obscured.
C. Point-based localization
To determine the scanner’s accuracy in acquiring spatial surface information, three sets of localization experiments were performed. The first experiment investigated the scanner’s ability to acquire images of the sphere with respect to the scanner’s field of view. A sphere was placed on a translation stage and repeatedly scanned while varying depth. The next set of experiments attempted to test the repeatability of the scanner output. A total of ten range scans were taken while holding the phantom and range scanner fixed. Ideally, the centroid of each sphere should remain unchanged. Finally, the ability to track objects in space as they move throughout the scanner’s field of view was tested. After each sphere was acquired from the range scan image, the surface of each sphere was collected using a probe that was localized in physical space using an infrared optical camera (OP-TOTRAK 3020, Northern Digital, Waterloo, Ontario). The OPTOTRAK system has an RMS accuracy of 0.1 mm, with a resolution of 0.01 mm.32 After each sphere was acquired in the scene, the phantom was manually moved away from the range scanner. Three sets of sphere data were acquired with the range scanner and the OPTOTRAK; all three sets were positioned at varying depths from the range scanner. Distance measurements were calculated between each fiducial in one data set and its corresponding position when the phantom was placed at a different depth. Distances measured using range scan data were compared to the results achieved with the OPTOTRAK localization system.
D. Registration
A set of experiments was performed to test the ability to register range scan data with CT image data using point and surface based information. The phantom was imaged using a CT scanner (Mx8000—Phillips Medical Systems, Bothell, WA). While the phantom remained on the imaging gantry after volume acquisition, range scan images were taken. Point-based registrations with the sphere centroids as fiducials were achieved using Horn’s quaternion method33 to solve the singular value decomposition (SVD), as well as a modification which allows for incorporating a similarity transform with an isotropic scaling factor.34 The use of a scaling factor is explained further in the “Discussion” section. Surface based registrations were performed using the Iterative Closest Point (ICP) algorithm postulated by Besl and McKay,35 altered to use k-d dimensional trees to decrease search time.36,37 Landmarks on the surface phantom were used to obtain an initial transformation for the ICP method. ICP minimizes the mean surface residual error, which is the mean distance between each point in the source dataset and its corresponding closest point in the target dataset. One point-based landmark, the head of a nylon screw that secured the liver phantom to the base, was not used in either registration process. It served as a target for error analysis of the registration. For the surface registration results, the Teflon balls also served as targets, since they were not used to determine the transformation in the surface registration process.
E. Physical space tracking
One of the foundations of image-guided surgery is the establishment of a registration between image space and physical space. By incorporating a range scanner into the system, a third coordinate system has been introduced. In order to interpret geometric data from the laser range scanner, it is critical that the range scanner can be tracked in physical space. Tracking is accomplished by defining a coordinate system for physical space with the OPTOTRAK optical localization system. A star-shaped rigid body embedded with infrared emitting diodes (IREDs) was attached to the range scanner. This rigid body was calibrated and recognized by the OPTOTRAK localization system, so that its position and orientation could be established in real-time.
The tracking setup is shown in Fig. 4. Points in range scanner space, Xrange, are transformed into the physical space, Xopto, by determining two intermediate transformations. The first transformation is between the range scanner and the star-shaped rigid body attached to it, Trange-star. A calibration process, described below, is needed to determine this transformation, which remains constant as long as the star-shaped emitter remains rigidly fixed to range scanner in the same position. The second transformation is between the star-shaped rigid body, and the reference emitter that serves as the origin for the OPTOTRAK coordinate system, Tstar-opto. This transformation is handled by the OPTOTRAK system, and it is refreshed at a rate of 40 Hz.
Fig. 4.
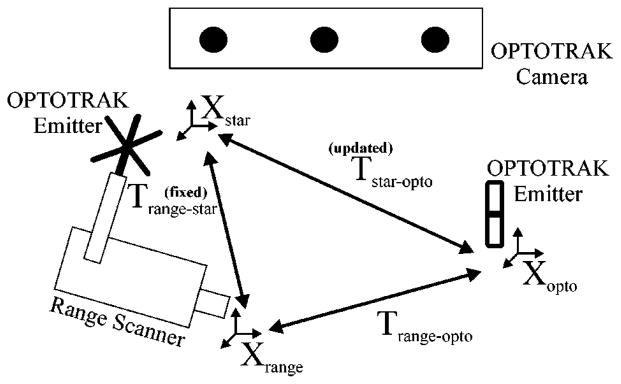
The calibration process used to determine the transformation (Trange-star) between the range scanner (Xrange) and the attached rigid body (Xstar). Once this transformation is known, range scanner points can be transformed into physical space, since the OPTOTRAK is always outputting the transformation between the two emitters (Tstar-opto).
A calibration phantom was designed for the process of determining the transformation Trange-star between the star-shaped emitter and the range scanner. The calibration phantom consisted of nine white disks of radius 9.53 mm located on nine separate black platforms. At the center of the disk was a 3 mm hemispherical divot. When placing the 3 mm ball tip of a tracked surgical probe in the divot, the centroid of the tip will be localized near the center of the white disk. Figure 5 shows an optically localized probe with its spherical tip located in the divot.
Fig. 5.

The calibration phantom with an optical probe and its 3 mm spherical tip placed in the divot of one of the nine white disks.
The first step in calibrating the range scanner for tracking in physical space (i.e., OPTOTRAK space) is to establish a transformation between range scanner space and physical space (Trange-opto) while the range scanner is held at a fixed position. This transformation is achieved through a point-based registration between the centroid of each disk acquired from the range scanner, and the nine corresponding divot locations from the OPTOTRAK probe. Once this transformation is known, the position and orientation of the rigid body emitter attached to the range scanner is ascertained by querying the OPTOTRAK system, which gives the transformation Tstar-opto. Using Trange-opto and Tstar-opto at a given fixed range scanner position, the calibration transformation matrix Trange-star can be determined.
To test the calibration process, multiple trials were undertaken and compared against each other to determine the accuracy and repeatability of this protocol. In between each trial, the range scanner was moved out of the scene containing the phantom and then returned approximately back to its original position, in order to mimic the data acquisition process during surgery; however, for all trials the calibration phantom was held fixed in relation to the OPTOTRAK coordinate system. The calibration procedure was performed and a calibration transformation matrix Trange-star was obtained for each trial. If the calibration transformation matrix was accurate, then new range scan data acquired at a new position in space should ideally result in identical physical space locations as those acquired during calibration. For each set of trials, one was designated as the calibration trial, and the others were designated as test trials. Range scan data from the test trials was transformed into physical space using Eq. (1);
| (1) |
The calibration trial was responsible for providing the calibration transformation matrix Trange-star, while Tstar-opto was used from a test trial, since it represents the position of the range scanner in physical space for that particular trial. The result from this transformation was compared to the actual physical space data acquired from the localization system. Every trial was selected once as the calibration trial so that all the calibration results could be examined.
F. Deformation effects on registration
One important aspect to developing an IGS platform for liver surgery is to understand the effects of soft-tissue deformation on registration accuracy. Within the neurosurgical context, soft tissue deformations have been show to compromise IGS fidelity.38,39 To date, a systematic study of liver deformations and their effects on target localization have not been reported. In this study, realistic liver phantoms are used to estimate the effects of misregistration due to soft tissue deformation.
The nondeformed surface phantom was placed on the CT gantry and imaged. This volume represented our preoperative baseline. After imaging, a range scan of the nondeformed liver phantom was acquired. Two more sets of CT and range scanning were obtained while deforming the phantom surface in two separate areas, resulting in three CT image sets and three range scanner point clouds. A cylindrical object of height 3.7 cm and radius 7.5 cm was placed underneath the organ phantom to cause the deformation. This deformation was intended to mimic the physical manipulation and repositioning of the mobilized liver during a surgical procedure. In the first scan, the object was under the left lobe, and in the second, it was located under the junction between segments III and IV, as defined by the Couinaud segmental anatomy of the liver.40 The rest of the organ is held in place with a screw, which has been inserted into the base, allowing a portion of the organ model to deform while the rest stays relatively fixed. The initial phantom studies examined the effects of deformation on an ICP-based rigid registration algorithm. A registration between nondeformed and deformed data was calculated. Six mock tumors, constructed out of Styrofoam, were inserted into the silicone organ model before it solidified. These mock tumors were spherical in shape with a radius of 11.0 mm. The tumor centroids served as targets for this registration. Both tomographic data and range scan data of the deformed phantom were used to determine the effectiveness of ICP in this regard.
It is imperative that the range scanner provides enough intraoperative surface data to correctly discern organ deformation. If the transformation resulting from range scan data is similar to results using tomographic data, then the range scanner should be capturing enough surface information for this task. All range scan data is first transformed into CT space, so that all data are aligned in the same coordinate system. Two registrations between deformed and nondeformed data are performed: one using range scan data and one using tomographic data. The deformed range scan data is transformed into nondeformed space using both of these transformations. Since the same point set was transformed twice, it has generated two new point sets with a one-to-one correspondence. The distance between corresponding points is calculated in order to determine the similarity between the two transformations.
G. Intraoperative acquisition
Institutional Review Board (IRB) approval has been obtained at Vanderbilt University for the acquisition of range scan and optical localization data during surgical procedures on the liver. Once informed consent has been obtained and the preparation for surgery is underway, the range scanner and star-shaped emitter are mounted to a surgical arm. This surgical arm can be swiveled into the scene so that the range scanner is approximately 1 to 2 feet away from the liver. The patient’s breath is held while any range data or physical space data using a freehand probe is acquired. An initial transformation is achieved using anatomical landmarks, and the surface registrations are performed. The setup of the range scanner in surgery, along with the video and point output of the range scanner from this case, is shown in Fig. 6.
Fig. 6.

(Top left) Digital photograph taken of the operating scene from the viewpoint of the range scanner; (top right) range scanner setup in the OR; and (bottom) laser range scanner output showing a textured point cloud from the liver surface.
III. RESULTS
A. Localization experiments
Using a translation stage, the depth of the ball in scanner space was varied between 300 and 475 mm. This depth range should be similar to the level of access during the surgical procedure. Figure 7 shows the changes in the parameters of the sphere resulting from the fit with respect to depth. As the depth of field increases, the radius holds relatively constant at a value 0.2 mm larger than the machined value, while the residual fitting error increases.
Fig. 7.
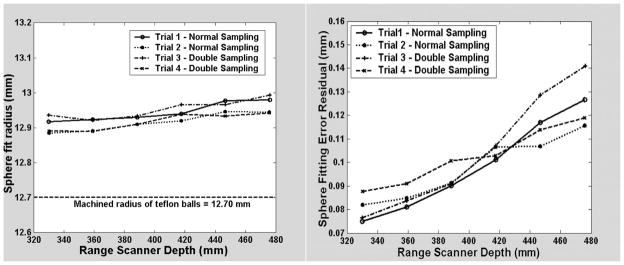
The radius (left graph) and the error residual (right graph) resulting from the sphere fit as a function of the depth in the scanner’s field of view.
In the repeatability experiments, the phantom was scanned 10 times, and for each scan, the 7 spheres were extracted and the centroid calculated. From the ten centroid measurements, a mean centroid position was calculated for each sphere, and the distance error between each individual sphere measurement and its respective mean centroid position was calculated. The resulting mean centroid error over 70 individual sphere measurements was 0.06±0.03 mm, with the maximum mean centroid error being 0.25 mm.
Three sets of data were taken for tracking experiments with the phantom, designated as near, middle, and far based on their depth from the scanner. The depth range of each point cloud was 493.1–691.0 mm for the near set, 654.1–833.7 mm for the middle set, and 837.1–1035.6 mm for the far set. The middle and the far sets are located at distances much farther away than will be used during surgery. Table I shows the results from the tracking experiment. The mean distance that each sphere traveled between acquisitions is very close in both modalities. Since the phantom was not placed on a translation stage, moving the phantom by hand resulted in a slight rotation, causing some spheres to move a shorter distance than others. This is represented by the standard deviation in the first two columns. The mean difference between each individual sphere distance is less than 0.5 mm for the two subset motions, and 0.75 mm for the entire motion.
Table I.
Tracking experiments. The first two columns represent the mean distance that each corresponding ball moved between trials. The last column presents the difference between the range scanner and OPTOTRAK distance measurements of corresponding fiducials. The depth range spanned most of the scanner’s working field of view, with a minimum depth of 493.1 mm and a maximum of 1035.6 mm.
| Mean distance of fiducial movement between sets
|
Difference of corresponding fiducial distances between range scanner and OPTOTRAK (max) | ||
|---|---|---|---|
| Range scan, mm | OPTOTRAK, mm | ||
| Near to middle | 154.0±0.6 | 154.0±0.4 | 0.4±0.2 (0.8) |
| Middle to far | 220.7±5.7 | 220.7±5.6 | 0.4±0.3 (1.0) |
| Near to far | 374.6±5.4 | 374.6±5.2 | 0.8±0.6 (1.7) |
B. Registration experiments
The results from point-based and surface-based range scanner registration experiments on phantoms are shown in Table II. Point based registration between CT images of the phantom and the respective range scans were acquired using the white Teflon spheres. A total of 17 point-based registrations were performed, using 7 spheres as fiducials in each registration. Fiducial registration error (FRE) and target registration error (TRE) as defined by Maurer, Fitzpatrick et al.41 are used to determine the accuracy of the point-based registrations. These measurements are the root mean square (RMS) distances between corresponding landmarks after implementing the transformation. FRE is calculated from points (fiducials) that were used in the registration, while TRE uses points independent from the registration process.
Table II.
Registration results of range scan data to CT data (organ phantom) and physical space data (calibration phantom). Target set (a) represents a nylon screw head on the liver’s surface. Target set (b) refers to the peripheral Teflon spheres that were used as fiducials in the point-based registration but were not used in the surface registration. Target set (c) are points on the calibration phantom not used as fiducials. For each of the 12 trials, there were 126 unique combinations of five fiducials and four targets.
| Phantom | Scaling | Registration method | FRE (points)/ Residual (surface), mm | TRE, mm |
|---|---|---|---|---|
| Organ | Rigid | Point | 2.2±1.3 (6.0) n=119 | (a) 1.7±0.5 (2.5) n=11 |
| Organ | Similarity | Point | 1.1±0.8 (3.5) n=119 | (a) 1.8±0.5 (2.7) n=11 |
| Organ | Rigid | Surface | 0.75±0.07 (0.83) n=6 | (a) 2.0±0.6 (2.7) n=6 (b) 4.1±1.7 (8.1) n=42 |
| Organ | Similarity | Surface | 0.65±0.04 (0.70) n=6 | (a) 2.4±0.5 (3.0) n=6 (b) 3.6±1.7 (7.2) n=42 |
| Calibration phantom | Rigid | Point | 1.0±0.6 (3.8) n=7560 | (c) 1.4±0.7 (4.8) n=6048 |
Using the conventional rigid point-based registration technique, FRE was 2.2±1.3 mm. However, when an isotropic scaling factor was introduced in order to obtain a similarity transform, the FRE dropped to 1.1±0.8 mm. The nylon screw head, securing the silicone organ model to the base, was not used in the registration, served as a target in 11 of the registrations. The resulting TRE from the point-based registration was 1.7±0.5 mm for rigid and 1.8±0.5 mm when scaling was allowed.
The closest corresponding metric to FRE for ICP-based surface registrations is the mean residual error, since both serve as cost functions to be minimized in the registration process. The mean surface residual error is the mean distance between every point on one surface and its corresponding closest point on the other surface. For the six registrations performed with the organ phantom, the mean residual was 0.75±0.07 mm using rigid transformations and 0.65±0.04 mm when incorporating the similarity isotropic scaling factor into the ICP algorithm. For the surface-based registrations, there were two sets of targets. One target was the same nylon screw head that was used as a target in the point registrations. The other set of targets were the Teflon spheres, since they were not used at all during the ICP registration. The resulting TRE’s were 2.0±0.6 mm for the screw head and 4.1±1.7 mm for the spheres using a rigid transformation; when using the similarity factor, these values were 2.4±0.5 mm and 3.6±1.7 mm.
Point-based registrations were also performed on the calibration phantom between range scanner space and physical space as defined by the OPTOTRAK optical localization system. This registration serves as the initial step for the calibration procedure that is discussed in the “Tracking” portion of the Methods and Results sections. There are nine points extracted from the calibration phantom that are used for assessing the accuracy of the registration. The nine points are separated into 5 fiducials and 4 targets. Every combination is used with each data set, resulting in 126 unique combinations for every trial. Overall there were 12 registration trials with the calibration phantom. The resulting FRE for these experiments was 1.0±0.6 mm, and the TRE was 1.4±0.7 mm.
C. Tracking experiments
A total of 8 trials were performed to test the robustness of the calibration procedure, with five trials being performed in one set and three in a second set. The data generated a total of n=36 points for the first set of trials (9 data points for each trial and 4 test trials) and n=18 points for the second set of trials (9 points, 2 test trials). Table III shows the results from the tracking experiments. Every trial was designated once as the calibration trial, and all other trials in the set were compared to the data acquired in the calibration trial. Overall, points on the phantom were tracked with an error of 1.4±0.8 mm.
Table III.
Tracking results for the calibration phantom. Each trial served once as the calibration trial, and all other trials in the set were transformed using this trial’s calibration transformation matrix and compared against the physical data obtained from that trial.
| Calibration trial | Samples | Tracking error, mm |
|---|---|---|
| 1 | 36 | 1.3±0.5 (2.4) |
| 2 | 36 | 1.0±0.5 (2.3) |
| 3 | 36 | 1.6±1.0 (4.3) |
| 4 | 36 | 1.1±0.6 (2.5) |
| 5 | 36 | 2.1±1.0 (3.7) |
| 6 | 18 | 1.7±0.6 (2.6) |
| 7 | 18 | 1.5±0.6 (2.3) |
| 8 | 18 | 1.4±0.6 (2.2) |
| Overall | 234 | 1.4±0.8 (4.3) |
D. Deformation experiments
For the deformation experiments, approximately 120,000 points were acquired from each segmented CT surface, and 40,000 points of the liver surface were acquired with the range scanner. The number of range scanner points represents the sample size for calculations of the surface residual error. CT tomographic volume contours were acquired for the entire surface, while range scanner data only originated from surface points available to the scanner’s line of sight. For the phantom, the range scanner covers approximately 52% of the entire surface area of the phantom.
Table IV shows the target registration error of the mock subsurface tumors. The position of the tumors in relation to the liver phantom is shown in Fig. 8. For each deformation, the first column represents the distances between corresponding tumor centroids after the initial alignment used before ICP. This distance represents shift due to deformation. The second column shows the distance between corresponding tumor centroids after performing a registration with ICP between the deformed CT image contours and the nondeformed contours. The third column represents the distance between tumor centroids after registering the deformed range scan surface with the nondeformed CT surface using the ICP method. Overall, the target error decreased significantly after the rigid registration, especially for tumors very near the site of deformation, such as tumor 1 in the first deformation trial and tumor 4 in the second trial. Figure 9 shows a nondeformed and a deformed contour set from a segmented CT image, before and after registration. There are a few cases (Tumors 4, 5, and 6) where the target error increased, and this was due to nondeformed areas being misaligned by the rigid transformation in order to minimize the closest point metric, as can be seen in Fig. 9, indicated by the white arrows.
Table IV.
Target registration results from deformation experiments. Six subsurface mock tumors were used as targets.
| Tumor | Deformation # 1
|
Deformation # 2
|
||||
|---|---|---|---|---|---|---|
| Initial deformation | Registration CT | Registration range scan | Initial deformation | Surface registration CT | Surface registration range scan | |
| 1 | 46.83 mm | 6.98 mm | 3.81 mm | 12.89 mm | 2.39 mm | 2.93 mm |
| 2 | 33.65 mm | 4.92 mm | 3.69 mm | 8.71 mm | 0.74 mm | 0.88 mm |
| 3 | 11.48 mm | 7.42 mm | 6.43 mm | 5.30 mm | 0.71 mm | 0.60 mm |
| 4 | 5.96 mm | 5.82 mm | 6.20 mm | 18.12 mm | 4.09 mm | 3.97 mm |
| 5 | 3.67 mm | 3.08 mm | 6.64 mm | 5.09 mm | 3.65 mm | 3.95 mm |
| 6 | 4.67 mm | 6.26 mm | 7.74 mm | 10.01 mm | 3.39 mm | 4.61 mm |
Fig. 8.
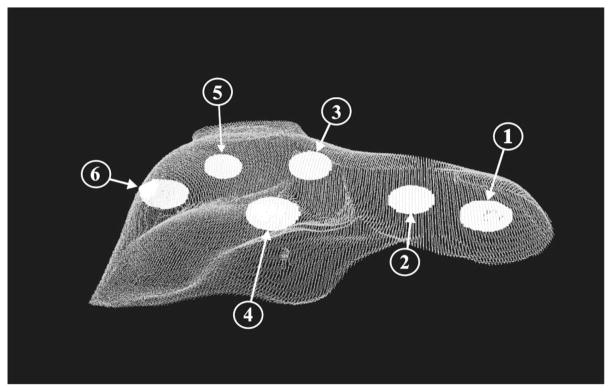
Segmented CT surfaces of the liver phantom and subsurface tumors. The tumors are labeled in accordance with Table IV.
Fig. 9.

(Top) Nondeformed CT contour (white) and deformed CT contour (gray) of a phantom surface aligned by a point-based registration, before ICP. Notice the significant deformation on the right side of the image. (Bottom) The two CT contours after implementing the ICP registration method. Now the right surface now matches much better, at the expense of a false rotation that misaligns the left side of the surface.
In Table V, it can be seen that before registration, the mean closest point distance between the deformed and non-deformed state is large, up to 50% of the maximum deformation. The ICP algorithm, whether using range scan data or CT data, decreases this residual error by 65–78%. The two registrations can be compared by using each of the resulting transformations to bring the range scan point set representing deformed data into nondeformed space. The mean distance between corresponding points after the transformations was 1.83±0.65 mm for the first deformation trial and 1.80±0.71 mm for the second.
Table V.
Registration results from deformation studies.
| Trial 1: mean±s.d. (max) | Trial 2: mean±s.d. (max) | |
|---|---|---|
| Residual before registration | 15.67±14.30 mm (42.08) | 4.49±4.09 mm (23.23) |
| Residual after scanner registration | 3.41±2.35 mm (16.40) | 1.58±1.22 mm (16.82) |
| Residual after CT registration | 3.63±2.34 mm (14.37) | 1.63±1.32 mm (15.87) |
| Mean corresponding point distance (scan and CT) | 1.83±0.65 mm (4.11) | 1.80±0.71 mm (3.71) |
E. Clinical data
The first range scanner data of a human liver surface used in a surface registration was acquired from a 68 year old female patient, who was undergoing standard surgical resection for a large primary liver tumor in her right lobe, occupying most of Couinaud segments VI and VII, as well as a portion of Secs. V and VIII. The scanner acquired a total 28,672 points of the exposed organ surface during a 15 second scan. This point set represents approximately 25% of the surface area of the entire liver. The resulting mean residual error from the surface registration was 1.72±1.43 mm, with the closest point distances ranging from 0.03 mm to 11.62 mm. An overlay of the range scanner data onto CT tomographic volume data is shown using two-dimensional slices in Fig. 10, and a three-dimensional visualization in Fig. 11.
Fig. 10.
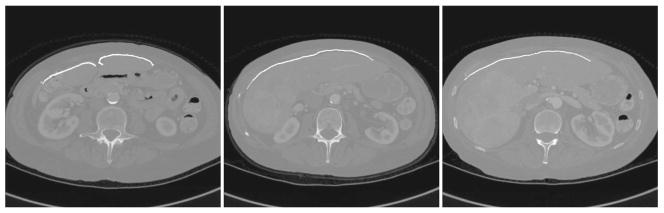
Range scan data registered to and overlaid on the preoperative tomographic sets. From left to right, the slices become more superior. The large primary tumor can be seen in the right image.
Fig. 11.
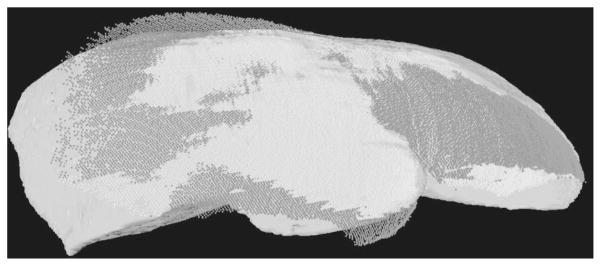
CT to range scanner registration of clinical trial data. The dark points indicate that the range scanner points are outside the CT surface and the white points indicate that these surface points are inside the surface.
IV. DISCUSSION
A. Surface curvature
The accuracy of an optical triangulation-based laser range scanner depends on the correct interpretation of the reflected light patterns received by the CCD array. Any deviations that arise from the ideal case lead to error and uncertainty of the depth measurement. A fundamental limit on accuracy is present due to the use of a coherent light source and the subsequent introduction of speckle noise. As the laser reflects off any optically rough surface, the coherence is lost and photons constructively and destructively interfere with each other.42 However, this limit is usually on the order of 10 μm, and does not play a significant factor in range scan error.
The most significant component of error is deterministic and it depends on the position and orientation of the surface within the scanner’s field of view. The ideal scenario for accurate data acquisition with a range scanner is for the surface to be planar and facing normal to the range scanner. Feng et al.43 characterized three parameters that defined this error. The first parameter was the depth of the surface in the scanner’s field of view. As the depth increases and more attenuation is present, localization becomes more difficult. The second parameter is the angle in the scanning plane between the incident laser beam and the surface normal, known as the incident angle. Many range scanning systems, including the one used in this study, sweep a defocused laser line across the field of view. As a result, the laser will never be completely normal to the surface for the duration of the scan. Since this is a property of the laser scanning system, almost all range scanners have been calibrated to account for the change in incident angle. The third error parameter is the projection angle, defined as the out-of-plane angle between the surface normal and the scanning plane. Any changes or discontinuities in surface shape changes the projection angle, and results in distortions of the received light pattern.
Feng constructed a carefully designed experiment in which a plane attached to a sphere was repeatedly scanned. The projection angle and scan depth was held constant for each scan, and then adjusted by changing the incline of the plane-ball apparatus or the depth of the scanner. Based on these scans, a large amount of the error resulting from the surface depth and the projection was quantified and modeled. Once the model was created, an iterative scheme was developed to correct for the error arising from these parameters.44 Curless et al.45 developed a method to account for these errors, along with errors arising from discontinuities in shape (i.e., corners) and of the index of reflectance. Rather than developing a model to account for all of these errors, the group changed the method of depth calculation based on the range scan calculation. Most range scanners calculate the depth from centroid calculation for each frame received by the CCD and then discard these frames. By saving every frame and analyzing the centroid patterns over time, some of the deterministic error was corrected.
The changes of surface depth and projection angle play a central role in the registration error of our studies. Given the fact that the spheres have a high rate of curvature with respect to the field of view of the laser range scanner, there will be significant errors in calculating the depth that cause the sphere to appear larger than its actual radius. As a result, the position of the fiducial spheres in the range scans appears to be farther away with respect to the centroid of the fiducial configuration, as seen in Fig. 12. Thus, an isotropic scaling factor was employed to account for the “bloom” effect. However, while the scaling factor improved the fiducial registration error, it had very little effect on the target error.
Fig. 12.

Observed “bloom” in the fiducial configuration. Notice how all the scanner fiducials are further away from the centroid than the CT fiducials.
The surface registration methods were able to align the surfaces with a high degree of accuracy, and they were able to align the central target to a comparable accuracy with the point-based methods. However, the target registration errors were much higher for the Teflon spheres. These points were on the periphery of the scene and farther away from the centroid of the organ. Thus, any slight changes in the rotation created a lever arm effect with respect to these targets. The implementation of a scaling factor within the ICP algorithm also did not play a very significant role in target accuracy.
Similarity transformations, which incorporate an isotropic scaling factor into a point-based registration, seem desirable since they will not require a lengthy calibration procedure. However, the scaling factor loses much of its effectiveness when two surfaces with different shape are part of the same registration. Our fiducial spheres have a high degree of curvature over a small area and thus the error due to projection angle will be much greater than compared to the more planar surface of the liver phantom or the calibration phantom. Since the scaling factor is optimized for the error associated with the spheres, it will not aid the overall registration accuracy for the organ surface. As a result, a calibration procedure, not unlike those seen in Refs. 45 or 43 will be needed to better account for the systematic error.
To obtain a better assessment of the accuracy limits regarding registration between the range scanner and other modalities, results from the calibration phantom should be examined. From Table II, the FRE and TRE results from the rigid registration of the calibration phantom are comparable to those obtained with a similarity transform of the organ phantom. The two factors for the decrease in registration error with respect to the phantom are the implementation of planar fiducials and targets as well as the smaller region of the scanner’s field of view that the calibration phantom occupies. In both cases, these changes reduce the amount of error caused by the projection angle.
Despite these considerations when analyzing the data from the range scanner, its potential to acquire useful three-dimensional information for image-guided surgery is overwhelming. In contrast to surface acquisition methods with a freehand probe, the laser range scanner provides rapid acquisition, dense sampling, and does not require contact. The freehand probe, localized by the OPTOTRAK system, acquires new point data at a rate of 40 Hz. Table VI shows the comparison for a surface registration of a phantom where the number of range scan and freehand probe points are roughly equal. The freehand probe takes 6 minutes to the 21-second acquisition time of the range scanner, and the error residual is twice as large for the freehand probe. In Table VII, the acquisition time is held constant. Only 800 points can be collected by the freehand probe in the same duration as one range scan. 800 random points from the range scan data are selected to keep the number of points equal. While the range scanner sampling is so robust that no change is noticed in the registration residual error, there is a significant change in the freehand probe results. The surgeon cannot move the probe fast enough with the needed accuracy to sample the surface as well as the range scanner. While all the registrations in these tables appeared to result in similar transformations, these studies do not include all the variables and sources of error that will be encountered during a real surgical procedure. The variations to the system could cause the ICP algorithm to reach a local minimum and result in an improper registration. It appears that the range scanner’s dense sampling and rapid acquisition seem better suited to correct for these problems.
Table VI.
A comparison of surface acquisition using the freehand probe and the range scanner. The range scanner takes significantly less time to acquire the data and results in smaller error residuals.
| Data type | Points | Acquisition time | Initial guess FRE | Registration time | Mean distance, mm (max) |
|---|---|---|---|---|---|
| Freehand probe | 12870 | 360 sec | 7.15 mm | 36 sec | 0.97±0.95 (10.95) |
| Range scanner | 13054 | 21 sec | 5.02 mm | 37 sec | 0.48±0.42 (4.55) |
Table VII.
A comparison of surface acquisition using the freehand probe and the range scanner. The number of scanner points was randomly down-sampled to match the number of points acquired by a freehand probe in 20 seconds. The resulting residual actually improves.
| Data type | Points | Acquisition time | Initial guess FRE | Registration time | Mean distance, mm (max) |
|---|---|---|---|---|---|
| Freehand probe | 797 | 20 sec | 7.15 mm | 15 sec | 1.23±1.22 (8.21) |
| Range scanner | 804 | 21 sec | 5.02 mm | 13 sec | 0.47±0.40 (3.06) |
B. ICP and deformation
Overall, the ICP method significantly diminished target registration error due to deformation by distributing this error across the entire surface through its minimization process of the closest point metric. However, it also added error in some areas where there was very little or no deformation. In Fig. 9, the bottom image shows that most of the deformation on the right side has been corrected. However, on the left side of the surface, there is some new misalignment from the rotation and translation of the rigid registration. It would be at these areas where deformation would be exhibited in the finite element model. Overall, the accuracy obtained in these phantom studies is comparable to what will be needed in tumor resection of image-guided liver surgery. In order to obtain this level of accuracy in a clinical setting, there is a strong likelihood that the metric used in the ICP algorithm will need to be altered, so that false, nonexistent deformations that can arise from a rigid registration will not be present. Possible solutions include weighting each closest point calculation according to an addition metric.
One of the goals for using range scanner data is to capture and correct for deformation during surgery. To be effective, the range scanner must accurately acquire shape information that can be used effectively in deformation compensation strategies. The ICP algorithm, between deformed and nondeformed surface data, results in similar transformations whether using tomographic volume data or range scan data. The transformations place the point sets very close, with a mean distance between the corresponding points of less than 2.0 mm.
C. Intraoperative acquisition/surface registration metric
From the above studies, it has been shown that the position and orientation of the target surface with in the scanner’s field of view plays an important role in the accuracy. In fact, there has been a definite region that has been considered ideal for accurate scanning. This area is located in the central portion of the scanner’s field of view, 300–500 mm away. In order to determine the highest limits of accuracy, most of the studies were performed in this area. It will also be the location where the calibration phantom and the surgical scene will be located. Using the calibration phantom and its precise machining, further studies are being performed to employ a calibration procedure similar to the one developed by Xi.44
V. CONCLUSION
The range scanner is an effective tool for acquiring rapid three-dimensional location data. It can be used effectively to register with CT image volumes, using both-point based and surface-based methods. It can also be tracked with an optical localization system. Studies with the calibration phantom show that registration and tracking errors are consistently less than 2 mm. However, there are some concerns regarding a large component of error that is dependent on the position and orientation of the target surface within the scanner’s field of view. Calibration and correction algorithms are currently being examined, but for most of the surgery studies that will be performed, the target surface will lie relatively planar within the ideal region of the scanner’s field of view. The range scan data is best suited for surface based registration techniques since it captures entire surfaces with great detail.
Acknowledgments
This work was supported in part by the NIH R21 Grant No. CA 91352-01. The authors would like to acknowledge Tina Herron, Nita Collins, and the rest of the CT staff in Vanderbilt University’s Department of Radiology for their aid in acquiring tomographic images of the phantom and the patient. In addition, the authors would like to thank Stephanie Cook and Karin Mayes of the Vanderbilt University Hepatic Surgery Nursing Team for their aid and patience with regards to acquiring intraoperative data. Assistance in constructing the phantoms was provided by John Fellenstein and Robert Patchin from the Department of Physics, and Phil Davis from the School of Engineering. Some segmentation and calculation were performed using Analyze AVW Version 3.1—Biomedical Resource, provided in collaboration with the Mayo Foundation, Rochester, MN. Finally, the authors would like to acknowledge 3-D Digital Corporation for their technical support and training regarding their laser range scanner.
Contributor Information
David M. Cash, Department of Biomedical Engineering, Vanderbilt University, Box 351631, Station B, Nashville, Tennessee 37235.
Tuhin K. Sinha, Department of Biomedical Engineering, Vanderbilt University, Box 351631, Station B, Nashville, Tennessee 37235
William C. Chapman, Department of Surgery and Cell Biology, Section of Transplantation, Washington University School of Medicine, 6107 Queeny Tower, St. Louis, Missouri 63110
Hiromi Terawaki, Department of Biomedical Engineering, Duke University, Durham, North Carolina 27708.
Benoit M. Dawant, Department of Electrical Engineering and Computer Sciences, Vanderbilt University, Box 1662, Station B, Nashville, Tennessee 37235
Robert L. Galloway, Department of Biomedical Engineering, Vanderbilt University, Box 351631, Station B, Nashville, Tennessee 37235
Michael I. Miga, Department of Biomedical Engineering, Vanderbilt University, Box 351631, Station B, Nashville, Tennessee 37235
References
- 1.Engle DJ, Lunsford LD. Brain tumor resection guided by intra-operative computed tomography. J Neuro-Oncol. 1987;4:361–370. doi: 10.1007/BF00195607. [DOI] [PubMed] [Google Scholar]
- 2.Nimsky C, Ganslandt O, Kober H, Buchfelder M, Fahlbusch R. Intraoperative magnetic resonance imaging combined with neuronavigation: a new concept. Neurosurgery. 2001;48:1082–1089. doi: 10.1097/00006123-200105000-00023. [DOI] [PubMed] [Google Scholar]
- 3.Black PM, Moriarty T, Alexander E, III, Stieg P, Woodard EJ, Gleason PL, Martin CH, Kikinis R, Schwartz RB, Jolesz FA. Development and implementation of intraoperative magnetic resonance imaging and its neurosurgical applications. Neurosurgery. 1997;41:831–842. doi: 10.1097/00006123-199710000-00013. [DOI] [PubMed] [Google Scholar]
- 4.Kaibara T, Myles ST, Lee MA, Sutherland GR. Optimizing epilepsy surgery with intraoperative MR imaging. Epilepsia. 2002;43:425–429. doi: 10.1046/j.1528-1157.2002.32401.x. [DOI] [PubMed] [Google Scholar]
- 5.Yrjana SK, Katisko JP, Ojala RO, Tervonen O, Schiffbauer H, Koivukangas J. Versatile Intraoperative MRI in neurosurgery and radiology. Acta Neurochir. 2002;144:271–278. doi: 10.1007/s007010200035. [DOI] [PubMed] [Google Scholar]
- 6.Ferrant M, Nabavi A, Macq B, Jolesz FA, Kikinis R, Warfield SK. Registration of 3-D intraoperative MR images of the brain using a finite-element biomechanical model. IEEE Trans Med Imaging. 2001;20:1384–1397. doi: 10.1109/42.974933. [DOI] [PubMed] [Google Scholar]
- 7.Wirtz CR, Tronnier VM, Bonsanto MM, Knauth M, Staubert A, Albert FK, Kunze S. Image-guided neurosurgery with intraoperative MRI: Update of frameless stereotaxy and radicality control. Stereotact Funct Neurosurg. 1997;68:39–43. doi: 10.1159/000099900. [DOI] [PubMed] [Google Scholar]
- 8.Bernstein M, Al Anazi AR, Kucharczyk W, Manninen P, Bronskill M, Henkelman M. Brain tumor surgery with the Toronto open magnetic resonance imaging system: Preliminary results for 36 patients and analysis of advantages, disadvantages, and future prospects. Neurosurgery. 2000;46:900–907. doi: 10.1097/00006123-200004000-00023. [DOI] [PubMed] [Google Scholar]
- 9.Wirtz CR, Bonsanto MM, Knauth M, Tronnier VM, Albert FK, Staubert A, Kunze S. Intraoperative magnetic resonance imaging to update interactive navigation in neurosurgery: method and preliminary experience. Comput Aided Surg. 1997;2:172–179. [PubMed] [Google Scholar]
- 10.Knauth M, Aras N, Wirtz CR, Dorfler A, Engelhorn T, Sartor K. Surgically induced intracranial contrast enhancement: potential source of diagnostic error in intraoperative MR imaging. Am J Neuroradiol. 1999;20:1547–1553. [PMC free article] [PubMed] [Google Scholar]
- 11.Bucholz RD, Yeh DD, Trobaugh J, McDurmont LL, Sturm CD, Baumann C, Henderson JM, Levy A, Kessman P. The correction of stereotactic inaccuracy caused by brain shift using an intraoperative ultrasound device. Cvrmed-Mrcas’97. 1997;1205:459–466. [Google Scholar]
- 12.Comeau RM, Sadikot AF, Fenster A, Peters TM. Intraoperative ultrasound for guidance and tissue shift correction in image-guided neurosurgery. Med Phys. 2000;27:787–800. doi: 10.1118/1.598942. [DOI] [PubMed] [Google Scholar]
- 13.Gobbi DG, Comeau RM, Peters TM. Ultrasound probe tracking for real-time ultrasound/MRI overlay and visualization of brain shift. Medical Image Computing and Computer-Assisted Intervention, Miccai’99, Proceedings; 1999. pp. 920–927. [Google Scholar]
- 14.Gronningsaeter A, Kleven A, Ommedal S, Aarseth TE, Lie T, Lindseth F, Lango T, Unsgard G. SonoWand, an ultrasound-based neuronavigation system. Neurosurgery. 2000;47:1373–1379. [PubMed] [Google Scholar]
- 15.Biot MA. General theory of three-dimensional consolidation. J Appl Phys. 1941;12:155–164. [Google Scholar]
- 16.Paulsen KD, Miga MI, Kennedy FE, Hoopes PJ, Hartov A, Roberts DW. A computational model for tracking subsurface tissue deformation during stereotactic neurosurgery. IEEE Trans Biomed Eng. 1999;46:213–225. doi: 10.1109/10.740884. [DOI] [PubMed] [Google Scholar]
- 17.Miga MI, Roberts DW, Kennedy FE, Platenik LA, Hartov A, Lunn KE, Paulsen KD. Modeling of retraction and resection for intraoperative updating of images. Neurosurgery. 2001;49:75–84. doi: 10.1097/00006123-200107000-00012. [DOI] [PubMed] [Google Scholar]
- 18.Edwards PJ, Hill DLG, Little JA, Hawkes DJ. Deformation for image guided interventions using a three component tissue model. Med Image Anal. 1998;2:355–367. doi: 10.1016/s1361-8415(98)80016-9. [DOI] [PubMed] [Google Scholar]
- 19.Hagemann A, Rohr K, Stiehl HS, Spetzger U, Gilsbach JM. Biomechanical modeling of the human head for physically based, non-rigid image registration. IEEE Trans Med Imaging. 1999;18:875–884. doi: 10.1109/42.811267. [DOI] [PubMed] [Google Scholar]
- 20.Miller K, Chinzei K. Constitutive modelling of brain tissue: experiment and theory. J Biomech. 1997;30:1115–1121. doi: 10.1016/s0021-9290(97)00092-4. [DOI] [PubMed] [Google Scholar]
- 21.Marescaux J, Clement JM, Tassetti V, Koehl C, Cotin S, Russier Y, Mutter D, Delingette H, Ayache N. Virtual reality applied to hepatic surgery simulation: the next revolution. Ann Surg. 1998;228:627–634. doi: 10.1097/00000658-199811000-00001. [DOI] [PMC free article] [PubMed] [Google Scholar]
- 22.Bro-Nielsen M. Fast finite elements for surgery simulation. Stud Health Technol Inform. 1997;39:395–400. [PubMed] [Google Scholar]
- 23.Delingette H. Towards realistic soft tissue modeling in medical simulation. Proc IEEE. 1998;86:512–523. [Google Scholar]
- 24.Chabanas M, Payan Y. A 3D finite element model of the face for simulation in plastic and maxillo-facial surgery. Medical Image Computing and Computer-Assisted Intervention, Miccai 2000; 2000. pp. 1068–1075. [Google Scholar]
- 25.Szekely G, Brechbuhler C, Hutter R, Rhomberg A, Ironmonger N, Schmid P. Modelling of soft tissue deformation for laparoscopic surgery simulation. Med Image Anal. 2000;4:57–66. doi: 10.1016/s1361-8415(00)00002-5. [DOI] [PubMed] [Google Scholar]
- 26.Audette MA, Siddiqi K, Peters TM. Level-set surface segmentation and fast cortical range image tracking for computing intrasurgical deformations. :788–797. in Ref. 13. [Google Scholar]
- 27.Raabe A, Krishnan R, Wolff R, Hermann E, Zimmermann M, Seifert V. Laser surface scanning for patient registration in intracranial image-guided surgery. Neurosurgery. 2002;50:797–801. doi: 10.1097/00006123-200204000-00021. [DOI] [PubMed] [Google Scholar]
- 28.Furushiro N, Saito T, Masutani Y, Sakuma I. Specification method of surface measurement for surgical navigation: Ridgeline based organ registration. Medical Image Computing and Computer-Assisted Intervention, Miccai’02; 2002. pp. 109–115. [Google Scholar]
- 29.Sinha TK, Cash DM, Weil RJ, Galloway RL, Miga MI. Cortical surface registration using texture mapped point clouds and mutual information. 2489:533–540. in Ref. 28. [Google Scholar]
- 30.3D Digital Corporation. RealScan USB Brochure. 2001. [Google Scholar]
- 31.Ahn SJ, Rauh W, Warnecke HJ. Least-squares orthogonal distances fitting of circle, sphere, ellipse, hyperbola, and parabola. Pattern Recogn. 2001;34:2283–2303. [Google Scholar]
- 32.Northern Digital Inc. OPTOTRAK—Technical Specifications. 2002 http://www.ndigital.com/optotrak-technical.html.
- 33.Horn BKP. Closed-form solution of absolute orientation using unit quaternions. J Opt Soc Am. 1987;4:629–642. [Google Scholar]
- 34.Schönemann PH, Carroll RM. Fitting one matrix to another under choice of a central dilation and a rigid motion. Psychometrika. 1970;35:245–255. [Google Scholar]
- 35.Besl PJ, Mckay ND. A method for registration of 3-D shapes. IEEE Trans Pattern Anal Mach Intell. 1992;14:239–256. [Google Scholar]
- 36.Zhang ZY. Iterative point matching for registration of free-form curves and surfaces. Int J Comput Vis. 1994;13:119–152. [Google Scholar]
- 37.Friedman JH, Bentley JL, Finkel RA. An algorithm for finding best matches in logarithmic expected time. ACM Trans Math Softw. 1977;3:209–226. [Google Scholar]
- 38.Nabavi A, Black PM, Gering DT, Westin CF, Mehta V, Pergolizzi RS, Ferrant M, Warfield SK, Hata N, Schwartz RB, Wells WM, Kikinis R, Jolesz FA. Serial intraoperative magnetic resonance imaging of brain shift. Neurosurgery. 2001;48:787–797. doi: 10.1097/00006123-200104000-00019. [DOI] [PubMed] [Google Scholar]
- 39.Nimsky C, Ganslandt O, Cerny S, Hastreiter P, Greiner G, Fahlbusch R. Quantification of, visualization of, and compensation for brain shift using intraoperative magnetic resonance imaging. Neurosurgery. 2000;47:1070–1079. doi: 10.1097/00006123-200011000-00008. [DOI] [PubMed] [Google Scholar]
- 40.Couinaud C. Le Foie: Etudes Anatomiques et Chirurgicales. Masson, Paris: 1957. [Google Scholar]
- 41.Maurer CR, Jr, Fitzpatrick JM, Wang MY, Galloway RL, Jr, Maciunas RJ, Allen GS. Registration of head volume images using implantable fiducial markers. IEEE Trans Med Imaging. 1997;16:447–462. doi: 10.1109/42.611354. [DOI] [PubMed] [Google Scholar]
- 42.Dorsch RG, Hausler G, Herrmann JM. Laser triangulation—fundamental uncertainty in distance measurement. Appl Opt. 1994;33:1306–1314. doi: 10.1364/AO.33.001306. [DOI] [PubMed] [Google Scholar]
- 43.Feng HY, Liu YX, Xi FF. Analysis of digitizing errors of a laser scanning system. Precision Engineering - J Inter Soc Precision Eng Nanotechnology. 2001;25:185–191. [Google Scholar]
- 44.Xi F, Liu Y, Feng HY. Error compensation for three-dimensional line laser scanning data. Int J Adv Manufacturing Technol. 2001;18:211–216. [Google Scholar]
- 45.Curless B, Levoy M. Better optical triangulation through spacetime analysis. IEEE 5th International Conference on Computer Vision; Boston, MA. 1995; pp. 987–994. [Google Scholar]