

Abstract
Cyclooxygenase (COX) (PTGS) is the rate-limiting enzyme in the biosynthesis of prostaglandins. Two COX isoforms have been identified, COX-1 and COX-2, which show distinct cell-specific expression and regulation. Ovarian cancer is the most lethal gynecological malignancy and the disease is poorly understood due to the lack of suitable animal models. The laying hen spontaneously develops epithelial ovarian cancer with few or no symptoms until the cancer has progresses to a late stage, similar to the human disease. The purpose of this study was to examine the relative expression and distribution of COX-1 and COX-2 in the ovaries of normal hens and in hens with ovarian cancer. The results demonstrate that COX-1 was localized to the granulosa cell layer and cortical interstitium, ovarian surface epithelium (OSE) and postovulatory follicle (POF) of the normal ovary. In ovarian cancer, COX-1 mRNA was significantly increased and COX-1 protein was broadly distributed throughout the tumor stroma. COX-2 protein was localized to the granulosa cell layer in the follicle and the ovarian stroma. COX-2 mRNA expression did not change as a function of age or in ovarian cancer. There was significantly higher expression of COX-1 mRNA in the first POF (POF-1) compared to POF-2 and POF-3. COX-2 mRNA expression was not significantly different among POFs. There was no difference in COX-1 or COX-2 mRNA in the OSE isolated from individual follicles in the follicular hierarchy. The results confirm previous findings of the high expression of COX-1 in ovarian tumors further supporting the laying hen as a model for ovarian cancer, and demonstrate for the first time the high expression of COX-1 in POF-1 which is the source of prostaglandins needed for oviposition.
Keywords: Ovarian cancer, Laying hen, Cyclooxygenase, Ovary, Oviposition
Introduction
Ovarian cancer is the most lethal gynecological malignancy and the fifth leading cause of cancer death among women [1]. Ovarian cancer is usually detected only at a late stage with poor prognosis when significant peritoneal metastases and accompanying ascites have already developed. Research into ovarian cancer has been hampered by the lack of a suitable animal model for spontaneous ovarian cancer. In vivo animal models of ovarian cancer provide the opportunity to study each step of carcinogenesis from initiation through progression to late-stage metastatic disease. With the exception of the laying hen, no other accessible animal model spontaneously develops epithelial ovarian cancer similar in presentation and progression to the human disease [2–4].
The OSE, a single layer of flat to cuboidal columnar epithelium consists of specialized mesothelial (celomic) cells that covers the entire ovarian surface [5]. The OSE is a unique epithelium that actively participates in the ovulatory process. Ninety percent of human ovarian carcinomas arise from the OSE [5]. The aging hen also develops OSE cancer spontaneously. The disease in hens appears to closely resemble the human disease, which in humans is correlated with ovulation frequency [6]. Whereas there are important rodent models for epithelial ovarian cancer, none of these ovarian carcinomas are linked to ovulation [7–13]. One of the most prevalent theories about the etiology of ovarian cancer is the “incessant ovulation hypothesis” first proposed by Fathalla [14]. He hypothesized that continuous ovulation, with successive rounds of surface rupture and OSE cell mitosis to repair the wound, renders the cells susceptible to malignant transformation. The observation that intensive egg-laying domestic hens frequently develop ovarian peritoneal carcinoma supports this hypothesis. Hens spontaneously develop significant numbers of ovarian adenocarcinomas similar in histological appearance and behavior to the common human ovarian epithelial carcinomas [6].
Cyclooxygenase (COX) (PTGS) is the rate-limiting enzyme in the biosynthesis of prostaglandins. COX catalyzes the conversion of arachidonic acid into prostaglandin H2, the precursor for all prostaglandins, prostacyclins and thromboxanes. Two COX isoforms have been identified, COX-1 and COX-2, which are encoded by different genes, PTGS1 and PTGS2 [15]. COX-1 and COX-2 have similar structural and kinetic properties but show distinct cell-specific expression and regulation. COX-1 is expressed constitutively in most cells, whereas the inducible COX-2 form is usually only expressed in response to various inflammatory stimuli [16]. COX-2 overexpression is observed in neurodegenerative diseases, acute and chronic inflammation, and a wide variety of epithelial cancers [17]. COX-2 expression contributes to tumor cell proliferation and survival in the majority of carcinomas [18, 19]. In contrast to most malignancies, however, COX-2 expression is down-regulated in ovarian cancer [20]. Instead, COX-1 expression has been shown to be elevated in ovarian cancer [8, 21–26]. Whereas considerable research has focused on the role of COX-2 in ovulation and normal ovarian function, much less is known about COX-1. The objective of this paper is to examine the distribution and relative expression of COX-1 and COX-2 in the ovary of normal hens and in hens with ovarian cancer, to gain insight into the origins and causes of ovarian cancer. The results of this study confirm and extend the prior observation that COX-1 expression is elevated in ovarian tumors of the hen [23] and further support the use of the hen model for ovarian cancer.
Results
Anatomy and pathology of the hen's ovary
A normal hen ovary consists of a hierarchy of 4–5 preovulatory follicles with F1 being the most mature and the next to ovulate. The most recent postovulatory follicle (POF-1) is shown immediately below F2and consists of granulosa cells, a theca cell layer, and OSE (Fig. 1A). An ovarian carcinoma from a tumor confined exclusively to the ovary with no metastases or significant abdominal ascites fluid present on necropsyis shown in Fig. 1B. Hematoxylin and eosin (H&E) staining of a normal, healthy ovary shows a cortical follicle containing an oocyte surrounded by prominent granulosa and interstitial cell layers (Fig. 1C). H&E staining of a poorly differentiated ovarian tumor shows endometrioid-like glands (Fig. 1D). Gomori trichrome, which stains collagen green, connective tissue/cytoplasm red, and nuclei dark red, staining of normal ovary (Fig. 1E) and ovarian carcinoma (Fig. 1F) reveals how disorganized and poorly differentiated the carcinoma is compared to the normal ovary. All sections shown in Fig. 1 are from age matched old (165 weeks) hens.
Fig. 1.
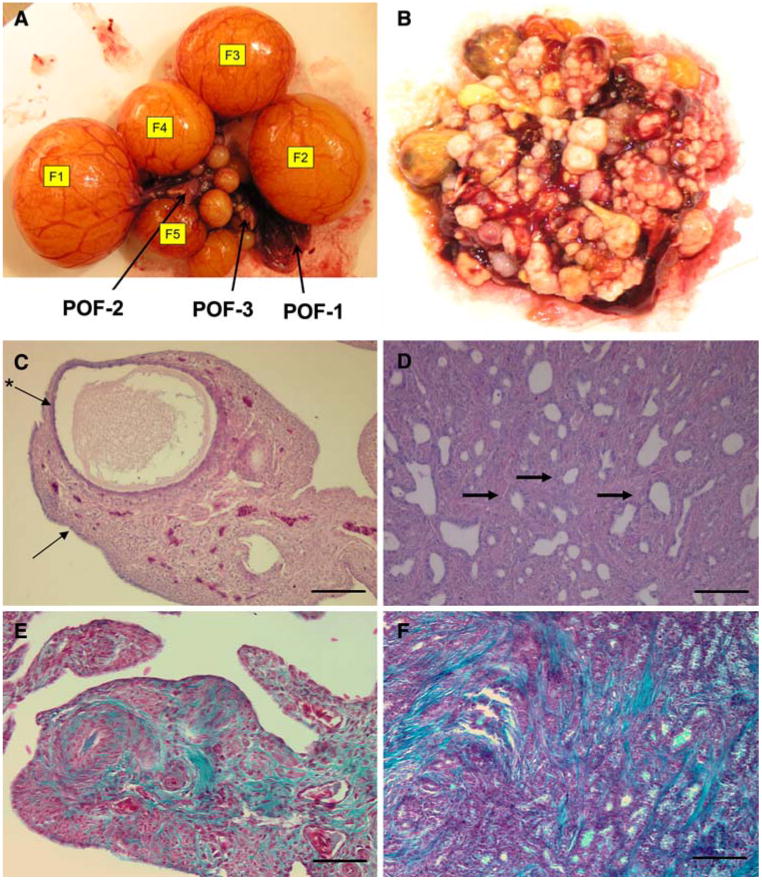
Anatomy and pathology of the hen ovary: (A) Gross anatomy of normal ovary showing follicular hierarchy (F1–F5); arrows point to postovulatory follicles (POF-1–3). (B) Ovarian tumor from hen with cancer confined to the ovary. (C) H&E stain of normal ovary, showing small developing follicle, (arrow points to OSE, *arrow points to granulosa cell layer). (D) H&E stain of ovary with cancer (arrows points to endometrioid-like gland), (E) Gomori trichrome stain of normal ovary; (F) Gomori trichrome stain of ovarian tumor. Calibration bar, 100 μm
COX-1 is upregulated in ovarian cancer and the postovulatory follicle
In the hen ovary (Fig. 2A), COX-1 is localized to the granulosa cells surrounding the oocyte. In the normal ovary, COX-1 is also present in the OSE and cortical stroma adjacent to the follicle (Fig 2A). In ovarian tumors from the hen (Fig. 2B), there is extensive COX-1 staining throughout the ovarian tumor. There is substantial COX-1 staining in POF-1 (Fig. 2C). COX-1 appears to be localized to the nuclei and peri-nuclear envelope.
Fig. 2.
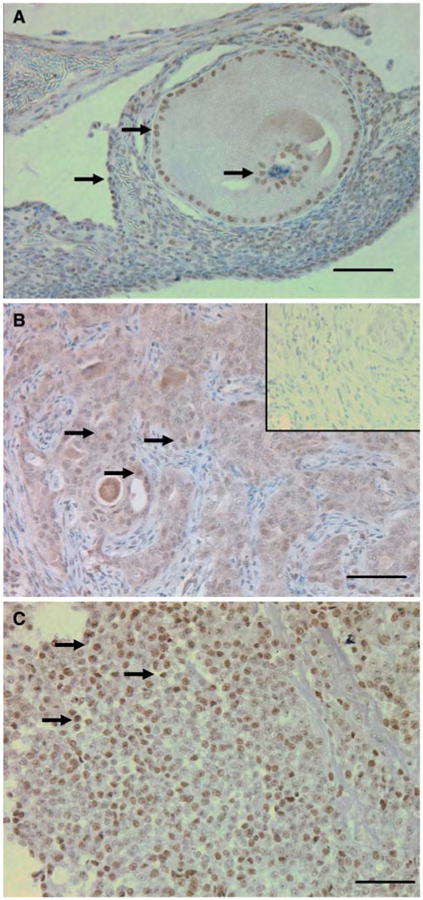
COX-1 immunohistochemistry: (A) Normal ovary (arrows point to COX-1 positive nuclei); (B) Ovarian tumor (arrows point to COX-1 positive nuclei), inset: non-immune IgG. (C) POF-1 from normal ovary, COX-1 expression is seen throughout the ovarian tumor whereas in the normal ovary COX-1 is confined to the granulosa cells and adjacent stroma. COX-1 is highly expressed in POF-1 (arrows point to COX-1 positive nuclei). Calibration bar, 50 μm
COX-2 is widely distributed in the hen ovary and postovulatory follicle, but not increased in ovarian cancer
In the normal hen ovary, COX-2isexpressed inthe granulosa cells of the follicle; it is also highly expressed in the interstitial tissue of the normal ovary (Fig. 3A). In ovarian tumors from the hen, (Fig. 3B), COX-2 expression is no longer associated with follicular structures, but distributed into discrete foci in the stroma of the ovarian tumor. COX-2 is widely distributed throughout POF-1 (Fig. 3C).
Fig. 3.
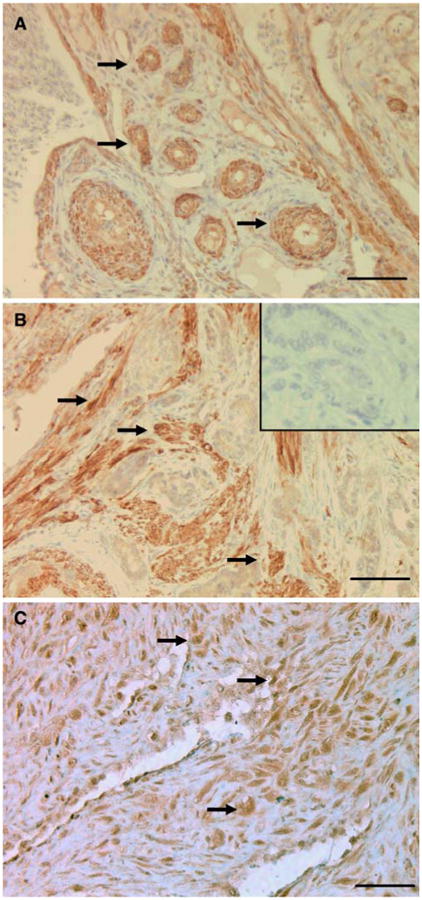
COX-2 immunohistochemistry: (A) Normal ovary; (B) Ovarian tumor, (inset: non-immune IgG); (C) POF-1 from normal ovary. COX-2 expression is not increased in the ovarian tumor and is widely distributed in POF-1. Arrows point to COX-2 positive staining. Calibration bar, 50 μm
Quantification of COX-1 and COX-2 mRNA in normal ovaries from young and old chickens, compared to ovarian cancer
There was a significant (P < 0.05) increase in COX-1 mRNA levels in ovarian cancer compared to normal ovarian tissue from young and age-matched normal hens (Fig. 4A). In contrast, there was no significant change in COX-2 mRNA in normal ovarian tissue from age-matched hens, compared to young hens or in ovarian cancer compared to age-matched normal hens (Fig. 4B).
Fig. 4.

Comparison of COX-1 (A) and COX-2 (B) mRNA in young chickens (40–50 weeks, n = 6), age-matched normal chickens (165 months, n = 12) and chickens with ovarian cancer (165 weeks, n = 19), quantified by real-time PCR. COX-1 and COX-2 mRNA by copy number, normalized to GAPDH. a versus b (P < 0.05) (±SEM)
Quantification of COX-1 and COX-2 mRNA in postovulatory follicles from normal ovaries
COX-1 mRNA levels were significantly higher (P < 0.01) in POF-1 compared to POF-2 and POF-3 from young hens (Fig. 5A). There was no difference in COX-1 expression in POF-1 top versus POF-1 bottom (Fig. 5A).
Fig. 5.

Comparison of COX-1 (A) and COX-2 (B) mRNA in POFs, quantified by real-time PCR. POF-1 was removed and dissected into top (POF-1-T) and bottom (POF-1-B) portions. RNA was extracted from POF-1-T (n = 7) and POF-1-B (n = 6), POF-2 (n = 6) and POF-3 (n = 6) and quantified. COX-1 and COX-2 mRNA by copy number, normalized to GAPDH. a versus b, P < 0.01 (±SEM)
COX-2 mRNA was quantified in POFs from normal ovarian tissue as described for COX-1 above (Fig. 5B). There was no significant change for COX-2 mRNA expression across the POFs. Also similar to COX-1, there was no difference in COX-2 mRNA levels in POF-1 top and bottom (Fig. 5B).
Quantification of COX-1 and COX-2 mRNA in OSE isolated from individual follicles and POFs from normal ovaries immediately after oviposition
COX-1 mRNA isolated from normal ovarian OSE from individual follicles (F3, F2, and F1) and from individual POFs (POF-1, POF-2, and POF-3), was quantified (Fig. 6A and B). There wasnodifferenceinCOX-1 mRNAexpressioninOSE isolated from the three most mature preovulatory follicles (F1, F2, and F3, Fig. 6A). Strikingly, COX-1 mRNA expression was significantly higher (P < 0.01) in POF-1 compared to POF-2 and POF-3 (Fig. 6B). COX-1 mRNA levels in POF-2 and POF-3 were comparable to the level observed in the OSE of the preovulatory follicles (Fig 6A).
Fig. 6.

Comparison of COX-1 mRNA in OSE isolated and analyzed from individual follicles F1 (n = 8), F2 (n = 8), F3 (n = 8) (A) and POF-1 (n = 7), POF-2 (n = 6) and POF-3 (n = 6) (B); COX-2 mRNA expression in OSE isolated from individual follicles (C) and POF-1–3 (D). Follicles and POFs were collected immediately after oviposition, RNA was extracted and quantified by real-time PCR. COX-1 and COX-2 mRNA by copy number, normalized to GAPDH. a versus b, P < 0.05; a versus c, P < 0.01 (±SEM)
COX-2 mRNA was quantified as described for COX-1. There was no significant difference in COX-2 mRNA levels in F1 OSE compared to F2 OSE or F3 OSE (Fig. 6C); however, COX-2 mRNA levels were significantly higher (P < 0.01) in POF-2, than in POF-1 or in POF-3 (Fig. 6D).
Discussion
Cyclooxygenase enzymes (PTGS 1 and 2) are essential for normal physiological processes yet their aberrant expression is a critical factor in a host of pathologies. COX enzymes are required for ovarian function and many female reproductive processes, but overexpression of COX is associated with significant pathology. Increased expression of COX-2 is associated with manyepithelial carcinomas; however, COX-1 but not COX-2 overexpression has been shown to be associated with ovarian cancer [8, 21–26]. The laying hen provides an excellent model for studying normal ovarian functions, in particular ovulation [27, 28]. The hen also provides an important model for studying ovarian epithelial carcinoma [2, 3, 23, 29–32]. In the study reported here, the data demonstrate the relative expression and distribution of COX-1 and COX-2 in the normal ovary compared to alterations in expression observed in ovarian cancer. The data show for the first time that COX-1 expression is markedly increased in the postovulatory follicle (POF) of the normal ovary confirm the previous finding that COX-1 is elevated in ovarian carcinoma [23].
Histology of the normal hen's ovary compared to ovarian cancer
The normal anatomy of the hen's ovary (Fig. 1) features the follicular hierarchy, and the postovulatory follicular hierarchy. After the most mature follicle is ovulated and the OSE ruptures, POF-1 is formed. POFs consist of granulosa cells, interstitial theca cells, and OSE cells. The POF has been shown to be a site of oxidative DNA damage [33–35]. Common epithelial ovarian cancer is related to the successive rounds of ovulation and subsequent wound healing process characterized by OSE mitosis. The integrity of the DNA of these surface cells surrounding the ovarian rupture site is compromised during ovulation, and rapid growth of cells with mutated DNA may result in the initiation of carcinogenesis [36]. The role of inflammation and oxidative damage to the pathogenesis of cancer has gained much attention [37, 38]. Our results which demonstrate the high expression of COX-1 in the first postovulatory follicle (POF-1) may contribute to the pro-carcinogenic microenvironment where the malignant transformation of the OSE originates. In the mammalian ovary the remnant of the ruptured follicle forms the corpus luteum whose endocrine functions are important for preparation of the endometrium, implantation if fertilization takes place, and maintenance of the early embryo. In the hen, the POF persists for 2 or 3 days until it degenerates and becomes assimilated into the ovarian stroma, possibly forming clefts and inclusion cysts. Similar to its mammalian counterpart, the POF is an important endocrine tissue in the hen ovary. The POF produces prostaglandins for shell egg formation and oviposition. The original observation by Rothchild and Fraps in 1944, that removal of the POF resulted in a delay of oviposition indicated that the POF may play an important endocrine role in oviposition [39]. Subsequently, it was shown that prostaglandins peak at about the time of oviposition, and that inhibition of prostaglandin production with indomethacin perturbs egg laying, demonstrating the role that prostaglandins play in oviposition (for review, see [40]). Our data show, for the first time, that COX-1 as well as COX-2 mRNA and protein are expressed in the POF, and are the likely source of prostaglandins that control oviposition.
In contrast to the normal ovary shown in Fig. 1A, an ovarian tumor is shown in Fig. 1B. The tumor was confined to the ovary with no metastases or significant abdominal ascites fluid present on necropsy. Though the carcinoma had enveloped the entire ovary, it represents an early stage cancer as it had not progressed, and spread beyond the ovary.
Localization and quantification of COX-1 and COX-2 in the hen ovary
COX-1 is constitutively expressed in the mammalian ovary and confined to interstitial thecal cells and the corpus luteum [41]. In the hen ovary, as shown in Fig. 2A, COX-1 is localized to the granulosa cell layers, and confined to the OSE and cortical stroma adjacent to the follicle. In contrast to other cancers in which COX-2 is highly expressed, in ovarian cancer, COX-1 expression is markedly increased (Fig, 2B), as has been shown previously in the hen, human and in rodent models of ovarian cancer [8, 23, 24]. COX-1 has also been shown to be increased in feline oral squamous cell carcinomas, the only non-gynecological carcinoma reported to have increased COX-1 instead of COX-2 [42]. In the mammalian ovary, the ruptured follicle differentiates into the corpus luteum. There are no corpora lutea in the chicken ovary, but the POF is an important endocrine tissue, the site of prostaglandin production. As shown in Fig. 2C, POF-1 displays strong COX-1 staining, suggesting that COX-1 is important for the production of prostaglandins in POF-1, long known to be essential for oviposition [39].
In the mammalian ovary, COX-2 is localized to the granulosa cells and induced by LH at the time of the preovulatory gonadotropin surge [43]. In the hen ovary, COX-2 is also expressed in the granulosa cells, as shown in Fig. 3A, but distinct from the reported distribution in the mammalian ovary, COX-2 is also highly expressed in the interstitial tissue of the ovary. Urick and Johnson have also reported that COX-2 is widely distributed in the hen ovary [23]. As shown in Fig. 3B, COX-2 expression in carcinoma becomes more localized to discrete foci, trapped within the glandular-like structures of the ovarian tumor.
Quantification of COX-1 and COX-2 mRNA levels in OSE and POF from normal ovaries
COX-1 and COX-2 mRNA expression in the OSE and POF was quantified by real-time PCR. It is important to note that OSE and POFs can only be collected from normal, non-cancerous ovaries due to the highly convoluted surface and afollicular presentation of ovarian cancer. POF-1 was dissected into “top” and “bottom” pieces. The POF was divided for COX analysis because it is likely that the outermost region of the POF was subjected to more oxi-dative damage, as has been reported by Murdoch and coworkers [33, 34], which presumably may influence COX expression. However, there was no difference in COX-1 or COX-2 mRNA expression observed between the top and bottom portions of POF-1. There was a significantly higher expression of COX-1 mRNA in POF-1, but this increase in expression was transient in the normal ovary because in both POF-2 and POF-3, COX-1 mRNA expression was much lower (Fig. 5A).
The immunohistochemical staining suggests that COX-1 and COX-2 protein levels are comparable; however, COX-2 has ∼ 20-30 times higher expression in terms of copy number of mRNA transcripts when normalized to GAPDH. It has been reported that COX-2 protein t½ is approximately 20 to 50 times shorter than that of COX-1 protein t½ in vitro [44]. This finding would indicate that even though COX-2 mRNA may be expressed at a higher level, the significant difference in protein stability would result in the protein levels of COX-1 and COX-2 in situ being comparable. Assessment of relative amounts of each protein by immunohistochemistry suggests their levels are comparable, thus COX-1 is likely to make a significant contribution to prostaglandin synthesis. The relative catalytic activities of COX-1 and COX-2 have been measured in vitro, and found to be very similar for conversion of arachidonic acid to PGH2. Thus, it is likely that the contribution of each enzyme to prostaglandin production in the hen ovary is comparable [45].
The results of this study have demonstrated that ovarian cancer in the hen shares many key features with human ovarian carcinoma, including elevated COX-1 expression thus further supporting the laying hen as an important model for the human disease. Our results show, for the first time that COX-1 mRNA is highly expressed in the POF of day one, indicating that COX-1 expression is important for the normal physiological functions of the ovary. These findings may provide the basis for clinical trials utilizing COX-1 specific inhibitors or dietary interventions targeting prostaglandin biosynthesis for the treatment and prevention of ovarian cancer.
Materials and methods
Materials
Bouin's fixative and neutral buffered formalin (NBF) were obtained from Sigma-Aldrich (St Louis, MO, USA); oligonucleotide primers were obtained from Sigma-Genosys, Sigma-Aldrich (St. Louis, MO, USA); Antigen Unmasking Solution, Avidin/Biotin Blocking kit, Vectastain Elite Rabbit IgG kit, were obtained from Vector Laboratories (Burlingame, CA, USA); anti-human COX-1, and anti-human COX-2 antibodies were obtained from Cayman Chemical (Ann Arbor, MI, USA); High Capacity cDNA Archive Kit, RNAlater and SYBR® Green were obtained from Applied Biosystems (Foster City, CA, USA). Reverse Transcription System, Wizard Plus Miniprep DNA purification system, and RQ1 RNase-free DNase were obtained from Promega Corporation (Madison, WI, USA); TOPO TA Cloning kit, Trizol, and Quant-iT kit were obtained from Invitrogen (Carlsbad, CA, USA). Taq DNA Polymerase was obtained from Qiagen (Valencia, CA, USA). SuperFrost Plus microscope slides, Gil's hematoxylin, Histomount, diaminobenzadine (DAB), and all other reagents were from the Fisher Scientific (Itasca, IL, USA), or were the highest grade commercially available.
Animals and tissue collection
Single-comb White Leghorn hens, 40–50 weeks, n = 20 (young) and 165 weeks, n = 65 (old), were used for the study. Hens were maintained three per cage, provided with feed and water ad libitum and exposed to a photoperiod of 17 h light:7 h dark, with lights on at 05:00 h and lights off at 22:00 h. For hens in which tissue was collected relative to the time of ovulation, oviposition was monitored at 1 h intervals between 08:00 and 12:00 h, otherwise, oviposition was monitored daily. Animal management and procedures were reviewed and approved by the Division of Animal Research of the University of Illinois at Urbana-Champaign and the Animal Care Committee, University of Illinois at Chicago. Hens were sacrificed by CO2 asphyxiation followed by cervical dislocation.
Normal and cancerous ovaries were removed from hens immediately after sacrifice and dissected. Large and small yellow follicles were removed prior to dissection. In normal ovaries, the three largest preovulatory follicles (F1, F2, and F3) and the three postovulatory follicles (POF-1, POF-2, and POF-3) were removed and the superficial epithelium (OSE) was collected from F1 to F3. OSE was collected from the largest preovulatory follicles after they were removed from the ovary by scraping with a cell scraper (Biologix Research Corp, Lenexa, KS, USA). Where indicated in the results, the POF-1 was dissected into “top” and “bottom” pieces. The top piece is the outermost region of the ruptured follicle, and the bottom piece is adjacent to, and the site of attachment to the ovarian cortex. The cancerous ovary lacks discernable or separable preovulatory and postovulatory follicles. Each normal or cancerous ovarian specimen was divided into four portions. The first portion was frozen in liquid nitrogen and later stored at −80°C; the second portion, together with POF-1-3 and superficial epithelium from F1 to F3 were put into RNA-later solution and stored at 4°C before processing; the third and fourth portions were used for histological and immunohistochemical analysis and fixed in NBF and Bouin's fixative solution.
Histology and immunohistochemistry
Ovary tissues fixed in NBF or Bouin's fixative were processed and paraffin embedded. Tissues fixed in Bouin's were used for basic histology. Tissues fixed in NBF were used for immunohistochemistry. Five micrometer sections were cut and mounted on SuperFrost Plus microscope slides. Slides were deparaffinized and rehydrated through xylene and graded ethanol solutions. Hematoxylin and eosin and Gomori Trichrome staining were performed as described [46, 47].
Immunohistochemistry was performed by using the Vectastain Elite ABC kit. Antigen retrieval was done using Antigen Unmasking Solution and pressure cooked at 20 psi for 5 min in a Decloaking Chamber electric pressure cooker (Biocare Medical, Walnut Creek, CA, USA). Slides were cooled and quenched in 0.3% H2O2 in methanol for 15 min. Slides were blocked with normal serum and incubated with primary antibody overnight at 4°C. Anti-human COX-1 (1:1000), and anti-human COX-2 (1:50) antibodies have previously been shown to be specific for the chicken by Urick and Johnson [23]. Non-immune IgG was used for negative control. After rinsing in Tris-buffered saline (TBS), sections were incubated with biotinylated secondary antibody and avidin-biotin complex. Specific binding was visualized using DAB in the presence of H2O2 and sections were counterstained with Gils hematoxylin, mounted with Histomount, examined on a Nikon ECLIPSE E400 microscope and were documented using SPOT Advanced version 4.0.1 software (Diagnostic Instruments, Inc., Sterling Heights, MI, USA).
RNA extraction and analysis
Preovulatory and small yellow follicles and POFs were removed from ovaries of normal hens prior to homogenization and RNA extraction. Total RNA was extracted from ovary, OSE, POF, and ovarian tumors using Trizol and was quantified by determination of absorbance at A260. All RNA samples used in this study had a 260:280 ratio between 1.9 and 2.05. RNA samples were then treated with RQ1 RNase-free DNase prior to reverse transcription reaction. Synthesis of cDNA was performed using the high capacity cDNA archive kit and cDNA was quantified by Quant-iT fluorescent reagent. Equal amounts from all samples were subjected to real-time PCR.
Quantitative real-time PCR (qRT-PCR)
Chicken-specific primers were designed to recognize target genes using Primer Express (ABI). The primer pairs were designed so that at least one spanned an intron. Primer sequences for COX-1 (Prostaglandin G/H synthase 1, PTGS1, XM_425326): forward: 5′ TCAGGTGGTTCTGG GACATCA 3′; reverse: 5′ TGTAGCCGTACTGGGAG TTGAA 3′; for COX-2 (Prostaglandin G/H synthase 2, PTGS2, XM_422297): forward: 5′ CTGCTCCCTCCCAT GTCAGA 3′; reverse: 5′ CACGTGAAGAATTCCGGTGTT 3′; for internal control gene GAPDH (glyceraldehyde-3-phosphate dehydrogenase, GAPDH, NM_204305): forward: 5′ GATGGGTGTCAACCATGAGAAA 3′;reverse: 5′ CAATGCCAAAGTTGTCATGGA 3′. Plasmid standards for each target of interest and internal control GAPDH were used for quantification. To clone plasmid standards, total RNA was extracted from chicken ovarian tissue, pooled, and reversed transcribed into cDNA with the Reverse Transcription System kit. Target gene fragments were amplified by Taq DNA Polymerase and cloned using TOPO TA Cloning Kit. Plasmid DNA was prepared with the Wizard Plus Miniprep DNA purification system. The identity of purified cDNA was verified by DNA sequencing. cDNA plasmid concentrations were measured by spectrophotometer and the corresponding copy numbers were calculated based on the formula that 1 μg of 1000 bp of DNA = 9.1 × 10¹¹ molecules. qRT-PCR was conducted by amplifying cDNA with SYBR® Green (Applied Biosystems) on ABI 7900HT using a 384 well plate format and analyzed with ABI Prism software. Control reactions lacking template were run for each gene. Reactions were 10 μl in total volume and 200 nM of each primer. The plasmid standards and cDNA were simultaneously assayed in duplicate reactions. The amplification conditions were as follows: 50°C 2 min, 95°C 10 min, 40 cycles for 95°C 15 S, 60°C 1 min.
Statistical analysis
Statistical analysis was performed with GraphPad InStat by using One-way ANOVA and Student's Newman Keuls post-hoc comparison.
Acknowledgments
This work was funded by Department of Defense, Ovarian Cancer Research Program, OC050091 (DBH); American Institute for Cancer Research, 06-A043 (DBH). We are grateful for the expert histological support from Patty Mavrogianis and Lindsay Yorke-Gallagher; expert technical support from Angela Dirks; and poultry management by Chet Utterback, Douglas Hilgendorf, and Pam Utterback.
Contributor Information
Dale Buchanan Hales, Email: dbhale@uic.edu, Department of Physiology and Biophysics, University of Illinois College of Medicine at Chicago, 835 S Wolcott Ave, Chicago, IL 60612-7342, USA.
Yan Zhuge, Department of Physiology and Biophysics, University of Illinois College of Medicine at Chicago, 835 S Wolcott Ave, Chicago, IL 60612-7342, USA.
Jo Ann Jaen Lagman, Department of Physiology and Biophysics, University of Illinois College of Medicine at Chicago, 835 S Wolcott Ave, Chicago, IL 60612-7342, USA.
Kristine Ansenberger, Department of Physiology and Biophysics, University of Illinois College of Medicine at Chicago, 835 S Wolcott Ave, Chicago, IL 60612-7342, USA.
Cassandra Mahon, Department of Physiology and Biophysics, University of Illinois College of Medicine at Chicago, 835 S Wolcott Ave, Chicago, IL 60612-7342, USA.
Animesh Barua, Department of Pharmacology, Rush University Medical School, 1735 W Harrison, Chicago, IL 60612, USA.
Judith L. Luborsky, Department of Pharmacology, Rush University Medical School, 1735 W Harrison, Chicago, IL 60612, USA
Janice M. Bahr, Department of Animal Sciences, University of Illinois Urbana-Champaign, 1207 W. Gregory Dr, Urbana, IL 61801, USA
References
- 1.UCSW Group. United States Cancer Statistics: 2002 Incidence and Mortality. US Department of Health and Human Services, Centers for Disease Control and Prevention and National Cancer Institute; 2005. [Google Scholar]
- 2.Fredrickson TN. Ovarian tumors of the hen. Environ Health Perspect. 1987;73:35–51. doi: 10.1289/ehp.877335. [DOI] [PMC free article] [PubMed] [Google Scholar]
- 3.Rodriguez-Burford C, Barnes MN, Berry W, Partridge EE, Grizzle WE. Immunohistochemical expression of molecular markers in an avian model: a potential model for preclinical evaluation of agents for ovarian cancer chemoprevention. Gynecol Oncol. 2001;81:373–379. doi: 10.1006/gyno.2001.6191. [DOI] [PubMed] [Google Scholar]
- 4.Giles JR, Shivaprasad HL, Johnson PA. Ovarian tumor expression of an oviductal protein in the hen: a model for human serous ovarian adenocarcinoma. Gynecol Oncol. 2004;95:530–533. doi: 10.1016/j.ygyno.2004.07.061. [DOI] [PubMed] [Google Scholar]
- 5.Auersperg N, Wong AS, Choi KC, Kang SK, Leung PC. Ovarian surface epithelium: biology, endocrinology, and pathology. Endocr Rev. 2001;22:255–288. doi: 10.1210/edrv.22.2.0422. [DOI] [PubMed] [Google Scholar]
- 6.Lingeman CH. Etiology of cancer of the human ovary: a review. J Natl Cancer Inst. 1974;53:1603–1618. [PubMed] [Google Scholar]
- 7.Mabuchi S, Altomare DA, Connolly DC, Klein-Szanto A, Litwin S, Hoelzle MK, Hensley HH, Hamilton TC, Testa JR. RAD001 (Everolimus) delays tumor onset and progression in a transgenic mouse model of ovarian cancer. Cancer Res. 2007;67:2408–2413. doi: 10.1158/0008-5472.CAN-06-4490. [DOI] [PubMed] [Google Scholar]
- 8.Daikoku T, Tranguch S, Trofimova IN, Dinulescu DM, Jacks T, Nikitin AY, Connolly DC, Dey SK. Cyclooxygenase-1 is overexpressed in multiple genetically engineered mouse models of epithelial ovarian cancer. Cancer Res. 2006;66:2527–2531. doi: 10.1158/0008-5472.CAN-05-4063. [DOI] [PubMed] [Google Scholar]
- 9.Dinulescu DM, Ince TA, Quade BJ, Shafer SA, Crowley D, Jacks T. Role of K-ras and Pten in the development of mouse models of endometriosis and endometrioid ovarian cancer. Nat Med. 2005;11:63–70. doi: 10.1038/nm1173. [DOI] [PubMed] [Google Scholar]
- 10.Bristol-Gould SK, Hutten CG, Sturgis C, Kilen SM, Mayo KE, Woodruff TK. The development of a mouse model of ovarian endosalpingiosis. Endocrinology. 2005;146:5228–5236. doi: 10.1210/en.2005-0697. [DOI] [PubMed] [Google Scholar]
- 11.Connolly DC, Bao R, Nikitin AY, Stephens KC, Poole TW, Hua X, Harris SS, Vanderhyden BC, Hamilton TC. Female mice chimeric for expression of the simian virus 40 TAg under control of the MISIIR promoter develop epithelial ovarian cancer. Cancer Res. 2003;63:1389–1397. [PubMed] [Google Scholar]
- 12.Flesken-Nikitin A, Choi KC, Eng JP, Shmidt EN, Nikitin AY. Induction of carcinogenesis by concurrent inactivation of p53 and Rb1 in the mouse ovarian surface epithelium. Cancer Res. 2003;63:3459–3463. [PubMed] [Google Scholar]
- 13.Wu R, Hendrix-Lucas N, Kuick R, Zhai Y, Schwartz DR, Akyol A, Hanash S, Misek DE, Katabuchi H, Williams BO, Fearon ER, Cho KR. Mouse model of human ovarian endometrioid adenocarcinoma based on somatic defects in the Wnt/beta-catenin and PI3K/Pten signaling pathways. Cancer Cell. 2007;11:321–333. doi: 10.1016/j.ccr.2007.02.016. [DOI] [PubMed] [Google Scholar]
- 14.Fathalla MF. Incessant ovulation—a factor in ovarian neoplasia? Lancet. 1971;2:163. doi: 10.1016/s0140-6736(71)92335-x. [DOI] [PubMed] [Google Scholar]
- 15.Kujubu DA, Fletcher BS, Varnum BC, Lim RW, Herschman HR. TIS10, a phorbol ester tumor promoter-inducible mRNA from Swiss 3T3 cells, encodes a novel prostaglandin synthase/cyclooxygenase homologue. J Biol Chem. 1991;266:12866–12872. [PubMed] [Google Scholar]
- 16.Williams CS, Mann M, DuBois RN. The role of cyclooxygenases in inflammation, cancer, and development. Oncogene. 1999;18:7908–7916. doi: 10.1038/sj.onc.1203286. [DOI] [PubMed] [Google Scholar]
- 17.Herschman HR, Talley JJ, DuBois R. Cyclooxygenase 2 (COX-2) as a target for therapy and noninvasive imaging. Mol Imaging Biol. 2003;5:286–303. doi: 10.1016/j.mibio.2003.09.006. [DOI] [PubMed] [Google Scholar]
- 18.Subbaramaiah K, Dannenberg AJ. Cyclooxygenase 2: a molecular target for cancer prevention and treatment. Trends Pharmacol Sci. 2003;24:96–102. doi: 10.1016/S0165-6147(02)00043-3. [DOI] [PubMed] [Google Scholar]
- 19.Prescott SM, Fitzpatrick FA. Cyclooxygenase-2 and carcinogenesis. Biochim Biophys Acta. 2000;1470:M69–78. doi: 10.1016/s0304-419x(00)00006-8. [DOI] [PubMed] [Google Scholar]
- 20.Yang WL, Roland IH, Godwin AK, Xu XX. Loss of TNF-alpha-regulated COX-2 expression in ovarian cancer cells. Oncogene. 2005;24:7991–8002. doi: 10.1038/sj.onc.1208943. [DOI] [PubMed] [Google Scholar]
- 21.Gupta RA, Tejada LV, Tong BJ, Das SK, Morrow JD, Dey SK, DuBois RN. Cyclooxygenase-1 is overexpressed and promotes angiogenic growth factor production in ovarian cancer. Cancer Res. 2003;63:906–911. [PubMed] [Google Scholar]
- 22.Daikoku T, Wang D, Tranguch S, Morrow JD, Orsulic S, DuBois RN, Dey SK. Cyclooxygenase-1 is a potential target for prevention and treatment of ovarian epithelial cancer. Cancer Res. 2005;65:3735–3744. doi: 10.1158/0008-5472.CAN-04-3814. [DOI] [PMC free article] [PubMed] [Google Scholar]
- 23.Urick ME, Johnson PA. Cyclooxygenase 1 and 2 mRNA and protein expression in the Gallus domesticus model of ovarian cancer. Gynecol Oncol. 2006;103:673–678. doi: 10.1016/j.ygyno.2006.05.012. [DOI] [PubMed] [Google Scholar]
- 24.Li S, Miner K, Fannin R, Carl Barrett J, Davis BJ. Cyclooxygenase-1 and 2 in normal and malignant human ovarian epithelium. Gynecol Oncol. 2004;92:622–627. doi: 10.1016/j.ygyno.2003.10.053. [DOI] [PubMed] [Google Scholar]
- 25.Lee G, Ng HT. Clinical evaluations of a new ovarian cancer marker, COX-1. Intl J Gynaecol Obstetr Official Organ Intl Feder Gynaecol Obstetr. 1995;49(Suppl):27–32. doi: 10.1016/0020-7292(95)02406-3. [DOI] [PubMed] [Google Scholar]
- 26.Kino Y, Kojima F, Kiguchi K, Igarashi R, Ishizuka B, Kawai S. Prostaglandin E2 production in ovarian cancer cell lines is regulated by cyclooxygenase-1, not cyclooxygenase-2. Prostaglandins, Leukotrienes, Essential Fatty Acids. 2005;73:103–111. doi: 10.1016/j.plefa.2005.04.014. [DOI] [PubMed] [Google Scholar]
- 27.Bahr J. The avian ovary: model for endocrine studies. J Exp Zool. 1990;4(Suppl):192–194. doi: 10.1002/jez.1402560441. [DOI] [PubMed] [Google Scholar]
- 28.Bahr JM, Johnson AL. Regulation of the follicular hierarchy and ovulation. J Exp Zool. 1984;232:495–500. doi: 10.1002/jez.1402320316. [DOI] [PubMed] [Google Scholar]
- 29.Johnson PA, Giles JR. Use of genetic strains of chickens in studies of ovarian cancer. Poult Sci. 2006;85:246–250. doi: 10.1093/ps/85.2.246. [DOI] [PubMed] [Google Scholar]
- 30.Giles JR, Olson LM, Johnson PA. Characterization of ovarian surface epithelial cells from the hen: a unique model for ovarian cancer. Exp Biol Med. 2006;231:1718–1725. doi: 10.1177/153537020623101108. [DOI] [PubMed] [Google Scholar]
- 31.Vanderhyden BC, Shaw TJ, Ethier JF. Animal models of ovarian cancer. Reprod Biol Endocrinol. 2003;67(1):1–11. doi: 10.1186/1477-7827-1-67. [DOI] [PMC free article] [PubMed] [Google Scholar]
- 32.Barnes MN, Berry WD, Straughn JM, Kirby TO, Leath CA, Huh WK, Grizzle WE, Partridge EE. A pilot study of ovarian cancer chemoprevention using medroxyprogesterone acetate in an avian model of spontaneous ovarian carcinogenesis. Gynecol Oncol. 2002;87:57–63. doi: 10.1006/gyno.2002.6806. [DOI] [PubMed] [Google Scholar]
- 33.Murdoch WJ, Martinchick JF. Oxidative damage to DNA of ovarian surface epithelial cells affected by ovulation: carcinogenic implication and chemoprevention. Exp Biol Med (Maywood) 2004;229:546–552. doi: 10.1177/153537020422900613. [DOI] [PubMed] [Google Scholar]
- 34.Murdoch WJ, Van Kirk EA, Alexander BM. DNA damages in ovarian surface epithelial cells of ovulatory hens. Exp Biol Med (Maywood) 2005;230:429–433. doi: 10.1177/15353702-0323006-11. [DOI] [PubMed] [Google Scholar]
- 35.Murdoch WJ, Townsend RS, McDonnel AC. Ovulation-induced DNA damage in ovarian surface epithelial cells of ewes: prospective regulatory mechanisms of repair/survival and apoptosis. Biol Reprod. 2001;65:1417–1424. doi: 10.1095/biolreprod65.5.1417. [DOI] [PubMed] [Google Scholar]
- 36.Murdoch WJ, McDonnel AC. Roles of the ovarian surface epithelium in ovulation and carcinogenesis. Reproduction. 2001;123:743–750. doi: 10.1530/rep.0.1230743. [DOI] [PubMed] [Google Scholar]
- 37.Oberley TD. Oxidative damage and cancer. Am J Pathol. 2001;160:403–408. doi: 10.1016/S0002-9440(10)64857-2. [DOI] [PMC free article] [PubMed] [Google Scholar]
- 38.Coussens LM, Werb Z. Inflammation and cancer. Nature. 2002;420:860–867. doi: 10.1038/nature01322. [DOI] [PMC free article] [PubMed] [Google Scholar]
- 39.Rothchild I, Fraps RM. On the function of the ruptured ovarian follicle of the domestic fowl. Proc Soc Exp Biol Med N Y. 1944;56:79–82. [Google Scholar]
- 40.Bahr J, Johnson P. Reproduction in poulty. In: Cupps P, editor. Reproduction in Domestic Animals. Academic Press; New York: 1991. pp. 555–575. [Google Scholar]
- 41.Wong WY, Richards JS. Evidence for two antigenically distinct molecular weight variants of prostaglandin H synthase in the rat ovary. Mol Endocrinol. 1991;5:1269–1279. doi: 10.1210/mend-5-9-1269. [DOI] [PubMed] [Google Scholar]
- 42.Hayes A, Scase T, Miller J, Murphy S, Sparkes A, Adams V. COX-1 and COX-2 expression in feline oral squamous cell carcinoma. J Comparat Pathol. 2006;135:93–99. doi: 10.1016/j.jcpa.2006.06.001. [DOI] [PubMed] [Google Scholar]
- 43.Richards JS, Russell DL, Ochsner S, Espey LL. Ovulation: new dimensions and new regulators of the inflammatory-like response. Annu Rev Physiol. 2002;64:69–92. doi: 10.1146/annurev.physiol.64.081501.131029. [DOI] [PubMed] [Google Scholar]
- 44.Mbonye UR, Wada M, Rieke CJ, Tang HY, DeWitt DL, Smith WL. The 19-amino acid cassette of cyclooxygenase-2 mediates entry of the protein into the endoplasmic reticulum associated degradation system. J Biol Chem. 2006;281:35770–35778. doi: 10.1074/jbc.M608281200. [DOI] [PubMed] [Google Scholar]
- 45.Wada M, Delong CJ, Hong YH, Rieke CJ, Song I, Sidhu RS, Yuan C, Warnock M, Schmaier AH, Yokoyama C, Smyth EM, Wilson SJ, Fitzgerald GA, Garavito RM, Sui DX, Regan JW, Smith WL. Enzymes and receptors of prostaglandin pathways with arachidonic acid- vs. eicosapentaenoic acid-derived substrates and products. J Biol Chem. 2007;282:22254–22266. doi: 10.1074/jbc.M703169200. [DOI] [PubMed] [Google Scholar]
- 46.Gomori G. A rapid one-step trichrome stain. Am J Clin Pathol. 1950;20:661–664. doi: 10.1093/ajcp/20.7_ts.661. [DOI] [PubMed] [Google Scholar]
- 47.Skeehan DC, Hrapchak BB. Theory and practice of histological techniques. Mosby; St Louis: 1973. pp. 111–112. [Google Scholar]