Abstract
Light dosimetry for photodynamic therapy requires a knowledge of the optical absorption spectrum of the tissue being treated Here, we present a theoretical and experimental analysis of the capabilities of a system using interstitial linear light sources ranging in length from 2 to 5 cm to illuminate the tissue interstitially, and isotropic point-like detectors to measure the resulting diffusely transmitted light. The sources and detectors are translated in transparent plastic catheters under the control of a motorized positioning system designed for interstitial measurements in the prostate. The light source is a quartz-tungsten-halogen (QTH), and the spectrally resolved detection is accomplished using a CCD-based grating spectrometer. The data are analyzed using an approximation to the radiative transport equation, assuming homogeneous scattering and heterogeneous absorption spectra Absorption spectra are reconstructed independently for individual source-detector channel pairs. Sequential reconstruction can then be used to create a 3-dimensional reconstruction. The results of simulated data, measurements made in multi-component phantoms, and synthetic data reconstructed from in vivo measurements made with point sources demonstrate the feasibility of this method.
Keywords: Photodynamic therapy , optical properties , dosimetry
1. INTRODUCTION
Dosimetry in photodynamic therapy (PDT) can be modeled accurately if the characteristics of the light source, the optical properties of the tissue being treated, the local sensitizer concentration, and the tissue oxygenation are known. The characterization of light sources is relatively straightforward. The characterization of tissue optical properties is a greater challenge. Many methods have been developed for the in vivo determination of optical properties. Many of these rely on measurements made on the tissue surface.1–6. These techniques, while relatively mature, are not appropriate for measurement of deep, bulky organs such as the prostate, which generally do not offer easy surface access. Our previous work in this area has focused on the development of minimally invasive, interstitial measurements of light fluence rate and optical properties in the human prostate.7–9. We have also investigated the ability of spectroscopic measurements to determine the sensitizer concentration and hemoglobin concentration and oxygen saturation of the prostate using interstitially placed point light sources and optical fiber-based isotropic detectors.10,11 While these measurements provide a large amount of information regarding the hemodynamics of the prostate, their clinical applicability is limited by the long time required to make the measurements. In the current work, we investigate the ability of corresponding measurements using linear cylindrical diffusing fibers (CDF’s) to generate useful information. The great advantage of these measurements is their speed; a single linear source can provide a set of spectroscopic measurements over the entire length of the prostate.
2. METHODS
2.1 Treatment and measurement setup
Measurements were made using a computer-controlled step-motor system developed previously 7,9–11 In this case, the motorized positioner is used to move six isotropic detectors simultaneously, all connected to a nltrogen-cooled CCD spectrograph. Twelve linear diffusing fibers are used as light sources. Each is sequentially illuminated by a quartz-tungsten-halogen (QTH) lamp.
2.2 Analytical model
We approximate the linear source as a superposition of evenly spaced isotropic point sources. The fluence rate from each point source is given by
| (1) |
where r is the distance from the source and S is the source power.
We model a linear diffuser of finite length as a sum of point sources. Each diffuser is divided into N evenly-spaced point sources. The fluence rate is given by
| (2) |
Where si is the power of the source at the ith position, a distance ri from the point of interest. In the simplest case, that of a uniform linear source, all the si’s are equal, and their sum is equal to the total source power. In reality, linear sources are generally nonuniform. In this case, the si’s are chosen to approximate the true profile of the linear source. If homogeneous optical properties are assumed, μeff,i and μ's,i are equal to the optical properties of the medium. To model inhomogeneous optical properties, the medium is divided into equally-spaced voxels. The value of μeff,i and μ's,i for each source are taken as the mean over a line connecting the source and the point of interest.
2.3 Optical spectra
To determine the optical spectra required to calculate fluence spectra, we make several simplifying assumptions regarding the absorption and scattering spectra of tissue. First, we assume the reduced scattering coefficient μs´ is approximated by
| (3) |
where A and b are assumed to be 14 cm−1 and 1.5, respectively, and λ0 is 730 nm, for ease of comparison with our single-wavelength measurements. The absorption spectrum is taken to be a sum of spectra of known absorbers:
| (4) |
where the ci are the concentrations of the known absorbers and εi are their extinction spectra. For our simulated data, our basis spectra are those of oxy- and deoxy-hemoglobin and the photosensitizer Motexafin lutetium (MLu).
2.4 Fitting algorithm
In order to fit simulated for measured data, we have developed a two-stage fitting algorithm implemented in Matlab (The Mathworks, Natick, MA). In each stage, it is assumed that the absorption and scattering spectra are modeled by equations 3 and 4, respectively. The goal of the fitting algorithm is to determine optimal values of A,b, and the appropriate concentrations ci for each spectrum. For physical consistency, all of these parameters are constrained to be positive.
In the first stage, it is assumed that the optical properties of the medium are homogeneous. The measured fluence rate is modeled using equation 2. One value of each free parameter is determined for the entire volume being interrogated, using an iterative nonlinear fitting algorithm (fminsearch) inherent in Matlab. In this step, we add an additional free parameter to allow for small shifts in the alignment of the source position to the measured data. Hence, we are able to determine a set of approximate bulk optical properties and the shift necessary to align the data with the source.
In the second stage, the values of A, b, and the shift between the source and measurement determined from the first stage are retained. It is assumed that the scattering spectrum is uniform across the sample. Because the problem is underdetermined (there are fewer independent measurements than possible free parameters), it is necessary to reduce the number of free parameters by simplifying the model. While the simplifying assumption of uniform scattering is not generally exactly correct, we expect based on our previous work in the human prostate that the scattering coefficient will vary much less than the absorption coefficient.9,11.
The scattering spectrum is determined by assigning a value of each ci to each voxel in the volume of interest. The initial values of all the ci’s are taken from the first (homogeneous) fitting stage. The second stage follows an iterative algorithm consisting of the following steps:
Determine the goodness of fit within each voxel, using the χ2 statistic.
Rank the voxels in order of decreasing χ2.
Starting with the voxel of poorest fit, loop through the voxels, optimizing the ci’s to minimize the value of χ2 for the voxel of interest and its four nearest neighbors.
Repeat this process until an acceptable fit is obtained.
In each optimization step, only the value of the ci’s in the voxel of interest are changed, but the value of χ2 for that voxel and its four nearest neighbors is used as the penalty function. The optimization is performed in a Matlab-standard nonlinear minimization routine, and the values of the ci’s are constrained to change no more than 30% in each iteration. This constraint serves to slow down the convergence in regions of large χ2, ensuring that no single voxel will change so drastically that neighboring voxels are forced to overcompensate. The repetition of the loop is terminated when successive iterations do not improve the worst voxel’s χ2 by more than a predetermined value (usually 10%).
2.5 Simulated data
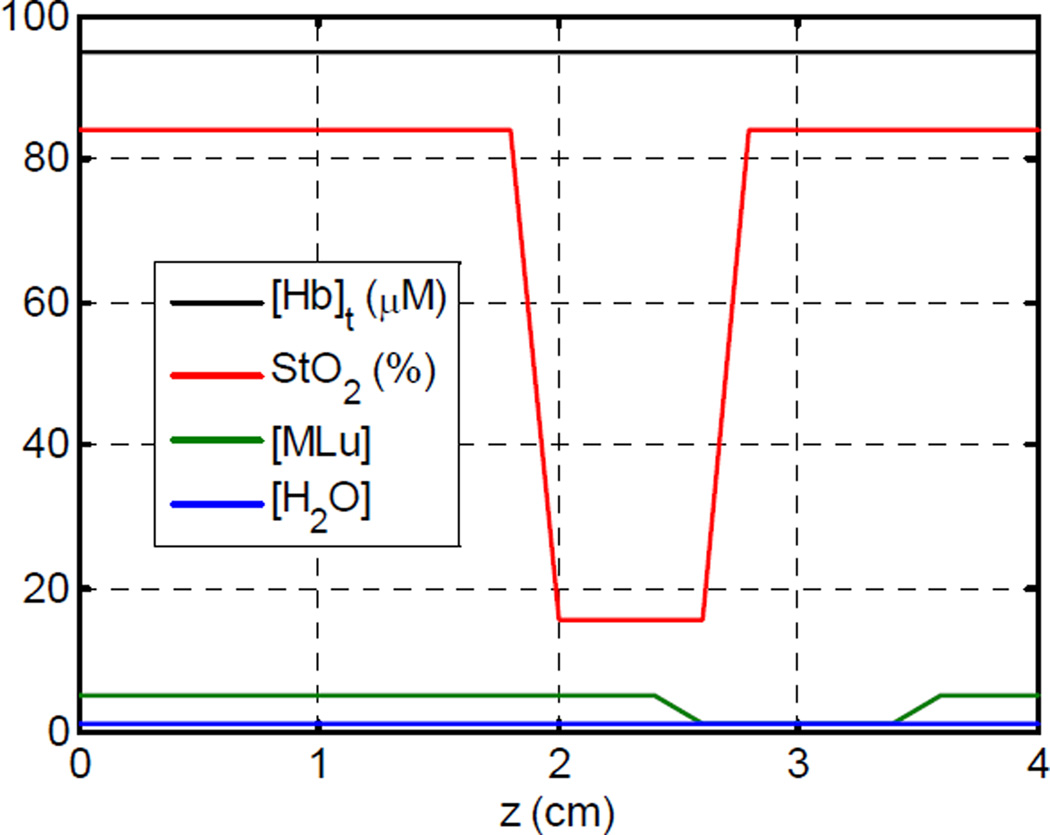
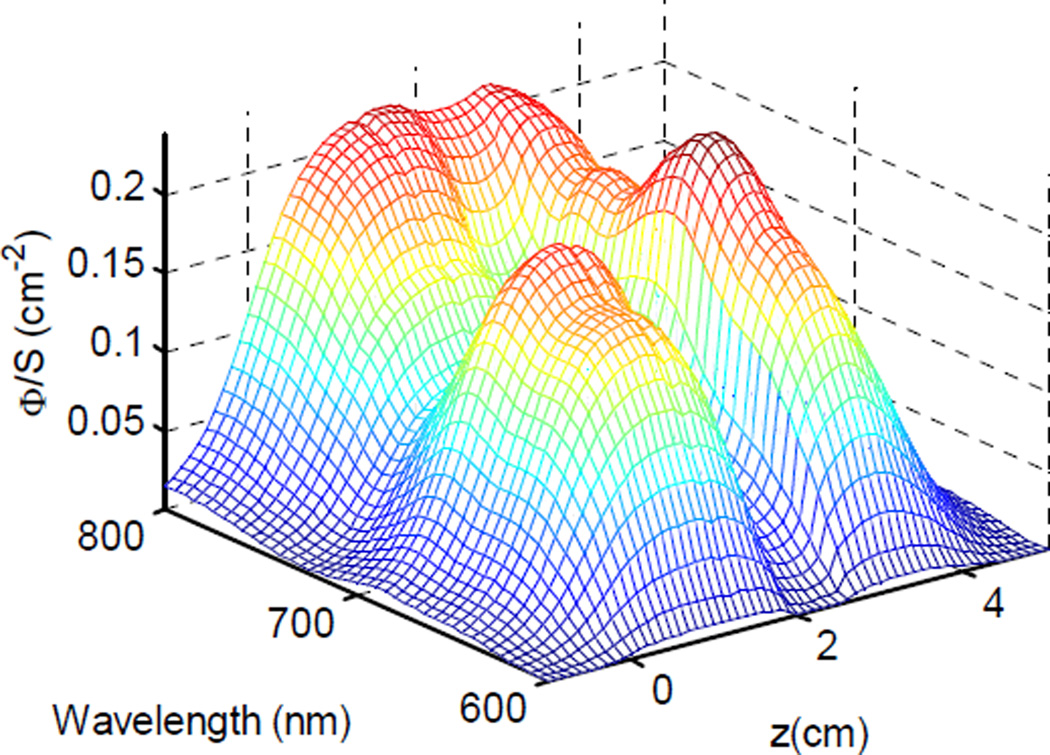
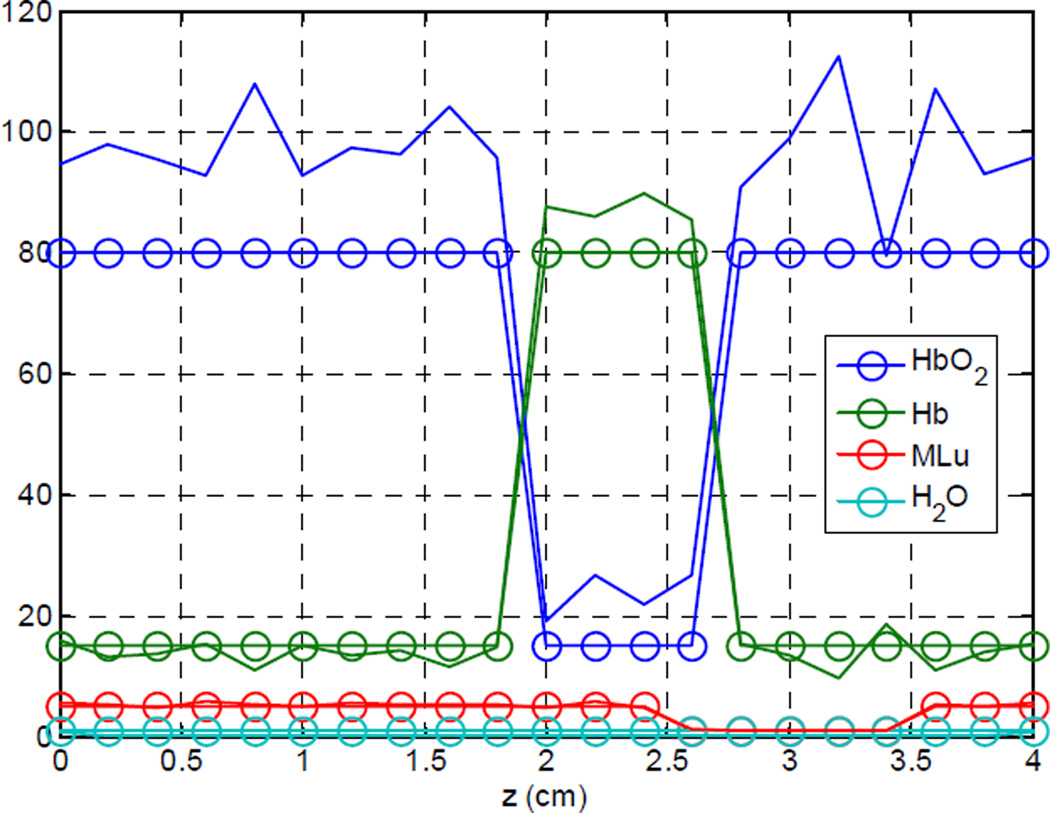
To test the ability of our algorithm to recover the optical spectra of tissue, we have constructed a set of artificial data in which the optical properties are known exactly. Our test data set uses uniform scattering with A and b values of 14 and 1.5, respectively. The absorption spectra are allowed to vary across the sample, as shown in figure (1). The concentrations of water and total hemoglobin were kept constant at 0.8 and 95 µM, respectively. The hemoglobin oxygen saturation (StO2) was varied from 84% to 16%, and the sensitizer concentration was varied between 1 and 5 mg/kg. A mesh plot of the resulting spectra are shown in figure (2).
Figure (1).
Absorption parameters for simulated data set.
Figure (2).
Fluence rate as a function of position and wavelength, as calculated based on the optical properties shown in figure (1).
2.6 Tissue-simulating phantoms
To better approximate the real clinical situation, a prostate-simulating phantom was constructed of room-temperature-vulcanizing (RTV) silicone gel. The optical properties were adjusted to match those expected in vivo using TiO2 as a scatterer and carbon black as an absorber. The phantom was constructed in an egg-shaped mold. Three cylindrical cavities were cut into the phantom and filled with RTV solutions of μa different from the bulk phantom, to allow the assessment of the sensitivity to optical inhomogeneities. The optical phantom was mounted in a standard prostate model compatible with transrectal ultrasound (TRUS).
An emission profile of each linear diffuser used in the experiment was measured independently by moving an isotropic detector along a catheter parallel and adjacent to the linear source in the absence of scattering or absorbing media. This measured profile was then normalized such that its sum was equal to the total power emitted by the diffuser, as measured in a calibrated integrating sphere. Single-wavelength (732 nm) and spectrally resolved diffuse transmission measurements were made in the phantom. The spectrally resolved data were fit using the scattering model described above and a variable absorption spectrum linearly dependent on wavelength, which approximates the spectrum of carbon black.
2.7 Linear source spectra synthesized from in vivo human data
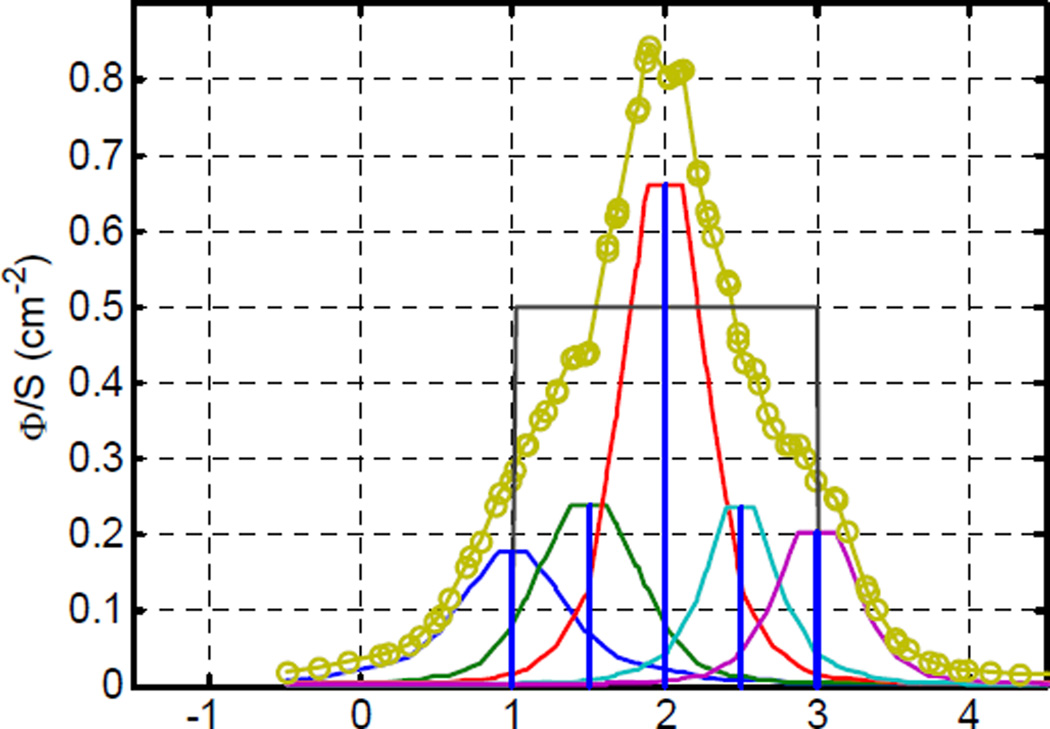
We have not acquired spectra of in vivo human prostates using linear sources, however we have several measurements made with point source data. For one patient in particular, we have made measurements of single-wavelength diffuse transmission, spectrally-resolved diffuse transmission, and fluorescence emission spectroscopy, and demonstrated that these measurements are correlated spatially, and give reasonable absolute agreement in sensitizer concentration.10 To simulate the results that would have been acquired from a linear source, we have combined the spectrally resolved transmission measured from the point source at 5 distinct positions in the tissue separated by 5 mm. For each point source, we first symmeterize the data by reflecting the scans about the source position, as shown in figure (3) Note that the source strengths for these scans were identical. The scan at the 2-cm position has a higher peak intensity because of the lower absorption and higher scattering coefficients of the tissue at this position (see Results). The resulting scans are then added together to simulate a single, uniform-intensity, 2 cm long linear light source. The data were fit using the algorithm described above.
Figure (3).
Fluence rate as a function of position at 732 nm for a series of 5 positions of a point light source after symmeterization (solid lines) and the sum used to simulate a 2 cm linear source.
3. RESULTS
3.1 Simulated data
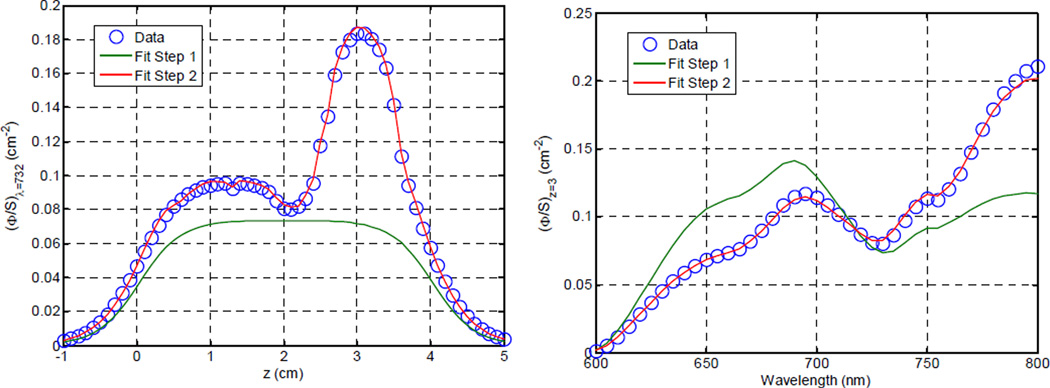
Figure 4 illustrates the results of both stages of fitting to the simulated data set described in section 2.5. As expected, the initial fit provides a compromise in amplitude and shape of the transmission spectrum, but misses many of the significant features, both in the wavelength and spatial domains. The second-stage fits corrects these shortcomings. The concentrations of the relevant chromophores are recovered within approximately 20% of the input values, as shown in figure 5
Figure (4).
Fits to simulated spectroscopic data plotted as a function of position (left) and wavelength (right).
Figure (5).
Simulation input parameters (open circles) and fit results (solid lines) for the simulated data set described in section 2.5.
3.2 Tissue-simulating phantoms
The optical properties obtained from measurements in the tissue-simulating phantom described above were in approximate agreement with the expected values, and could be obtained using the linear absorption spectrum. The inhomogeneity is apparent in the recovered profile (data not shown).
3.3 Synthetic in vivo data
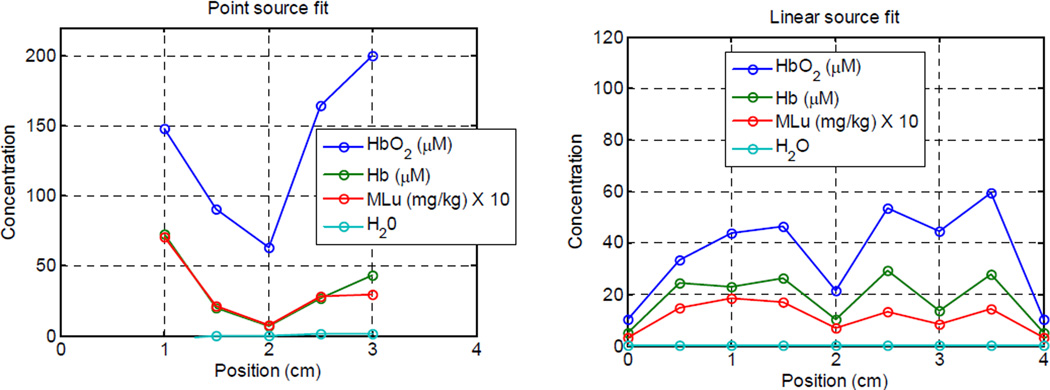
The synthetic data described in section 2.7 were fit using the linear source model. The results are shown in figure 7. The absorber concentrations recovered from the linear source model (right) recreate the major features recovered from point-by-point analysis using individual point sources (left), such as the dip in concentrations around the 2 cm mark. The differences between the two can be explained by three significant differences between the methods. First, the linear source model allows determination of optical properties beyond the physical extend of the source, which the point-by-point method does not, explaining the increased spatial extend of the recovered optical properties in the linear source case. Second, the linear source method explicitly accounts for variations in optical properties along the path from source to detector. The point-by-point method, as implemented here, assigns the optical properties recovered from a measurement to the position of the source at the time of measurement. Finally, the point source method explicitly calculates the reduced scattering coefficient μs’, while the linear source model assumes a uniform μs’ distribution. In this particular case, the point-by-point method recovered a significant variation in μs’ not reproduced in the linear source data.
Figure (7).
Results of fitting in vivo spectroscopic data using point-by-point fitting with a point source model (left) and by combining into a single, synthetic linear source and fitting with a linear source model (right)..
4. CONCLUSIONS
4.1 Implications for clinical PDT dosimetry
We have demonstrated the feasibility of monitoring optical properties and hemodynamic parameters using linear cylindrical diffusing fibers during prostate PDT. This method offers a significant improvement over our previously-reported methods, which relied on multiple measurements with point-like sources, in that it makes use of the cylindrical diffusers used for treatment directly, and requires only one detector scan to characterize a linear region of the prostate. This reduces the measurement time drastically, making it practical for routine clinical use. Furthermore, the ability to make measurements using linear sources is expected reduce the fraction of clinical data that is rendered useless by localized bleeding. In the case of point source-based measurements, this fraction could be quite large, because even a single spectrum being obscured could make determination of the point source location difficult. Finally, the use of the same light sources used for treatment to determine optical properties guarantees that, at least at the treatment wavelength, the optical properties recovered will correctly predict the fluence rate in tissue.
4.2 Future work
The results shown here are based on an approximate model of heterogeneous optical properties in media illuminated by a linear light source. In particular, we have assumed that light propagation through a heterogeneous medium can be modeled as propagation through a homogenous medium with optical properties equal to the mean optical properties along the light path in the heterogeneous medium. Li et al (ref) have demonstrated a more sophisticated model in which the boundary conditions at each heterogeneity are taken into account rigorously. The incorporation of such a model is expected to improve the accuracy of the results shown here.
A more practical concern is the time required, both in data acquisition and analysis. We are currently developing a motorized control system which is faster and has more channels (16 versus 2) than our current system. We expect this to increase the speed of data acquisition by increasing the number of channels which can be independently controlled, allowing the possibility of simultaneous measurements in multiple channels.
At present, the fitting of a single scan takes approximately two hours on a typical PC (Intel 1.6 GHz Core Duo processor). The reconstruction of the optical properties of an entire prostate would take days at this rate. In the future, we anticipate optimizing the calculation algorithm to make it more efficient. In addition, it may be possible to make significant gains by modifying the nonlinear optimization strategies to better take into account the expected behavior of the fluence rate model.
ACKNOWLEDGMENT
This work is supported by grants from National Institute of Health (NIH) R01 CA 109456 and P01 CA87971.
REFERENCES
- 1.Kienle A, Lilge L, Patterson MS, Hibst R, Steiner R, Wilson BC. Spatially resolved absolute diffuse reflectance measurements for noninvasive determination of the optical scattering and absorption coefficients of biological tissue. Appl. Opt. 1996;35(13):2304–2314. doi: 10.1364/AO.35.002304. [DOI] [PubMed] [Google Scholar]
- 2.Kienle A, Patterson MS. Determination of the optical properties of semi-infinite turbid media from frequency-domain reflectance close to the source. Phys. Med. Biol. 1997;42:1801–1819. doi: 10.1088/0031-9155/42/9/011. [DOI] [PubMed] [Google Scholar]
- 3.Kienle A, Patterson MS. Determination of the optical properties of turbid media from a single Monte Carlo simulation. Phys. Med. Biol. 1996;41:2221–2227. doi: 10.1088/0031-9155/41/10/026. [DOI] [PubMed] [Google Scholar]
- 4.Kienle A, Patterson MS. Improved solutions of the steady-state and the timeresolved diffusion equations for reflectance from a semi-infinite turbid medium. JOSA A. 1997;14:246–254. doi: 10.1364/josaa.14.000246. [DOI] [PubMed] [Google Scholar]
- 5.Hull EL, Foster TH. Steady-state reflectance spectroscopy in the P3 approximation. JOSA A. 2001;18:584–599. [Google Scholar]
- 6.Nichols MG, Hull EL, Foster TH. Spatially and spectrally resolved steady-state diffuse reflectance measurements of the optical properties of tissue-simulating phantoms. OSA Trends in Optics and Photonics on Biomedical Optical Spectroscopy and Diagnostics. 1996;3:50–54. [Google Scholar]
- 7.Dimofte A, Finlay JC, Zhu TC. A method for determination of the absorption and scattering properties interstitially in turbid media. Phys Med Biol. 2005;50(10):2291–2311. doi: 10.1088/0031-9155/50/10/008. [DOI] [PMC free article] [PubMed] [Google Scholar]
- 8.Finlay JC, Zhu TC, Dimofte A, Stripp D, Malkowicz SB, Whittington R, Miles J, Glatstein E, Hahn SM. In vivo determination of the absorption and scattering spectra of the human prostate during photodynamic therapy. Proc. SPIE. 2004;5315:132–142. doi: 10.1117/12.528968. [DOI] [PMC free article] [PubMed] [Google Scholar]
- 9.Zhu TC, Dimofte A, Finlay JC, Stripp D, Busch T, Miles J, Whittington R, Malkowicz SB, Tochner Z, Glatstein E, Hahn SM. Optical properties of human prostate at 732 nm measured in vivo during Motexafin Lutetium–mediated photodynamic therapy. Photochem Photobiol. 2005;81(1):96–105. doi: 10.1562/2004-06-25-RA-216. [DOI] [PMC free article] [PubMed] [Google Scholar]
- 10.Finlay JC, Zhu TC, Dimofte A, Stripp D, Malkowicz SB, Busch TM, Hahn SM. Interstitial fluorescence spectroscopy in the human prostate during motexafin lutetium-mediated photodynamic therapy. Photochem Photobiol. 2006;82:1270–1278. doi: 10.1562/2005-10-04-RA-711. [DOI] [PMC free article] [PubMed] [Google Scholar]
- 11.Zhu TC, Finlay JC, Hahn SM. Determination of the distribution of light, optical properties, drug concentration, and tissue oxygenation in-vivo in human prostate during motexafin lutetium-mediated photodynamic therapy. J Photochem. Photobiol. B: Biol. 2005;79:231–241. doi: 10.1016/j.jphotobiol.2004.09.013. [DOI] [PMC free article] [PubMed] [Google Scholar]


