

Abstract
Human speech sounds are produced through a coordinated movement of structures along the vocal tract. Here we show highly structured neuronal encoding of vowel articulation. In medial-frontal neurons, we observe highly specific tuning to individual vowels, whereas superior temporal gyrus neurons have non-specific, sinusoidally-modulated tuning (analogous to motor cortical directional tuning). At the neuronal population level, a decoding analysis reveals that the underlying structure of vowel encoding reflects the anatomical basis of articulatory movements. This structured encoding enables accurate decoding of volitional speech segments and could be applied in the development of Brain-Machine Interfaces for restoring speech in paralyzed individuals.
Introduction
The articulatory features that distinguish different vowel sounds are conventionally described along a two-dimensional coordinate system that naturally represents the position of the highest point of the tongue during articulation, e.g., in the International Phonetic Alphabet (IPA) chart1. The two axes of this system are height (tongue vertical position relative to the roof of the mouth or the aperture of the jaw) and backness (tongue position relative to the back of the mouth). How is the structured articulatory production encoded and controlled in brain circuitry? The gross functional neuroanatomy of speech production was described by multiple imaging, lesion and stimulation studies2,3 and includes primary, supplementary and pre-motor areas, Broca’s area, superior temporal gyrus, anterior cingulate cortex and other medial frontal regions2-4. The temporal dynamics of collective neural activity was studied in Broca’s area using local field potentials2,5. However, the basic encoding of speech features in the firing patterns of neuronal populations remains unknown.
Here, we study the neuronal encoding of vowel articulation in the human cerebrum at both the single-unit and the neuronal population levels. At the single neuron level, we find signatures of two structured coding strategies: highly specific sharp tuning to individual vowels (in medial-frontal neurons) and non-specific, sinusoidally-modulated tuning (in the superior temporal gyrus). At the neural population level, we find that the encoding of vowels reflects the underlying articulatory movement structure. These findings may have important implications for the development of high-accuracy brain-machine interfaces for the restoration of speech in paralyzed individuals.
Results
Speech-related neurons
Neuronal responses in human temporal and frontal lobes were recorded from eleven patients with intractable epilepsy monitored with intracranial depth electrodes to identify seizure foci for potential surgical treatment (see Methods). Following an auditory cue, subjects uttered one of five vowels (a /α/, e /ε/, i /i/, o /o/, u /u/), or simple syllables containing these vowels (consonant+vowel: da /dα/, de /dε/, di /di/, do /do/, du /du/…). We recorded the activity of 716 temporal and frontal lobe units. As this study focuses on speech and due to the inherent difficulty to distinguish between auditory and speech related neuronal activations, we analyzed only the 606 units that did not respond to auditory stimuli. A unit was considered speech-related if its firing rate during speech differed significantly from the pre-cue baseline period (see Methods). Overall, 8% of the analyzed units (49) were speech-related, of which, more than a half (25) were vowel-tuned, showing significantly different activation for the 5 vowels (see Supplementary Figure S1).
Sharp and broad vowel tuning
Two areas commonly activated in speech studies2, the superior temporal gyrus (STG) and a medial-frontal region overlying the rostral anterior cingulate and the adjacent medial orbitofrontal cortex (rAC/MOF; Brodmann areas 11 and 12; See Supplementary Figure S2 for anatomical locations of the electrodes), had the highest proportions of speech-related (75% and 11%, respectively) and vowel-tuned units (58% and 77% of these units). In imaging and electrocorticography studies, the rostral anterior cingulate cortex was shown to participate in speech control2,6 the orbitofrontal cortex in speech comprehension and reading7 and the STG in speech production at the phoneme level8. Involvement of STG neurons in speech production was also observed in earlier single unit recordings in humans9. We analyzed neuronal tuning in these two areas and found that it had divergent characteristics: broadly tuned units that responded to all vowels, with a gradual modulation in the firing rate between vowels, comprised 93% of tuned units in STG (13/14) but were not found in rAC/MOF (0/10), whereas sharply tuned units that had significant activation exclusively for one or two vowels comprised 100% of the tuned rAC/MOF units (10/10) were but were rare in STG (1/14).
Figure 1 displays responses of five sharply tuned units in rAC/MOF, each exhibiting strong, robust increases in their firing rate specifically for one or two vowel sounds, whereas for the other vowels firing remains at the baseline rate. For example, a single unit in the right rAC (Fig. 1, top row), elevated its firing rate to an average of 97 spikes/s when the patient said “a”, compared with 6 spikes/s for “i”, “e”, “o” and “u” (p < 10-13, one-sided two-sample t-test). Anecdotally, in the first two trials of this example (red arrow) the firing rate remained at the baseline level, unlike the rest of the “a” trials; in these two trials the patient wrongly said “ah” rather than “a” (confirmed by the sound recordings).
Figure 1.
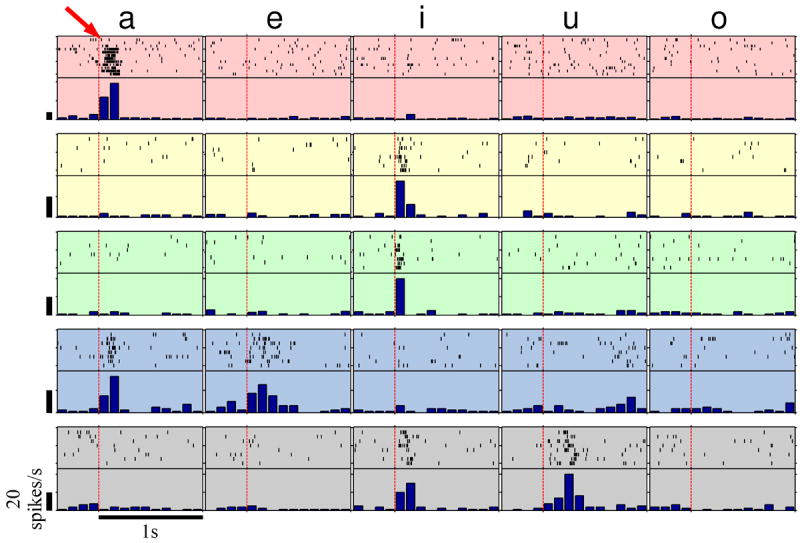
Sharply-tuned medial-frontal (rAC/MOF) units. Raster plots and peri-stimulus time histograms (PSTH) of five units during the utterance of the five vowels: a, e, i, u, and o. For each of the units, significant change in firing rate from the baseline occurred for one or two vowels only (see Methods). Red vertical dashed lines indicate speech onset. All vertical scale bars correspond to firing rates of 20 spikes/s.
A completely different encoding of vowels was found in the STG, where the vast majority of tuned units exhibited broad variation of the response over the vowel space, both during the articulation of vowels (Fig. 2a), and simple syllables containing these vowels (see Supplementary Figure S3a). This structured variation is well approximated by sinusoidal tuning curves (Fig. 2b and Supplementary Figure S3b) analogous to the directional tuning curves commonly observed in motor cortical neurons10. Units shown in Fig. 2 had maximal responses (“preferred vowel”; in analogy to “preferred direction”) to the vowels “i” and “u” which correspond to a closed articulation where the tongue is maximally raised, and minimal (“anti-preferred”) response to “a” and “o” where it is lowered.
Figure 2.
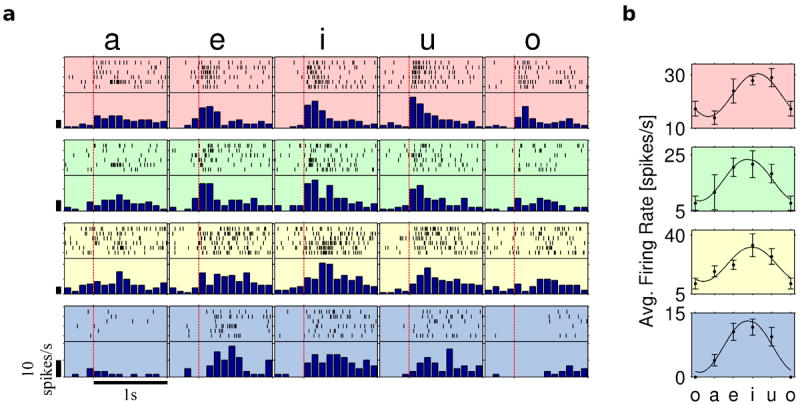
Broadly-tuned STG units. a, Raster plots and PSTHs during the utterance of the five vowels: a, e, i, u, and o. Significant change in firing rate from the baseline occurred for all or most vowels, with modulated firing rate (see Methods). Red vertical dashed lines indicate speech onset; vertical bars, 10 spikes/s. b, Tuning curves of the respective units in a over the vowel space, showing orderly variation in the firing rate of STG units with the articulated vowel.
Population-level decoding and structure
Unlike directional tuning curves, where angles are naturally ordered, vowels can have different orderings. In the tuning curves of Fig. 2 we ordered the vowels according to their place and manner of articulation as expressed by their location in the IPA chart1, but is this ordering natural to the neural representation? Instead of assuming a certain ordering, we could try and deduce the natural organization of speech features represented in the population-level neural code. That is, we can try to infer a neighborhood structure (or order) of the vowels where similar (“neighboring”) neuronal representations are used for neighboring vowels. We reasoned that this neighborhood structure could be extracted from the error structure of neuronal classifiers: when a decoder, such as the population vector11 errs, it is more likely to prefer a value which is a neighbor of the correct value than a more distant one. Thus, classification error rates are expected to be higher between neighbors than between distant features when feature ordering accurately reflects the neural representation neighborhood structure. In this case, classification error rates expressed by the classifier’s confusion matrix will have a band-diagonal structure.
To apply this strategy, we decoded the population firing patterns using multivariate linear classifiers with a sparsity constraint to infer the uttered vowel (see Methods). The five vowels were decoded with a high average (cross-validated) accuracy of 93% (significantly above the 20% chance level, p < 10-5, one-sided one-sample t-test, n = 6 cross-validation runs; see Supplementary Table S1), and up to 100% when decoding pairs of vowels (Fig. 3a). Next, we selected the vowel ordering that leads to band diagonal confusion matrices (Fig. 3b). Interestingly, this ordering is consistent across different neuronal subpopulations (Fig. 3b and Supplementary Figure S4) and exactly matches the organization of vowels according to their place and manner of articulation as reflected by the IPA chart (Fig. 3c). Because the vowel chart represents the position of the highest point of the tongue during articulation, the natural organization of speech features by neuronal encoding reflects a functional spatial-anatomical axis in the mouth.
Figure 3.
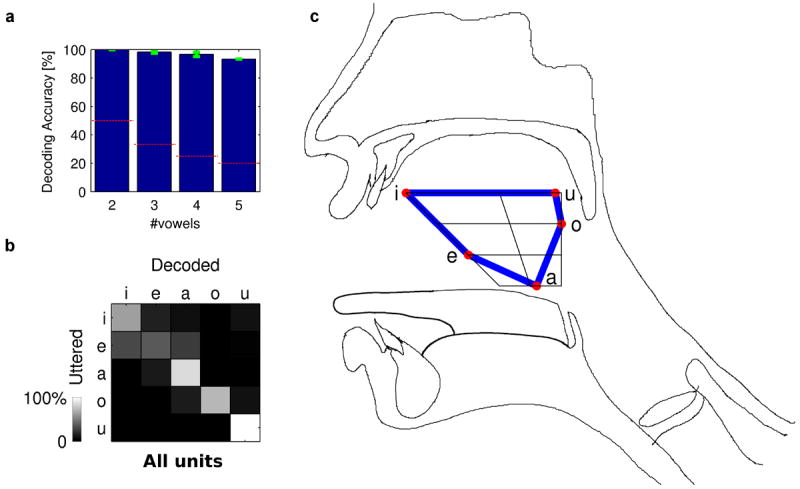
Inferring the organization of vowel representation by decoding. a, Average decoding accuracy (±standard error) vs. the number of decoded vowel classes. Red dashed lines represent the chance level. b, Confusion matrix for decoding population activity of all analyzed units to infer the uttered vowels. Band diagonal structure indicates adjacency of vowels in the order: a,e,i,u,o in the neural representation. High confusion in the corner (between u and i) implies cyclicity. c, The vowels IPA chart, representing the highest point of the tongue during articulation, on top of a vocal tract diagram. The inferred connections (blue lines), demonstrate neuronal representation of articulatory physiology.
Discussion
These results suggest that speech related rAC/MOF neurons use sparse coding for vowels, in analogy to the sparse bursts in songbirds’ area HVc12 and to the sparse, highly selective responses observed in the human medial temporal lobe13. In contradistinction, the gradually modulated speech encoding in STG implies previously unrecognized correlates with a hallmark of motor cortical control - broad, sinusoidal tuning, implying a role in motor control of speech production9. Interestingly, speech encoding in these anatomical areas is opposite in nature to that of other modalities: broad tuning for motor control is common in the frontal lobe10 (vs. STG in the temporal lobe) whereas, sparse tuning to high-level concepts is common in the temporal lobe13 (vs. rAC/MOF in the frontal lobe). Analogous to the recently-found sub-pathway between the visual dorsal and ventral streams14, our findings may lend support to a speech-related “dorsal stream” where sensorimotor prediction supports speech production by a state feedback control3. The sparse rAC/MOF representation may serve as predictor state, in line with anterior cingulate15 and orbitofrontal16 roles in reward prediction. The broad STG tuning may support evidence that the motor system is capable of modulating the perception system to some degree3,17,18.
Our finding of sharply-tuned neurons in rAC/MOF agrees with the DIVA model of the human speech system19, which suggests that higher-level prefrontal cortex regions involved in phonological encoding of an intended utterance, sequentially activate speech sound map neurons that correspond to the syllables to be produced. Activation of these neurons leads to the readout of feedforward motor commands to the primary motor cortex. Due to orbitofrontal connections to both STG20 and ventral pre-motor cortex (vPMC)21, rAC/MOF neurons may participate also in the feedback control map, where sharply-tuned neurons may provide a high-level “discrete” representation of the sound to utter, based on STG input from the auditory error map, before low-level commands are sent to the articulator velocity and position maps via vPMC. Our broadly-tuned STG units may also be part of the transition from the auditory error map to the feedback control map, providing a lower-level “continuous” population representation of the sound to utter.
Our results further demonstrate that the neuronal population encoding of vowel generation appears to be organized according to a functional representation of a spatial-anatomical axis: tongue height. This axis was shown to have a significant main effect on decoding from speech motor cortex units22. Whether these structured multi-level encoding schemes also exist in other speech areas like Broca’s2 and speech motor cortex, and how they contribute to the coordinated production of speech are important open questions. Notwithstanding, the structured encoding observed naturally facilitates high fidelity decoding of volitional speech segments and may have implications for restoring speech faculties in individuals who are completely paralyzed or “locked-in”23-28.
Methods
Patients and Electophysiology
Eleven patients with pharmacologically resistant epilepsy undergoing invasive monitoring with intracranial depth electrodes to identify the seizure focus for potential surgical treatment29 (9 right handed, 7 females, ages 19-53) participated in a total of 14 recording sessions, each on a different day. Based exclusively on clinical criteria, each patient had 8-12 electrodes for 1-2 weeks, each of which terminated with a set of nine 40-μm platinum–iridium microwires. Their locations were verified by MRI or by computer tomography coregistered to preoperative MRI. Bandpass filtered signals (0.3–3kHz) from these microwires and the sound track were synchronously recorded at 30kHz using a 128-channel acquisition system (Neuroport, Blackrock). Sorted units (WaveClus30, SUMU31) recorded in different sessions are treated as different in this study. All studies conformed with the guidelines of the Medical Institutional Review Board at the University of California Los Angeles.
Experimental Paradigms
Patients first listened to isolated auditory cues (beeps) and to another individual uttering the vowel sounds and three syllables (me/lu/ha) following beeps (auditory controls). Then, following an oral instruction, patients uttered the instructed syllable multiple times, each following a randomly-spaced (2-3sec.) beep. Syllables consisted of either monophthongal vowels (a /α/, e /ε/, i /i/, o /o/, u /u/) or a consonant (of: d /d/, g /g/, h /h/, j /d3/, l /l/, m /m/, n /n/, r /ɹ/, s /s/, v /v/) and one of the aforementioned vowels (e.g., da /dα/, de /dε/, di /di/, do /do/, du /du/)1. For simplicity, this paper employs the English rather than IPA transcription as described above. All sessions were conducted at the patient’s quiet bed-side.
Data Analysis
Of the 716 recorded units, we analyzed 606 that were not responsive during any auditory control (rostral anterior cingulate and adjacent medial orbitofrontal cortex (rAC/MOF): 123 of 156; dorsal and subcollosal anterior cingulate cortex (dsACC): 68/72; entorhinal cortex: 124/138; hippocampus: 103/114; amygdala: 92/106; parahippocampal gyrus: 64/66; superior temporal gyrus: 32/64). The anatomical sub-divisions of the ACC are according to McCormick et al.32 Due to clinical considerations29, no electrode was placed in the primary or pre- motor cortex in this patient population. Each brain region was recorded in at least three subjects. A unit is considered speech-related when the firing rate differs significantly between the baseline ([-1000,0]ms relative to the beep) and the response ([0,200]ms relative to speech onset; paired t-test, p < 0.05, adjusted for False Discovery Rate (FDR)33 control for multiple units and vowels, q < 0.05, n ranges between 6 and 12 trials depending on the session). For these units, we found the maximal response among the four 100ms bins starting 100ms before speech onset, and computed mean firing rates in a 300ms window around this bin. Tuned units are speech-related units for which the mean firing rate is significantly different between the 5 vowel groups (analysis of variance (ANOVA); F-test, p < 0.05, FDR33 adjusted, q < 0.05, n between 6 and 12 for each group). Broad, sinusoidally-tuned units are tuned units whose firing rate correlates with: a+bcos(c+i·2π/5) (where i=0,…,4 is the index of the vowel in a,e,i,u,o) with coefficient of determination R2 > 0.7 [10]. Sharply-tuned units are tuned units for which the mean firing rate in the 3 vowel groups of lowest mean firing rate is the same with high probability (ANOVA; F-test,p > 0.1, n between 6 and 12 for each group). The vowel decoder is a regularized multivariate linear solver, which minimizes ∥x∥L1 subject to ∥Ax-b∥ L2 ≤ σ (Basis Pursuit Denoising problem34). It has superior decoding performance and speed relative to neuron-dropping decoders (unpublished results). A contains the feature inputs to the decoder: spike counts of all units in a baseline bin ([-1000,0]ms relative to the beep) and in two 100ms response bins that followed speech onset; b are 5-element binary vectors coding the individual vowels uniquely. All decoding results were 6-fold cross-validated using trials that were not used for decoder training. The decoder was trained on all of the aforementioned features from the training set only, with no selection of the input neurons or their features. Instead, the sparse decoder described above automatically selects task-relevant features by higher weights it allocates to them using the minimal ∥x∥L1 constraint; task-unrelated features are thus diminished by low weights. Due to the high accuracy in decoding, we randomly dropped 20% of the units (in each cross-validation training) when computing confusion matrices, to increase the amount of confusions and allow the extraction of a meaningful band diagonal structure (except for the STG-only training, Supplementary Figure S4).
The vowels in Fig. 3c were placed on the IPA chart according to the locations previously calculated for American speakers (Ref1, page 42) and the overlaid connections (blue lines) were inferred by the maximal non-diagonal element for each row and each column of the confusion matrix.
Supplementary Material
Acknowledgments
We thank D. Pourshaban, E. Behnke, T. Fields and Prof. P. Keating of UCLA, and Prof. A. Cohen and A. Alfassy of the Technion for assistance and the European Research Council (STG #211055), NINDS, Dana Foundation, Lady Davis and L. and L. Richmond research funds for financial support.
Footnotes
Author Contributions
A.T., I.F & S.S. designed the study and wrote the manuscript; I.F. performed neurosurgeries; A.T. prepared experimental setup and performed the experiments; A.T. & S.S. analyzed data.
Competing financial interests: The authors declare no competing financial interests.
References
- 1.Handbook of the International Phonetic Association. Cambridge Univ. Press; 1999. [Google Scholar]
- 2.Sahin NT, Pinker S, Cash SS, Schomer D, Halgren E. Sequential processing of lexical, grammatical, and phonological information within Broca’s area. Science. 2009;326:445–449. doi: 10.1126/science.1174481. [DOI] [PMC free article] [PubMed] [Google Scholar]
- 3.Hickok G, Houde J, Rong F. Sensorimotor Integration in Speech Processing: Computational Basis and Neural Organization. Neuron. 2011;69:407–422. doi: 10.1016/j.neuron.2011.01.019. [DOI] [PMC free article] [PubMed] [Google Scholar]
- 4.Ghosh SS, Tourville JA, Guenther FH. A Neuroimaging Study of Premotor Lateralization and Cerebellar Involvement in the Production of Phonemes and Syllables. J Speech Lang Hear Res. 2008;51:1183–1202. doi: 10.1044/1092-4388(2008/07-0119). [DOI] [PMC free article] [PubMed] [Google Scholar]
- 5.Halgren E, et al. Spatiotemporal Stages in Face and Word-Processing .2. Depth-Recorded Potentials in the Human Frontal and Rolandic Cortices. J Physiol Paris. 1994;88:51–80. doi: 10.1016/0928-4257(94)90093-0. [DOI] [PubMed] [Google Scholar]
- 6.Paus T, Petrides M, Evans AC, Meyer E. Role of the human anterior cingulate cortex in the control of oculomotor, manual, and speech responses: a positron emission tomography study. J Neurophysiol. 1993;70:453–469. doi: 10.1152/jn.1993.70.2.453. [DOI] [PubMed] [Google Scholar]
- 7.Sabri M, et al. Attentional and linguistic interactions in speech perception. Neuroimage. 2008;39:1444–1456. doi: 10.1016/j.neuroimage.2007.09.052. [DOI] [PMC free article] [PubMed] [Google Scholar]
- 8.Buchsbaum BR, Hickok G, Humphries C. Role of left posterior superior temporal gyrus in phonological processing for speech perception and production. Cognitive Sci. 2001;25:663–678. [Google Scholar]
- 9.Ojemann GA, Creutzfeldt O, Lettich E, Haglund MM. Neuronal activity in human lateral temporal cortex related to short-term verbal memory, naming and reading. Brain. 1988;111(Pt 6):1383–1403. doi: 10.1093/brain/111.6.1383. [DOI] [PubMed] [Google Scholar]
- 10.Georgopoulos AP, Kalaska JF, Caminiti R, Massey JT. On the relations between the direction of two-dimensional arm movements and cell discharge in primate motor cortex. J Neurosci. 1982;2:1527–1537. doi: 10.1523/JNEUROSCI.02-11-01527.1982. [DOI] [PMC free article] [PubMed] [Google Scholar]
- 11.Georgopoulos AP, Schwartz AB, Kettner RE. Neuronal population coding of movement direction. Science. 1986;233:1416–1419. doi: 10.1126/science.3749885. [DOI] [PubMed] [Google Scholar]
- 12.Hahnloser RHR, Kozhevnikov AA, Fee MS. An ultra-sparse code underlies the generation of neural sequences in a songbird. Nature. 2002;419:65–70. doi: 10.1038/nature00974. [DOI] [PubMed] [Google Scholar]
- 13.Quian-Quiroga R, Reddy L, Kreiman G, Koch C, Fried I. Invariant visual representation by single neurons in the human brain. Nature. 2005;435:1102–1107. doi: 10.1038/nature03687. [DOI] [PubMed] [Google Scholar]
- 14.Tankus A, Fried I. Visuomotor Coordination and Motor Representation by Human Temporal Lobe Neurons. J Cogn Neurosci. 2011;24(3):600–610. doi: 10.1162/jocn_a_00160. [DOI] [PubMed] [Google Scholar]
- 15.Hayden BY, Heilbronner SR, Pearson JM, Platt ML. Surprise signals in anterior cingulate cortex: neuronal encoding of unsigned reward prediction errors driving adjustment in behavior. J Neurosci. 2011;31:4178–4187. doi: 10.1523/JNEUROSCI.4652-10.2011. [DOI] [PMC free article] [PubMed] [Google Scholar]
- 16.Wallis JD. Cross-species studies of orbitofrontal cortex and value-based decision-making. Nat Neurosci. 2012;15:13–19. doi: 10.1038/nn.2956. [DOI] [PMC free article] [PubMed] [Google Scholar]
- 17.Hickok G, Poeppel D. The cortical organization of speech processing. Nat Rev Neurosci. 2007;8:393–402. doi: 10.1038/nrn2113. [DOI] [PubMed] [Google Scholar]
- 18.Hickok G. Computational neuroanatomy of speech production. Nat Rev Neurosci. 2012;13:135–145. doi: 10.1038/nrn3158. [DOI] [PMC free article] [PubMed] [Google Scholar]
- 19.Guenther FH, Vladusich T. A neural theory of speech acquisition and production. Journal of Neurolinguistics. 2009:1–15. doi: 10.1016/j.jneuroling.2009.08.006. [DOI] [PMC free article] [PubMed] [Google Scholar]
- 20.Cavada C, Compañy T, Tejedor J, Cruz-Rizzolo RJ, Reinoso-Suárez F. The anatomical connections of the macaque monkey orbitofrontal cortex. A review. Cereb Cortex. 2000;10:220–242. doi: 10.1093/cercor/10.3.220. [DOI] [PubMed] [Google Scholar]
- 21.Carmichael ST, Price JL. Sensory and premotor connections of the orbital and medial prefrontal cortex of macaque monkeys. J Comp Neurol. 1995;363:642–664. doi: 10.1002/cne.903630409. [DOI] [PubMed] [Google Scholar]
- 22.Brumberg JS, Wright EJ, Andreasen DS, Guenther FH, Kennedy PR. Classification of intended phoneme production from chronic intracortical microelectrode recordings in speech-motor cortex. Front Neurosci. 2011;5:65. doi: 10.3389/fnins.2011.00065. [DOI] [PMC free article] [PubMed] [Google Scholar]
- 23.Guenther FH, et al. A wireless brain-machine interface for real-time speech synthesis. PLoS ONE. 2009;4:e8218. doi: 10.1371/journal.pone.0008218. [DOI] [PMC free article] [PubMed] [Google Scholar]
- 24.Brumberg JS, Nieto-Castanon A, Kennedy PR, Guenther FH. Brain-Computer Interfaces for Speech Communication. Speech Commun. 2010;52:367–379. doi: 10.1016/j.specom.2010.01.001. [DOI] [PMC free article] [PubMed] [Google Scholar]
- 25.Pasley BN, et al. Reconstructing speech from human auditory cortex. PLoS Biol. 2012;10:e1001251. doi: 10.1371/journal.pbio.1001251. [DOI] [PMC free article] [PubMed] [Google Scholar]
- 26.Pei X, Barbour DL, Leuthardt EC, Schalk G. Decoding vowels and consonants in spoken and imagined words using electrocorticographic signals in humans. J Neural Eng. 2011;8:046028. doi: 10.1088/1741-2560/8/4/046028. [DOI] [PMC free article] [PubMed] [Google Scholar]
- 27.Leuthardt EC, et al. Using the electrocorticographic speech network to control a brain–computer interface in humans. J Neural Eng. 2011;8:036004. doi: 10.1088/1741-2560/8/3/036004. [DOI] [PMC free article] [PubMed] [Google Scholar]
- 28.Formisano E, De Martino F, Bonte M, Goebel R. ‘Who’ Is Saying ‘What’? Brain-Based Decoding of Human Voice and Speech. Science. 2008;322:970–973. doi: 10.1126/science.1164318. [DOI] [PubMed] [Google Scholar]
- 29.Fried I, et al. Cerebral microdialysis combined with single-neuron and electroencephalographic recording in neurosurgical patients. J Neurosurg. 1999;91:697–705. doi: 10.3171/jns.1999.91.4.0697. [DOI] [PubMed] [Google Scholar]
- 30.Quian-Quiroga R, Nadasdy Z, Ben-Shaul Y. Unsupervised spike detection and sorting with wavelets and superparamagnetic clustering. Neural Comput. 2004;16:1661–1687. doi: 10.1162/089976604774201631. [DOI] [PubMed] [Google Scholar]
- 31.Tankus A, Yeshurun Y, Fried I. An automatic measure for classifying clusters of suspected spikes into single cells versus multiunits. J Neural Eng. 2009;6:056001. doi: 10.1088/1741-2560/6/5/056001. [DOI] [PMC free article] [PubMed] [Google Scholar]
- 32.McCormick LM, et al. Anterior cingulate cortex: An MRI-based parcellation method. NeuroImage. 2006;32:1167–1175. doi: 10.1016/j.neuroimage.2006.04.227. [DOI] [PubMed] [Google Scholar]
- 33.Benjamini Y, Hochberg Y. Controlling the false discovery rate: a practical and powerful approach to multiple testing. Journal of the Royal Statistical Society Series B Methodological. 1995;57:289–300. [Google Scholar]
- 34.van den Berg E, Friedlander MP. Probing the Pareto Frontier for Basis Pursuit Solutions. SIAM Journal on Scientific Computing. 2008;31:890–912. [Google Scholar]
Associated Data
This section collects any data citations, data availability statements, or supplementary materials included in this article.