

Abstract
Evidence from animal models and patient data indicate that febrile status epilepticus (FSE) in early development can result in permanently diminished cognitive abilities. To understand the variability in cognitive outcome following FSE, we used MRI to measure dynamic brain metabolic responses to the induction of FSE in juvenile rats. We then compared these measurements to the ability to learn an active avoidance spatial task weeks later. T2 relaxation times were significantly lower in FSE rats that were task learners in comparison to FSE non-learners. While T2 time in whole brain held the greatest predictive power, T2 in hippocampus and basolateral amygdala were also excellent predictors. These signal differences in response to FSE indicate that rats that fail to meet metabolic and oxygen demand are more likely to develop spatial cognition deficits. Place cells from FSE non-learners had significantly larger firing fields and higher in-field firing rate than FSE learners and control animals and implies increased excitability in the pyramidal cells of FSE non-learners. These findings suggest a mechanistic cause for the spatial memory deficits in active avoidance and are relevant to other acute neurological insults in early development where cognitive outcome is a concern.
Keywords: Cognition, Febrile Status Epilepticus, MRI, Place Cells
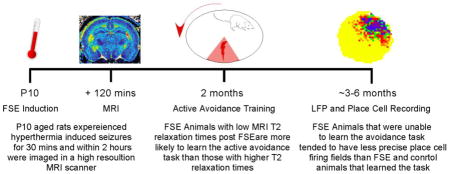
Graphical abstract
Introduction
Febrile Seizures (FS) are the most common type of seizures seen in young children occurring in 2–5% of children before the age of 5 (Huang et al., 1999; Shinnar and Pellock, 2002). Epidemiological clinical studies suggest that most children with FS have normal development and intelligence (Annegers et al., 1987; Chang et al., 2001; Verity et al., 1998) while some children with prolonged FS appear to be at risk for long-term mild cognitive disturbances (Chang et al., 2001; Epstein et al., 2012; Martinos et al., 2012; Martinos et al., 2013). Why some children with prolonged FS are predisposed to cognitive deficits is unknown.
Prospective imaging studies in children with prolonged FS have identified early hippocampal edema, within 48 hours of the event, as a common finding (Scott et al., 2003; Scott and Neville, 2009; Shinnar et al., 2012; VanLandingham et al., 1998). Although these findings appear to predict hippocampal volume and growth (Lewis et al., 2013; Yoong et al., 2013) it remains uncertain whether these findings predict cognitive disruption. The long follow-up timescale required for human studies has led to the development of animal models to address whether neuronal function within the hippocampal circuit might be permanently affected by a single bout of febrile status epilepticus (FSE), and if these changes can be predicted early in the course of events that follow FSE (Choy et al., 2014; Dube et al., 2004; Dube et al., 2010; Dube et al., 2009; Jansen et al., 2008).
In early animal studies, MR imaging shortly after the seizures failed to demonstrate predictive value for cognitive or epileptogenic outcomes (Dube et al., 2004; Dube et al., 2010; Dube et al., 2009; Jansen et al., 2008). However, these studies were conducted on low-magnetic field MRI scanners. Dube et al. (Dube et al., 2009) carried out MRI studies using a higher field magnet (7 T) and showed that increases in T2 relaxation time one month following FS can serve as a putative surrogate marker associated with moderate spatial deficits in a sub-population of animals that had experienced FS. In this timescale the T2 time is a marker of long-term brain modification by FS but does not give insight into the dynamic pathophysiological processes that occur around the time of the seizure and whether the degree of change is important for determining outcomes in relation to cognitive abilities. The use of early T2 measurements provides information on brain water content as well as information of oxygen extraction, given the paramagnetic effects of deoxyhemoglobin (Choy et al., 2014). Based on clinical observations, we hypothesized that a subset of rats with FSE would have cognitive impairment. Further, we hypothesized that the magnitude of change in the MRI, representative of metabolic demand post FSE, is predictive of cognitive outcome and that such changes are due to permanent alterations in neural networks that underpin spatial performance. Delineating the processes that culminate in normal or impaired cognitive ability provides a powerful tool for directing experimental or proven interventions to a ‘at risk’ population, thereby minimizing adverse outcomes. To this end, we set out to identify prolonged FS animals that exhibit normal or impaired learning on a complex spatial task as adults and relate these cognitive outcomes to both MRI changes following FSE induction as well as electrophysiological parameters close to the time of behavioral testing.
Methods
Overview
All animals used in the study were born at UC Irvine and shipped to Dartmouth post weaning in groups of 11–12 animals. On postnatal day 10 (P10) a total of 24 male rats experienced febrile status epilepticus (FSE) and 23 rats were used as normothermic controls (littermates of experimental group that were removed from the cage). At P10 FSE rat pups (N=24) underwent induction of febrile status epilepticus while normothermic control animals (N=23) underwent separation from the dam for a matched time period. A total of 25 rats were imaged for quantitative mapping of T2 relaxation time at high-field MRI at P10: 13 FSE rats and 11 normothermic controls were scanned 2 hours after the FSE or maternal separation in the controls. At age 2 months, all rats from (N=47) were trained to perform an active avoidance task in which they learned to avoid a shock zone on a rotating arena. When the rats were approximately 3 months old they were trained to pellet chase on the stable arena. A subset of control (N=8) and FSE animals (N=8) were then implanted with an array of micro-electrodes in each hippocampus that allowed for the recording of local field potentials and place cells during pellet chasing behavior.
All procedures were approved by local institutional animal care and use committee and conducted in accordance with guidelines from the National Institutes of Health.
Induction of experimental FSE
Forty-seven male Sprague-Dawley rats were born and maintained in quiet facilities under controlled temperatures and light dark cycle. Their birth was timed within 12 hours and the date of birth was considered postnatal day (P) 0. On P2, mixed litters were culled to 10 pups, if needed. When weaned (on P21), male rats were housed 2–3 per cage and used in the current study. Experimental procedures were approved by UC-Irvine or Loma Linda University Institutional Animal Care Committees and conformed to NIH guidelines.
FSE was induced as previously described for 24 rats (Chen et al., 1999; Dube et al., 2006; Dube et al., 2010). Briefly, on P10, pups were placed in a glass container and their core temperature, which is highly correlated with brain temperature (Dube et al., 2005), increased to approximately 40.5°C (simulating high fever) using a regulated stream of warm air. Core temperatures were measured at baseline, at seizure onset, and every 2 mins during the hyperthermia. Hyperthermic seizures manifest as characteristic behaviors: seizure onset is heralded by a sudden loss of motion (freezing), followed by oral automatisms and forelimb clonus. Seizures progress to body flexion with chewing of an extremity and one or more tonic stage 5 seizures. Hyperthermia (Maximum temperature: 41.5–42.9°C) was maintained for less than 34–38 mins (Dube et al., 2010) resulting in behavioral seizures lasting an average of 36.8 mins (± 0.24 SEM). This was done in order to enhance clinical applicability. We modeled our experiment on clinical studies (Bassan et al., 2013; Scott et al., 2006; Scott and Neville, 2009; Shinnar et al., 2008) which defined febrile status epilepticus as a seizure associated with fever lasting longer than 30 mins.
The control group included 23 littermates of the experimental group that were removed from the cage for the same duration to control for potential stress and their core temperatures kept within normal range for age (normothermic controls).
MRI protocol
MRIs were performed on a Bruker Avance 11.7T MR scanner (Bruker Biospin, Billerica) as recently described (Choy et al., 2014). Thirteen FSE-sustaining rats and 11 littermate controls were scanned at 2 hours following FSE or, in the case of normothermic controls, removal from the home cage for a duration equivalent to hyperthermia and normal body temperatures were maintained. Rats were anesthetized for the duration of the imaging using 1.5% isoflurane in 100% O2. For each scan the animal was positioned prone on a cradle and body temperature was maintained using a thermostat-controlled warm water cushion. Scout images were obtained to accurately position the brain. A field-of-view of 2.3cm and a slice thickness of 0.75mm was used for all scans. T2-weighted images were acquired using 2D-Multi-Echo-Spin-Echo Sequence (2D-MESE) with the following parameters: TR = 4697 ms, TE = 10.21, 20.42, 30.63, 40.84, 51.05, 61.26, 71.47, 81.68, 91.89, and 102.1 ms, matrix size = 192 × 192, number of averages = 2, and 20 slices. Absolute T2 relaxation time values (ms) were calculated by log transform followed by a least squares fit on a pixel-by-pixel basis, and T2 maps were generated using in-house software (Matlab, Mathworks). All images were coded and analyzed without knowledge of treatment group. Regions were delineated manually and measured using ImageJ software (version 1.25l, NIH, Bethesda), and T2 times for bilateral regions were averaged for analysis. Regions delineated include brain, dorsal hippocampus, basolateral and medial amygdala, medial thalamus, cerebellum, prelimbic cortex, and auditory cortex.
Active place avoidance behavioral task
The active place avoidance task (Biosignal; Brooklyn, New York) was developed to measure spatial memory and cognition (Pastalkova et al., 2006; Popp et al., 2011). In this task, animals learn to associate an unmarked region of space with a mild shock on a constantly rotating arena. The rats must attend to their ever-changing position in the room frame lest they be rotated into a pre-determined shock zone where they receive a mildly painful electrical shock.
At approximately 2 months old, 23 control and 24 FSE rats were lightly anesthetized and implanted with a stainless steel swivel (Eagle Claw, USA) in the skin between the shoulders. This allowed attachment of a cable with an LED at the end that allows for automated tracking and also the delivery of shock. Experimenters were blind as to which animals were control and FSE.
The arena consists of a steel disc 82 cm in diameter and is lighted from both above and below. A white cue card with black diagonal lines was placed on the West wall (1.2m long and 0.75 m high) and a white cue was placed on the East wall (1.2 m long and 0.75 m high). Two proximal cue cards (45 cm long × 62 cm wide), one black (Color-Aid 9.5 gray) and one white (Color-Aid 2.5 grey) were placed approximately 20 cm from the periphery of the arena and were 135° apart from center to center.
On day one of training, the animal was connected to the cable and allowed to explore the arena for 10 mins. On the second day, a clear plexiglass barrier was placed around the perimeter of the arena that rotated at a rate of one revolution per minute. The rat was again allowed to explore the arena for 10 mins. On all subsequent days, rats received a 0.2 ma shock in an unmarked 876 cm2 wedge-shaped sector of the arena with a 60° arc on the Southern edge of the arena (Figure 1A). This shock zone was stable in the room frame while the arena rotated. The entrance latency of the shock was 1 ms, the shock duration was 0.5 s and the inter-shock latency was 2 s.
Figure 1.

Illustration of the active avoidance task and behavioral results: A) Rats were tethered to a shock cable connected to a pin that was subcutaneously implanted on the back of the rat’s neck. An LED at the end of the shock cable (indicated by green crosshair) was used to signal the rat’s position in the room frame while the arena rotated counter-clockwise. The rat’s path is indicated by black lines. When the rat entered the shock zone (gray sector in southern position), the rat received a mild electrical shock (indicated by open red circles); B) Dwell-time maps during habituation and training sessions. Red colors indicate more time while bluer colors indicate less time. The top row shows examples of avoidance behavior over several sessions (left to right) from a rat that learned to avoid (L=Learner). Note that over the course of training the rat spends more time in a more circumscribed region of the arena, far from the shock zone. The bottom row shows examples over several sessions from a rat that did not learn to avoid (Non-learner=NL). The final training session on the far right looks similar to the habituation session; C) The percentage of learners (L) and non-learners (NL) in the control (left) and FSE (right) groups.
Training was continued with two 10 minute sessions per day until criterion was met (≤ 5 shocks within two consecutive sessions). As with previous work using this task by our group, training did not continue beyond 15 sessions (Jenks et al., 2013). If criterion was not met by session 15, the rat was designated a non-learner.
Pellet chasing
Approximately 1 month following behavioral training in active avoidance, rats were food deprived within 85% of their pre-deprivation body weight and trained to chase sugar pellets on the arena. The pellets dropped randomly from an overhead feeder every 30 secs. Pellet-chasing training continued for approximately 20 mins a day for 5 consecutive days.
Surgery
At approximately 3 months old 7 control and 8 FSE rats underwent implantation of a bilateral array of recording electrodes. The rats were anesthetized with inhaled isoflurane and placed in a stereotaxic frame. The skull was exposed and four screws inserted, two anterior to the left and right ends of bregma and two left and right over the cerebellum. Grounding was achieved via the right cerebellar screw.
Rats were chronically prepared with a custom implant (Versadrive; Neuralynx, Montana) that allowed for LFP and single cell recording from a 2 × 2 array of tetrodes in both the left and right hippocampus (− 3.8 AP, ± 3.8 ML, set at ± 10°). All tetrodes were made from 25 μm diameter nichrome wire (A-M systems; Carlsborg, WA), wound with programmable servo motors and cut square. The tips of these tetrodes were placed 2.0 mm below the skull surface. For all implants, each tetrode wire was gold plated before implantation until the impedance was between 80–130 KOhms.
All implants were fixed to the skull via the skull screws and Grip Cement (Dentsply Inc.). The wound was sutured and topical antibiotic applied. The interval between surgery and the beginning of the cell screening process was 1 week.
Electrophysiology
Rats were tethered to a recording cable while they foraged for sugar pellets. Signals from the brain were pre-amplified X1 at the headstage and channeled through the tether cable to the signal amplifiers and computer interface. Tetrode signals were sampled at 33 KHz and filtered at 300–6000 Hz (Neuralynx, Montana) for single units, subsampled at 3000 Hz and filtered at 1–9000 Hz for LFPs. All signals were referenced against a tetrode wire in the neocortex. The rat’s location in the arena was sampled at 60 Hz (Biosignal, Brooklyn, USA). The activity of individual units was separated offline into different clusters based on their waveform properties. Waveform properties were defined in 3 dimensional feature space (Offline Sorter, Plexon, Dallas, TX) by first comparing peak amplitude across all 4 wires of the recording tetrode. Further processing was performed by using the waveform projection of the first principal component (PC1),
Where w(t) = [w(1),…,w(n)] is the waveform (n=number of points in a waveform), and p1(t)=[p1(1),…,p1(n)] is the first principal component vector.
The raw data recordings comprised of a series of action potential time stamps for each isolated cluster and a 30 Hz series of time stamped x and y co-ordinates for tracking LEDs mounted on the preamplifier connected to the implant. A 64 by 64 element firing rate array (Muller et al., 1987) for each cell cluster was first constructed (custom Matlab software; Mathworks); each element corresponded to a square pixel 3.5 cm on a side. To make the spatial firing rate array, the number of spikes for each cell was counted for each element and were speed filtered to only include epochs where the rat’s movement was greater than 3 cm/s. The total time spent by the animal was then accumulated for each element. In these firing rate maps, yellow pixels represent regions in which the firing rate was exactly zero. Increasing firing rates are represented in the color order: orange, red, green, blue, purple. The number key for each map shows the median firing rate for each color category. Pixels never visited by the rat are white.
Firing field properties
Only units that were determined to be pyramidal cells (Robbins et al., 2013) were considered for analysis. In the case of multiple fields, only the largest sub-field was considered. The firing fields of cells were also required to meet the following criteria:
Firing rate: The number of spikes fired by the cell in the firing field divided by dwell-time in the field. Only cells with an average in-field firing rate < 9Hz were include in the data set. This threshold was set to avoid including putative interneurons in the dataset.
Firing field coherence: Nearest-neighbor 2-D firing rate autocorrelation (Muller and Kubie, 1989). Field coherence is calculated in three steps. First, parallel lists are constructed for the firing rate in each pixel and the average firing rate in the eight nearest neighbors. Next, the product–moment correlation between the two lists is calculated. Coherence itself is defined as the z-transform of the correlation [z= 1/2 ln (1 + x / 1 − x)]; it estimates the local smoothness of the spatial firing distribution. Coherence values > 0.3 are considered to be place cells (Muller and Kubie, 1989).
Field size: The field size of firing fields ranged between a minimum of 9 contiguous pixels and a maximum of 700 pixels (approximately 60% of the arena surface).
Screening and recording protocols
During cell screening sessions, animals were placed on the arena without food pellets. If no units could be isolated, the tetrode drives were lowered. In the case of hippocampal electrode placements, the electrodes were advanced until the activity of at least 10 pyramidal cells could be isolated. Only cells recorded from layer CA1 in the dorsal hippocampus were included in the analysis. A recording session would then begin and the rat would pellet chase for approximately 30 mins.
At the end of the recording session the electrodes were advanced to contact new cells and to optimize the number of simultaneously recorded cells. The rats would then be screened again the next day.
Detection of interictal spikes
Interictal spikes were counted during foraging sessions for each rat by an observer (GLH) blinded to group. Interictal spikes were defined as sharply contoured waveforms that were distinctly different than on-going background EEG activity. By definition, spikes were were differentiated from physiological sharp waves by their shorter duration (<70 msec) and were typically followed by a slow wave (Kleen et al., 2010; Staley and Dudek, 2006).
Statistical analyses
Independent t-tests were used to identify differences in regional T2 relaxation times between FSE and control animals, as well as between the learning and non-learning FSE animals. The Holm-Bonferroni method (Holm, 1979) was used to correct for multiple comparisons between FSE learners and non-learners by controlling for the Familywise error rate by applying stricter significance criteria to the smallest p-values. We then employed Cox Regression analyses to identify differences in the number of sessions required for FSE animals to reach criterion in the place avoidance task when compared to controls, adjusting for T2 relaxation time. This adjustment allows us to evaluate whether there is a difference in time to reaching criterion for any given T2 relaxation time thereby allowing inferences about the impact of T2 relaxation time on the ability to learn the avoidance task..
As the place cell dataset contains data from multiple sessions in single animals, the assumptions of independence of observations are invalid. The observations within single animals are likely to be correlated, and these data can be represented as a cluster. In this case, the existence of a relationship between different firing field properties, within an individual animal, may then be assumed (Ziegler et al., 1998). In this study we use generalized estimating equations (GEE), a class of regression marginal model, for exploring multivariable relationships between clustered response data and outcome measures. We examined whether the firing field properties, coherence, in-field firing rate and field size, differed between controls, FSE learners and FSE non-learners.
Results
Active avoidance
Animals that met the criterion of 5 or fewer shocks in 2 consecutive sessions were designated as learners (L). Those that failed to reach criterion by the end of training (15 sessions) were designated as non-learners (NL). Learners, over the course of several sessions, confined their movements to smaller sectors of the arena. In later sessions the majority of time was typically spent on the periphery of the arena and opposite the shock zone (Top Figure 1B). In the case of non-learners, dwell-time was relatively evenly distributed around the periphery of the arena and in many cases was indistinguishable from the habituation session (Bottom Figure 1B). Animals were designated as learners in 18/23 (78%) of control animals versus 14/24 (58%) of FSE animals (Figure 2C). Contingency table analysis revealed that the proportion of learners and non-learners in the control and FSE animals was not significantly different (χ2= 2.15, p=0.14, df=1). None of the features associated with hyperthermic induction of FSE at P10 (seizure duration, seizure threshold, maximal temperature or hyperthermia duration) were found to influence the categorization of FSE animals as learners or non-learners.
Figure 2.
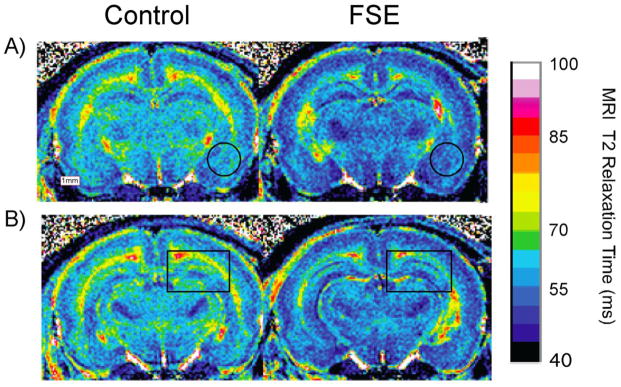
MRI T2 relaxation times are lower in FSE than control rats. A) The left side of the figure shows the MRI T2 relation time in a coronal section from the brain of a control animal at co-ordinates −2.3 mm AP. The area of the basolateral amygdala is indicated with a black circle. The right side shows the same scan for an FSE animal. Note the generally low T2 throughout the section and in the vicinity of amygdala; B) The left side of the figure shows T2 from the same animals as above at co-ordinates −2.6 mm AP. The area of the Hippocampus is indicated with a black rectangle. The right side shows the same scan for an FSE animal. Note the generally low T2 throughout the section and in the vicinity of the hippocampus.
MRI T2 levels predict cognitive outcome in FSE animals
MRI T2 relaxation times (ms) were measured in 13 FSE rats and 11 controls. Examples of color-transformed images are shown in Figure 2A and 2B. The images demonstrated that, on visual assessment, T2 times were lower throughout brain in the FSE animals when compared to normothermic controls. Confirming this observation, the average MRI T2 values in whole brain as well as all regions of interest (Figure 3A) were found to be lower in FSE rats than controls. This difference was significant in all but the prelimbic cortex following Bonferroni correction (∝/8) for multiple comparisons (see Table 1). Cox regression showed that there was no difference between FSE and control learners with regard to the number of training sessions to criterion (Figure 3B).
Figure 3.

MRI T2 relaxation time post-FSE is lower for febrile learners: A) The average and standard error of MRI T2 relaxation time from control rats (blue) and FSE rats (red) for all regions of interest and whole brain. The T2 levels were universally lower in FSE animals than control animals (Dhippo=dorsal hippocampus; BLA=basolateral amygdala; Mthal=medial thalamus; MEA=medial nucleus of the amygdala; Cblm=Cerebellum; Prlm Ctx=prelimbic cortex; Aud Ctx=auditory cortex; Brain=whole brain); B) Cox regression for control and FSE rats shows that there was no significant difference between the two groups with regard to the number of sessions to criterion; C) When separated into learners and non-learners, T2 levels were significantly lower in FSE learners than non-learners in the dorsal hippocampus, the basolateral amygdala and whole brain; Scatterplots of T2 relaxation time in the whole brain (D), hippocampus (E) and basolateral amygdala (F) for each individual rat in the FSE and CTRL group. Non-learners are indicated with a black circle. Febrile non-learners tend to have T2 levels that are above the average for FSE animals (red line) while there is no relationship between T2 levels and the average for control animals (blue line).
Table 1.
T-test results comparing MRI T2 values in each ROI and whole brain between control and FSE animals (df=22). After Bonferroni correction factor (∝/8= 0.006) only the Prelimbic cortex comparison is non-significant.
| Dhippo | BLA | Mthal | MEA | Cblm | Prlimbic Ctx | Aud Ctx | Brain | |
|---|---|---|---|---|---|---|---|---|
| T-Value | 4.3 | 5.2 | 5.9 | 3.8 | 5.3 | 2.8 | 4.2 | 5.1 |
| P-Value | 2.99 × 10⁻⁴ | 2.92 × 10⁻⁵ | 5.55 × 10⁻⁶ | 9.14 × 10⁻⁴ | 2.44 × 10⁻⁵ | 0.01 | 3.61 × 10⁻⁴ | 3.68 10−5 |
We wished to know if T2 time could reflect dynamic metabolic changes in response to prolonged seizure and predict cognitive outcome. To this end, we separated FSE rats into learners and non-learners. The average T2 time for FSE learners were significantly lower than non-learners (Figure 3C) in the whole brain (t(11)=3.4, p=0.005; MeanL= 54.98±0.21 ms, MeanNL=56.11±0.23 ms), basolateral amygdala (t(11)=2.7, p=0.018; MeanL= 53.39±0.25 ms, MeanNL=54.53±0.31 ms), and dorsal hippocampus (t(11)=2.6, p=0.025; MeanL= 55.72±0.33 ms, MeanNL=56.91±0.23 ms). The results of these t-tests are significant (see Table 2) following correction for multiple comparisons using the Holm-Bonferroni method (Holm, 1979). With regard to control animals, no relationship was found between T2 levels and the rat’s ability to learn the avoidance task.
Table 2.
T-test results showing significant differences in the comparison of MRI T2 values in whole brain, basolateral amygdala and dorsal hippocampus between FSE learners and non-learners (df=11). All 3 comparisons were found to be significant (p < adjusted ∝) following Holm-Bonferroni correction factor.
| Whole Brain | BLA | Dhippo | |
|---|---|---|---|
| T-Value | 3.4 | 2.7 | 2.6 |
| P-Value ranked from most to least significant | 0.005 | 0.018 | 0.025 |
| ∝ post Holm-Bonferroni Correction | ∝/3 = 0.017 | ∝/2 = 0.025 | ∝/1 = 0.05 |
Figure 4 shows scatterplots of T2 relaxation time in the whole brain (Figure 3D), hippocampus (Figure 3E) and basolateral amygdala (Figure 3F) for each individual rat in the FSE and CTRL group. FSE animals with T2 time that are above the average for this group tended to be non-learners while those with T2 levels below the average tended to be learners. Meanwhile, in the control animals, there is no apparent relationship between T2 levels relative to the group average and the ability to learn the task.
Figure 4.
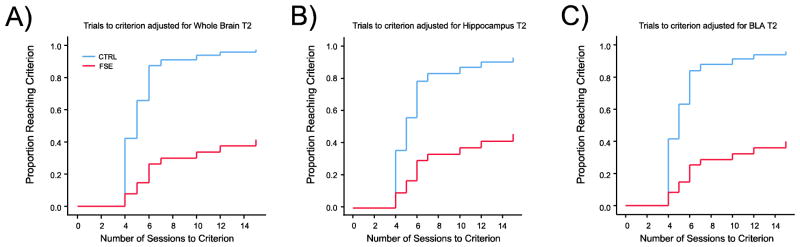
Cox regression survival analysis adjusted for T2 relaxation time in the whole brain (A), dorsal hippocampus (B) and basolateral amygdala (C). In all three cases analyses revealed that control rats were more likely to learn the task than FSE rats. For any given T2 relaxation time, control rats were better at avoiding the shock zone than FSE rats. Similar results were found for the dorsal hippocampus (B) and basolateral amygdala (C).
As we have shown that T2 relaxation time differs between groups, we therefore tested whether adjustment for T2 relaxation time could be used to predict whether an animal in each group would be a learner or non-learner. Repeating the Cox regression shown in figure 4B, but now including both group and T2 relaxation time as predictors of the time to reach criterion in the behavioral task, we found an inverse relationship between T2 and the probability of reaching criterion in FSE rats. Rats were less likely to learn the task (Hazard Ratio=0.31; p=0.008) for each 1 ms increase in whole brain T2 relaxation time. Whole brain T2 adjustments also revealed that control rats were more likely to learn the task (Hazard Ratio=6.8; p=0.02) than FSE rats (Figure 4A); i.e., if a control rat and an FSE rat both have a T2 relaxation time of, for example, 56 ms then the control rat is 6.8 times more likely to learn the task than the FSE rat. This confirms that the reduction in T2 relaxation time is an important predictor of the ability to learn the task.
Cox regression analyses also found that adjustments for T2 time in both the dorsal hippocampus (Figure 4B) and basolateral amygdala (Figure 4C) were informative. The likelihood of learning the task decreased with each 1 ms increase of T2 relaxation time in hippocampus (Hazard Ratio=0.47; p=0.013) and basolteral amygdala (Hazard Ratio=0.39; p=0.021). As in whole brain analysis, control rats were more likely to reach criterion than FSE rats following T2 adjustment in hippocampus (Hazard Ratio=4.4; p=0.037) and basolateral amygdala (Hazard Ratio=6.3; p=0.044).
Abnormal firing patterns in hippocampal cells of FSE non-learners
We next established whether there are alterations in neural networks subserving spatial performance by examining the firing field activity of hippocampal place cells of rats in each group. A total of 459 place cells were recorded from 7 control learners (n=219), 1 control non-learner (n=20), 3 FSE learners (n=121) and 3 FSE non-learners (n=99). Examples of place cells recorded from each group are shown in Figure 5. General estimating equations were used to analyze the firing field properties per individual rat and group. As place cells were obtained from only one rat in the control non-learner group, this group was excluded from analysis. However, results from this rat are provided. The analyses revealed significant group effects for in-field firing rate, field size, and coherence (Figure 6).
Figure 5.
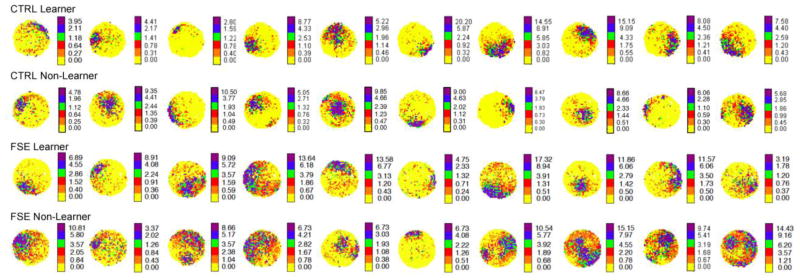
Examples of place cell firing fields from control learners (Top Row), a control non-learner (Second Row), FSE learners (Third Row) and FSE non-learners (Bottom Row). The firing fields of control and FSE learners were similar while the fields of FSE non-learners appeared to be larger and less circumscribed.
Figure 6.
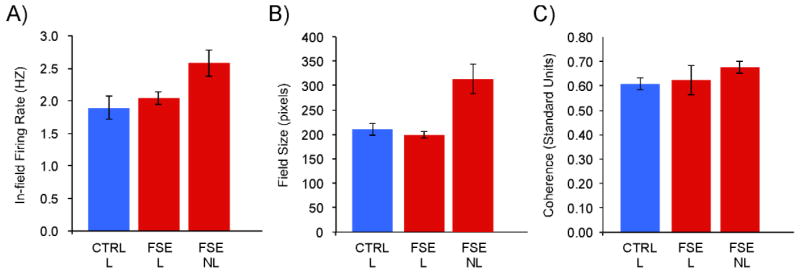
Average and standard error of firing field properties calculated per animal in each group. As place cells were recorded from only one rat in the control non-learner group, this group was not included from statistical analysis: A) In-field firing rate (Hz) per rat was significantly faster for firing fields recorded from FSE non-learners; B) Field size (pixels) per rat was significantly larger for firing fields recorded from FSE non-learners; C) While fields from FSE non-learners were more coherent than control learners, this can be accounted for by their higher firing rate and larger field size.
In-field firing rate (Hz)
While the average firing rates (Figure 6A) were similar for control (Mean=1.88 ± 0.18) and FSE learners (Mean=2.0 ± 0.1), the firing rates of place cells recorded from FSE non-learners (Mean=2.6 ± 0.21) were significantly higher (Wald Chi Square(1,2)=7.184, p = 0.028). Place cells from the control non-learner had a mean firing rate comparable to control and FSE learners (Mean=2.1 ± 0.2).
Field size (Pixels)
The average field size (Figure 6B) was similar for control (Mean=210.7 ± 12.37) and FSE learners (Mean=198.81 ± 6.70). The firing fields of place cells recorded from FSE non-learners (Mean=313.72 ± 30.0) were found to be significantly bigger (Wald Chi Square(1,2) = 20.27, p < 0.001) than those from both groups of learners. Place cells from the control non-learner had a mean field size comparable to control and FSE learners (Mean=206.6 ± 31.6).
Firing field coherence (Standard units)
Coherence is a measure of the local smoothness of the spatial firing rate distribution between neighboring pixels in the place cell’s firing field. Coherence values of firing fields from FSE learners (Mean=0.62 ± 0.06) were similar (Figure 6C) to both FSE non-learners (Mean=0.68 ± 0.024) and control learners (Mean=0.61 ± 0.023); p=0.125. Place cells from the control non-learner had a similar mean firing field coherence to the other groups (Mean=0.65 ± 0.059).
Interictal spikes in FSE animals
Analysis of hippocampal EEG signals from control rats (N=7) found no evidence of interictal spikes. However, several FSE animals (N=8) were found to have a high rate of interictal spiking (Mean=4.5 spikes/min ± 1.73). The lowest spike rate for an FSE animal was 0.04 spikes/min while the highest was 14 spikes/min. The presence of interictal spikes does not appear to account for group categorization: FSE learners (N=5; Mean=3.1 spikes/min ± 1.5); Non-learners (N=3; Mean=6.7 spikes/min ± 4.02).
Discussion
The current studies resulted in several important and novel findings: First, a subset of rats undergoing experimental FSE develops cognitive deficits whereas others were able to learn the active avoidance spatial task. The differences between these FSE subgroups correlate with both distinct measures of MR Imaging as well as with electrophysiological measures in one of the brain regions necessary for the performance of the task. Second, MR imaging within the first 24 hours following the insult discriminated between rats with cognitive problems and those that did not, providing an early, non-invasive and repeatable predictive marker potentially useful in intervention approaches to prevent the cognitive problems. The particularly novel finding is that the T2 values that were furthest away from the values of controls were found in the rats with no learning impairment. This strongly suggests that there is an adaptive process that is marked by the reduction in T2 relaxation time after FSE. Finally, electrophysiological analyses show that the efficacy of firing field activity in hippocampal place cells may ultimately reflect the lifelong changes in cognitive ability post FSE that may occur independently of epileptogenesis.
Separating learners from non-learners
Variability in cognitive outcome in children with a history of FSE is recognized in human populations. Some studies suggest normal outcomes (Annegers et al., 1987; Chang et al., 2001; Verity et al., 1998) while others suggest that some children with prolonged FS are at risk for long-term cognitive disturbances (Chang et al., 2001; Martinos et al., 2012). The reasons for these differences are currently uncertain, but an understanding of the pathophysiological processes that ultimately lead to negative cognitive effects could ultimately lead to novel ways to improve treatment of children with FSE.
The distribution of outcomes, in terms of learning to actively avoid the shock zone, reflects the continuum of cognitive outcomes seen in the clinic whereas many children with prolonged febrile seizures are totally normal while a small subset exhibit cognitive or developmental impairment (Chang et al., 2001; Hesdorffer et al., 2011; Martinos et al., 2012; Martinos et al., 2013). Although we used a different behavioral paradigm, our results resemble those of Dube et al. (Dube et al., 2009) who found a similar proportion of FSE rats that exhibited a cognitive impairment. The difference between the two subgroups of FSE animals in the current study appears to be more absolute as, by definition, the FSE non-learners were unable to learn the task even after liberal amounts of training. The reason for this difference may be due to duration of the inciting FS: in our study the duration of the experimental FS was over 30 mins, i.e., FSE, whereas seizure duration averaged 24 mins in Dube et al. (Dube et al., 2009). The longer duration of the febrile seizure was used as it more effectively models febrile status epilepticus in children (Lewis et al., 2013). Another possibility is the nature of the behavioral test used to assess spatial cognition in the rats. As opposed to the water maze, the active avoidance task is a systems-level task that requires co-ordination between different brain regions that allow for associating a region of space with an aversive stimulus. In addition, the task places greater demands on attention as the rat must regularly update its position in the room frame so as not to be moved into the shock zone (Kelemen and Fenton, 2010). The current electrophysiological and MRI results in our study also map well to prior studies using the active avoidance task where inactivation of the hippocampus (Cimadevilla et al., 2000) and basolateral amygdala (Vafaei et al., 2007) have shown these two structures to be necessary for task performance associating a fearful stimulus with a specific region of space. These studies further reinforce our notion that efficacy of these circuits, particularly the hippocampus, are important in determining the rat’s ability to learn the task.
Dynamic early MRI changes predict cognitive outcome
While previous studies have reported changes in MRI T2 relaxation times 1 month (Dube et al., 2009), 24 hours and 8 days (Dube et al., 2004) post FSE, the present study focused on an epoch within 120 mins of the febrile status event. We chose this period as we wanted to explore the brain’s early dynamic response to an FSE induced acute neural insult. Having experienced prolonged febrile seizures was not a sufficient predictor of cognitive outcome. However, the brain’s reaction to prolonged seizure, as measured by T2 relaxation time, was a strong predictor of cognitive outcome. Our results show that T2 time measured within two hours of experimental FSE predicted whether or not an FSE animal will be able to learn a spatial task. While T2 measures in the whole brain had the best predictive value, T2 time in the basolateral amygdala and the dorsal hippocampus were also good predictors. As T2 levels taken at the same time period in control animals do not predict the ability of control animals to learn the task, this can be taken as further indication that the brain’s reaction to febrile status lends predictive power with regard to cognitive outcome.
Previous studies evaluating the predictive value of T2 relaxation for adverse outcomes have identified increases in T2 relaxation time. These studies, in humans or rodents, have found transient increases in hippocampal T2 around 24–48h after FSE that are thought to reflect edema (Dube et al., 2004; Scott et al., 2002; VanLandingham et al., 1998). We imaged at 2 hours post FSE, which likely precedes T2 changes indicative of edema and revealed that T2 relaxation time lower than those typically seen in controls predicted a better cognitive outcome.
Our previous study indicated that decreased T2 relaxation times were associated with increased deoxyhemoglobin levels and an increase in the translocation of HMGB1, an early marker of inflammation (Choy et al., 2014). In comparison to lower resolution scans, high resolution scans (11.7T) results in shorter T2 relaxation times and increased sensitivity to deoxyhemoglobin, which is paramagnetic (Calamante et al., 1999; de Graaf et al., 2006; van Zijl et al., 1998). A lower T2 time, which is more often seen in FSE learners, therefore most likely represents increased deoxyhemoglobin in the absence of edema and reflects increased metabolic oxygen extraction in the period after SE. The upper range of T2 time in FSE animals overlap with the values of control animals. As shown in Cox Regression survival analysis, rats with higher T2 time are less likely to be able to learn the task. In this case T2 levels likely reflect decreased metabolic oxygen extraction. Notably, reduced T2 time in the amygdala-thalamus circuit, in the same time frame, was predictive of epilepsy (Choy et al., 2014). Thus, during the initial hours after FSE the different sequelae are distinct and involve different circuits; amygdala-thalamus for predicting epilepsy, and basolateral amygdala-hippocampus for predicting the ability to perform the active avoidance task. These results suggest that further investigation during this early period following FSE may be crucial in understanding the complex alterations in oxygen extraction and hemodynamics and how they may have life-long effects on limbic function.
The best predictor of cognitive outcome that we report is that of T2 relaxation time in the whole brain. This measure has the best potential as a translational finding for use in the clinic as it is a measure of metabolic effects in the entire brain rather than one region or one circuit, i.e. hippocampus-amygdala. It is premature to develop protocols for patients and unlikely that high resolution scans will be successfully made in close temporal proximity to the FSE event with children in the clinic. However, this result suggests that further experiments should be made with low-resolution scanners as close as possible to the FSE event. At the very least, it could provide clinicians and parents some prognostic value and may suggest a critical window of intervention post FSE that could prevent cognitive deficits for these children.
Place cells in FSE non-learners fired faster and had larger fields
Our interpretation of higher T2 levels in FSE animals as a reflection of potentially harmful processes post FSE that have negative outcomes for cognition later in life is significantly reinforced by abnormal firing activity of hippocampal cells in FSE non-learners. Place cells recorded from FSE non-learners were found to have both significantly larger firing fields and faster firing rates than those recorded from FSE learners or controls, indicating that place cells in the FSE non-learners are more excitable. This finding has several precedents as FSs have been found to result in persistent modifications of cell excitability in the hippocampus (Chen et al., 1999) that is likely unrelated to hippocampal cell loss (Bender et al., 2003; Dube et al., 2004; Toth et al., 1998). These modifications may lead to increased pyramidal cell excitability, decreased threshold to seizure (Dube et al., 2000) and decreases in the activity of hippocampal interneurons (Dube et al., 2009). While further research will be necessary to understand why place cells are made to be more excitable in FSE animals than animals in the other groups, the balance of excitation and inhibition does appear to correlate with the ability to learn the active avoidance task. This result therefore compliments the literature that suggests a link between hippocampal function, place cell firing field quality and spatial performance (Barnes et al., 1997; Cacucci et al., 2008; Lenck-Santini and Holmes, 2008; Liu et al., 2003; O’Keefe and Nadel, 1978). According to the O’Keefe and Nadel cognitive map hypothesis (O’Keefe and Nadel, 1978), place cells represent X and Y co-ordinates in a Cartesian plane that are then used to signal the animal’s position in space and guide spatial behavior. If the X and Y co-ordinates correspond to larger and more imprecise firing fields, the end result should be a less accurate cognitive map that can be applied toward spatial problem solving, such as remembering where in space the shock zone is located. Put simply, the FSE non-learners likely have a less efficient neural code for space.
Rate of interictal spikes was similar in FSE L and NL rats
We did not detect seizures during relatively brief, intermittent recording sessions, which is not surprising because seizures in the immature rodent model of TLE are sparse (Dube et al., 2006; Dube et al., 2010). Interictal spikes were common in the majority of FSE animals, and never seen in controls. This result confirms similar findings (Dube et al., 2006) that found interictal spikes in 88% of FSE animals over the course of long-term monitoring.
Conclusion
We report that MRI T2 levels measured within hours of FSE induction predicted cognitive outcome with regard to the ability to learn an active avoidance spatial task. FSE animals with the lowest T2 time in the whole brain measure, as well as the hippocampus and amygdala, were more likely to learn the task while those with T2 time similar to controls were less likely to learn the task. These findings demonstrate for the first time that dynamic metabolic responses to febrile status epilepticus, as measured by MRI T2 relaxation time, can predict which rats are at risk for permanent cognitive impairment. The results therefore suggest a systems level mechanism for both normal and impaired cognition resulting from acute neurological insults in early development that may be generalizable to other pediatric pathologies where cognitive outcomes are a concern.
Highlights.
We induced prolonged febrile seizures in an animal model of febrile status epilepticus (FSE).
Animals were imaged with a high resolution MRI within 2 hours of status epilepticus.
Animals with low MRI T2 relaxation times were most likely to learn an active avoidance task.
FSE animals that were unable to learn the avoidance task also had less precise place fields.
Results suggest a systems level mechanism that may improve cognitive outcomes post FSE.
Acknowledgments
We thank Molly Cornell and Andrew Alvarenga for assisting with electrode assembly. We also thank Kyle Jenks for assistance with rat handling and training. Funded by NIH grant R01HD057563 to GLH and TZB, R01NS073083 (GLH) and the Emmory R. Shapses Research Fund and Michael J. Pietroniro Research Fund.
Footnotes
We declare no conflicts of interest.
Publisher's Disclaimer: This is a PDF file of an unedited manuscript that has been accepted for publication. As a service to our customers we are providing this early version of the manuscript. The manuscript will undergo copyediting, typesetting, and review of the resulting proof before it is published in its final citable form. Please note that during the production process errors may be discovered which could affect the content, and all legal disclaimers that apply to the journal pertain.
References
- Annegers JF, Hauser WA, Shirts SB, Kurland LT. Factors prognostic of unprovoked seizures after febrile convulsions. N Engl J Med. 1987;316:493–498. doi: 10.1056/NEJM198702263160901. [DOI] [PubMed] [Google Scholar]
- Barnes CA, Suster MS, Shen J, McNaughton BL. Multistability of cognitive maps in the hippocampus of old rats. Nature. 1997;388:272–275. doi: 10.1038/40859. [DOI] [PubMed] [Google Scholar]
- Bassan H, Barzilay M, Shinnar S, Shorer Z, Matoth I, Gross-Tsur V. Prolonged febrile seizures, clinical characteristics, and acute management. Epilepsia. 2013;54:1092–1098. doi: 10.1111/epi.12164. [DOI] [PubMed] [Google Scholar]
- Bender RA, Dube C, Gonzalez-Vega R, Mina EW, Baram TZ. Mossy fiber plasticity and enhanced hippocampal excitability, without hippocampal cell loss or altered neurogenesis, in an animal model of prolonged febrile seizures. Hippocampus. 2003;13:399–412. doi: 10.1002/hipo.10089. [DOI] [PMC free article] [PubMed] [Google Scholar]
- Cacucci F, Yi M, Wills TJ, Chapman P, O’Keefe J. Place cell firing correlates with memory deficits and amyloid plaque burden in Tg2576 Alzheimer mouse model. Proc Natl Acad Sci U S A. 2008;105:7863–7868. doi: 10.1073/pnas.0802908105. [DOI] [PMC free article] [PubMed] [Google Scholar]
- Calamante F, Lythgoe MF, Pell GS, Thomas DL, King MD, Busza AL, Sotak CH, Williams SR, Ordidge RJ, Gadian DG. Early changes in water diffusion, perfusion, T1, and T2 during focal cerebral ischemia in the rat studied at 8.5 T. Magn Reson Med. 1999;41:479–485. doi: 10.1002/(sici)1522-2594(199903)41:3<479::aid-mrm9>3.0.co;2-2. [DOI] [PubMed] [Google Scholar]
- Chang YC, Guo NW, Wang ST, Huang CC, Tsai JJ. Working memory of school-aged children with a history of febrile convulsions: a population study. Neurology. 2001;57:37–42. doi: 10.1212/wnl.57.1.37. [DOI] [PubMed] [Google Scholar]
- Chen K, Baram TZ, Soltesz I. Febrile seizures in the developing brain result in persistent modification of neuronal excitability in limbic circuits. Nat Med. 1999;5:888–894. doi: 10.1038/11330. [DOI] [PMC free article] [PubMed] [Google Scholar]
- Choy M, Dube CM, Patterson K, Barnes S, Maras P, Blood A, Hasso A, Obenaus A, Baram TZ. A novel, noninvasive, predictive epilepsy biomarker with clinical potential. J Neurosci. 2014;34:8672–8684. doi: 10.1523/JNEUROSCI.4806-13.2014. [DOI] [PMC free article] [PubMed] [Google Scholar]
- Cimadevilla JM, Fenton AA, Bures J. Functional inactivation of dorsal hippocampus impairs active place avoidance in rats. Neurosci Lett. 2000;285:53–56. doi: 10.1016/s0304-3940(00)01019-3. [DOI] [PubMed] [Google Scholar]
- de Graaf RA, Brown PB, McIntyre S, Nixon TW, Behar KL, Rothman DL. High magnetic field water and metabolite proton T1 and T2 relaxation in rat brain in vivo. Magn Reson Med. 2006;56:386–394. doi: 10.1002/mrm.20946. [DOI] [PubMed] [Google Scholar]
- Dube C, Brunson KL, Eghbal-Ahmadi M, Gonzalez-Vega R, Baram TZ. Endogenous neuropeptide Y prevents recurrence of experimental febrile seizures by increasing seizure threshold. J Mol Neurosci. 2005;25:275–284. doi: 10.1385/JMN:25:3:275. [DOI] [PMC free article] [PubMed] [Google Scholar]
- Dube C, Chen K, Eghbal-Ahmadi M, Brunson K, Soltesz I, Baram TZ. Prolonged febrile seizures in the immature rat model enhance hippocampal excitability long term. Ann Neurol. 2000;47:336–344. [PMC free article] [PubMed] [Google Scholar]
- Dube C, Richichi C, Bender RA, Chung G, Litt B, Baram TZ. Temporal lobe epilepsy after experimental prolonged febrile seizures: prospective analysis. Brain. 2006;129:911–922. doi: 10.1093/brain/awl018. [DOI] [PMC free article] [PubMed] [Google Scholar]
- Dube C, Yu H, Nalcioglu O, Baram TZ. Serial MRI after experimental febrile seizures: altered T2 signal without neuronal death. Ann Neurol. 2004;56:709–714. doi: 10.1002/ana.20266. [DOI] [PMC free article] [PubMed] [Google Scholar]
- Dube CM, Ravizza T, Hamamura M, Zha Q, Keebaugh A, Fok K, Andres AL, Nalcioglu O, Obenaus A, Vezzani A, Baram TZ. Epileptogenesis provoked by prolonged experimental febrile seizures: mechanisms and biomarkers. J Neurosci. 2010;30:7484–7494. doi: 10.1523/JNEUROSCI.0551-10.2010. [DOI] [PMC free article] [PubMed] [Google Scholar]
- Dube CM, Zhou JL, Hamamura M, Zhao Q, Ring A, Abrahams J, McIntyre K, Nalcioglu O, Shatskih T, Baram TZ, Holmes GL. Cognitive dysfunction after experimental febrile seizures. Exp Neurol. 2009;215:167–177. doi: 10.1016/j.expneurol.2008.10.003. [DOI] [PMC free article] [PubMed] [Google Scholar]
- Epstein LG, Shinnar S, Hesdorffer DC, Nordli DR, Hamidullah A, Benn EK, Pellock JM, Frank LM, Lewis DV, Moshe SL, Shinnar RC, Sun S. Human herpesvirus 6 and 7 in febrile status epilepticus: the FEBSTAT study. Epilepsia. 2012;53:1481–1488. doi: 10.1111/j.1528-1167.2012.03542.x. [DOI] [PMC free article] [PubMed] [Google Scholar]
- Hesdorffer DC, Benn EK, Bagiella E, Nordli D, Pellock J, Hinton V, Shinnar S. Distribution of febrile seizure duration and associations with development. Ann Neurol. 2011;70:93–100. doi: 10.1002/ana.22368. [DOI] [PMC free article] [PubMed] [Google Scholar]
- Holm S. A Simple Sequentially Rejective Multiple Test Procedure. Scand J Stat. 1979;6:65–70. [Google Scholar]
- Huang CC, Wang ST, Chang YC, Huang MC, Chi YC, Tsai JJ. Risk factors for a first febrile convulsion in children: a population study in southern Taiwan. Epilepsia. 1999;40:719–725. doi: 10.1111/j.1528-1157.1999.tb00769.x. [DOI] [PubMed] [Google Scholar]
- Jansen JF, Lemmens EM, Strijkers GJ, Prompers JJ, Schijns OE, Kooi ME, Beuls EA, Nicolay K, Backes WH, Hoogland G. Short- and long-term limbic abnormalities after experimental febrile seizures. Neurobiol Dis. 2008;32:293–301. doi: 10.1016/j.nbd.2008.07.010. [DOI] [PubMed] [Google Scholar]
- Jenks KR, Lucas MM, Duffy BA, Robbins AA, Gimi B, Barry JM, Scott RC. Enrichment and training improve cognition in rats with cortical malformations. PLoS One. 2013;8:e84492. doi: 10.1371/journal.pone.0084492. [DOI] [PMC free article] [PubMed] [Google Scholar]
- Kelemen E, Fenton AA. Dynamic grouping of hippocampal neural activity during cognitive control of two spatial frames. PLoS Biol. 2010;8:e1000403. doi: 10.1371/journal.pbio.1000403. [DOI] [PMC free article] [PubMed] [Google Scholar]
- Kleen JK, Scott RC, Holmes GL, Lenck-Santini PP. Hippocampal interictal spikes disrupt cognition in rats. Ann Neurol. 2010;67:250–257. doi: 10.1002/ana.21896. [DOI] [PMC free article] [PubMed] [Google Scholar]
- Lenck-Santini PP, Holmes GL. Altered phase precession and compression of temporal sequences by place cells in epileptic rats. J Neurosci. 2008;28:5053–5062. doi: 10.1523/JNEUROSCI.5024-07.2008. [DOI] [PMC free article] [PubMed] [Google Scholar]
- Lewis DV, Shinnar S, Hesdorffer DC, Bagiella E, Bello JA, Chan S, Xu Y, Macfall J, Gomes WA, Moshe SL, Mathern GW, Pellock JM, Nordli DR, Jr, Frank LM, Provenzale J, Shinnar RC, Epstein LG, Masur D, Litherland C, Sun S. Hippocampal Sclerosis After Febrile Status Epilepticus: The FEBSTAT Study. Ann Neurol. 2013 doi: 10.1002/ana.24081. [DOI] [PMC free article] [PubMed] [Google Scholar]
- Liu X, Muller RU, Huang LT, Kubie JL, Rotenberg A, Rivard B, Cilio MR, Holmes GL. Seizure-induced changes in place cell physiology: relationship to spatial memory. J Neurosci. 2003;23:11505–11515. doi: 10.1523/JNEUROSCI.23-37-11505.2003. [DOI] [PMC free article] [PubMed] [Google Scholar]
- Martinos MM, Yoong M, Patil S, Chin RF, Neville BG, Scott RC, de Haan M. Recognition memory is impaired in children after prolonged febrile seizures. Brain. 2012;135:3153–3164. doi: 10.1093/brain/aws213. [DOI] [PMC free article] [PubMed] [Google Scholar]
- Martinos MM, Yoong M, Patil S, Chong WK, Mardari R, Chin RF, Neville BG, de Haan M, Scott RC. Early developmental outcomes in children following convulsive status epilepticus: a longitudinal study. Epilepsia. 2013;54:1012–1019. doi: 10.1111/epi.12136. [DOI] [PubMed] [Google Scholar]
- Muller RU, Kubie JL. The firing of hippocampal place cells predicts the future position of freely moving rats. J Neurosci. 1989;9:4101–4110. doi: 10.1523/JNEUROSCI.09-12-04101.1989. [DOI] [PMC free article] [PubMed] [Google Scholar]
- Muller RU, Kubie JL, Ranck JB., Jr Spatial firing patterns of hippocampal complex-spike cells in a fixed environment. J Neurosci. 1987;7:1935–1950. doi: 10.1523/JNEUROSCI.07-07-01935.1987. [DOI] [PMC free article] [PubMed] [Google Scholar]
- O’Keefe J, Nadel L. The hippocampus as a cognitive map. Clarendon Press; Oxford University Press; Oxford New York: 1978. [Google Scholar]
- Pastalkova E, Serrano P, Pinkhasova D, Wallace E, Fenton AA, Sacktor TC. Storage of spatial information by the maintenance mechanism of LTP. Science. 2006;313:1141–1144. doi: 10.1126/science.1128657. [DOI] [PubMed] [Google Scholar]
- Popp SS, Lei B, Kelemen E, Fenton AA, Cottrell JE, Kass IS. Intravenous antiarrhythmic doses of lidocaine increase the survival rate of CA1 neurons and improve cognitive outcome after transient global cerebral ischemia in rats. Neuroscience. 2011;192:537–549. doi: 10.1016/j.neuroscience.2011.06.086. [DOI] [PubMed] [Google Scholar]
- Robbins AA, Fox SE, Holmes GL, Scott RC, Barry JM. Short duration waveforms recorded extracellularly from freely moving rats are representative of axonal activity. Front Neural Circuits. 2013;7:181. doi: 10.3389/fncir.2013.00181. [DOI] [PMC free article] [PubMed] [Google Scholar]
- Scott RC, Gadian DG, King MD, Chong WK, Cox TC, Neville BG, Connelly A. Magnetic resonance imaging findings within 5 days of status epilepticus in childhood. Brain. 2002;125:1951–1959. doi: 10.1093/brain/awf202. [DOI] [PubMed] [Google Scholar]
- Scott RC, King MD, Gadian DG, Neville BG, Connelly A. Hippocampal abnormalities after prolonged febrile convulsion: a longitudinal MRI study. Brain. 2003;126:2551–2557. doi: 10.1093/brain/awg262. [DOI] [PubMed] [Google Scholar]
- Scott RC, King MD, Gadian DG, Neville BG, Connelly A. Prolonged febrile seizures are associated with hippocampal vasogenic edema and developmental changes. Epilepsia. 2006;47:1493–1498. doi: 10.1111/j.1528-1167.2006.00621.x. [DOI] [PubMed] [Google Scholar]
- Scott RC, Neville BG. Phenomenology of prolonged febrile seizures: results of the FEBSTAT study. Neurology. 2009;72:1532. doi: 10.1212/01.wnl.0000346721.34835.1e. author reply 1532–1533. [DOI] [PubMed] [Google Scholar]
- Shinnar S, Bello JA, Chan S, Hesdorffer DC, Lewis DV, Macfall J, Pellock JM, Nordli DR, Frank LM, Moshe SL, Gomes W, Shinnar RC, Sun S. MRI abnormalities following febrile status epilepticus in children: the FEBSTAT study. Neurology. 2012;79:871–877. doi: 10.1212/WNL.0b013e318266fcc5. [DOI] [PMC free article] [PubMed] [Google Scholar]
- Shinnar S, Hesdorffer DC, Nordli DR, Jr, Pellock JM, O’Dell C, Lewis DV, Frank LM, Moshe SL, Epstein LG, Marmarou A, Bagiella E. Phenomenology of prolonged febrile seizures: results of the FEBSTAT study. Neurology. 2008;71:170–176. doi: 10.1212/01.wnl.0000310774.01185.97. [DOI] [PubMed] [Google Scholar]
- Shinnar S, Pellock JM. Update on the epidemiology and prognosis of pediatric epilepsy. J Child Neurol. 2002;17(Suppl 1):S4–17. doi: 10.1177/08830738020170010201. [DOI] [PubMed] [Google Scholar]
- Staley KJ, Dudek FE. Interictal spikes and epileptogenesis. Epilepsy Curr. 2006;6:199–202. doi: 10.1111/j.1535-7511.2006.00145.x. [DOI] [PMC free article] [PubMed] [Google Scholar]
- Toth Z, Yan XX, Haftoglou S, Ribak CE, Baram TZ. Seizure-induced neuronal injury: vulnerability to febrile seizures in an immature rat model. J Neurosci. 1998;18:4285–4294. doi: 10.1523/JNEUROSCI.18-11-04285.1998. [DOI] [PMC free article] [PubMed] [Google Scholar]
- Vafaei AA, Jezek K, Bures J, Fenton AA, Rashidy-Pour A. Post-training reversible inactivation of the rat’s basolateral amygdala interferes with hippocampus-dependent place avoidance memory in a time-dependent manner. Neurobiol Learn Mem. 2007;88:87–93. doi: 10.1016/j.nlm.2007.02.004. [DOI] [PubMed] [Google Scholar]
- van Zijl PC, Eleff SM, Ulatowski JA, Oja JM, Ulug AM, Traystman RJ, Kauppinen RA. Quantitative assessment of blood flow, blood volume and blood oxygenation effects in functional magnetic resonance imaging. Nat Med. 1998;4:159–167. doi: 10.1038/nm0298-159. [DOI] [PubMed] [Google Scholar]
- VanLandingham KE, Heinz ER, Cavazos JE, Lewis DV. Magnetic resonance imaging evidence of hippocampal injury after prolonged focal febrile convulsions. Ann Neurol. 1998;43:413–426. doi: 10.1002/ana.410430403. [DOI] [PubMed] [Google Scholar]
- Verity CM, Greenwood R, Golding J. Long-term intellectual and behavioral outcomes of children with febrile convulsions. N Engl J Med. 1998;338:1723–1728. doi: 10.1056/NEJM199806113382403. [DOI] [PubMed] [Google Scholar]
- Yoong M, Martinos MM, Chin RF, Clark CA, Scott RC. Hippocampal volume loss following childhood convulsive status epilepticus is not limited to prolonged febrile seizures. Epilepsia. 2013;54:2108–2115. doi: 10.1111/epi.12426. [DOI] [PMC free article] [PubMed] [Google Scholar]
- Ziegler A, Kastner C, Blettner M. The generalised estimating equations: An annotated bibliography. Biometrical J. 1998;40:115–139. [Google Scholar]