

Abstract
Purpose
To compare the effects of uncorrected refractive error (URE) and non-refractive visual impairment (VI) on performance and disability measures.
Design
Cross-sectional population-based study.
Participants
2469 individuals with binocular presenting visual acuity (PVA) of 20/80 or better who participated in the first round of the Salisbury Eye Evaluation study.
Methods
URE was defined as binocular PVA of 20/30 or worse, improving to better than 20/30 with subjective refraction. VI was defined as post-refraction binocular best corrected visual acuity (BCVA) of 20/30 or worse. The visual acuity decrement attributable to VI was calculated as the difference between BCVA and 20/30 while that due to URE was taken as the difference between PVA and BCVA. Multivariable regression analyses were used to assess the disability impact of 1) vision status (VI, URE, or normal vision) using the group with normal vision as reference, and 2) a one-line decrement in acuity due to VI or URE.
Main Outcome Measures
Objective measures of visual function were obtained from timed performance of mobility and near vision tasks, self-reported driving cessation, and self-reported visual difficulty measured by the Activities of Daily Vision (ADV) scale. ADV responses were analyzed using Rasch analysis to determine visual ability.
Results
Compared to individuals with normal vision, subjects with VI (n=191) had significantly poorer objective and subjective visual functioning in all metrics examined (p<0.05) while subjects with URE (n=132) demonstrated slower walking speeds, slower near task performance, more frequent driving cessation and lower ADV scores (p<0.05), but did not demonstrate slower stair climbing or descent speed. For all functional metrics evaluated, the impact of VI was greater than the impact of URE. The impact of a one-line VA decrement due to VI was associated with greater deficits in mobility measures and driving cessation when compared to a one-line VA decrement due to URE.
Conclusions
VI is associated with greater disability than URE across a wide variety of functional measures, even in analyses adjusting for the severity of vision loss. Refractive and non-refractive vision loss should be distinguished in studies evaluating visual disability, and should be understood to have differing consequences.
Introduction
Globally, 285 million individuals are estimated to have decreased vision, with approximately half due to uncorrected refractive error (URE).1 In the United States (US) alone, the annual cost of correcting refractive error (RE) has been estimated at between $3.9 and $7.2 billion,2 with much higher costs likely associated with treatment and prevention of non-refractive causes of vision loss.3 While it is clear that both types of vision loss are frequent,3 the relative effort that should be devoted to addressing each depends on the extent to which they confer disability and the relative costs of treatment.
In analyzing disability due to vision loss, previous studies have used a wide range of definitions for what represents vision loss. Several studies have focused purely on individuals with URE, and have reported associations of URE with subjective measures of disability. These groups have shown decreased self-reported visual function in all types of RE,4 including uncorrected myopia,5 uncorrected hyperopia, and astigmatism.6 Correction of RE has also been shown to lead to improved self-reported function in children7 and adults.8
Other groups have examined the association between visual functioning and quality of life and decreased vision specifically due to non-refractive causes. These studies have documented lower self-reported visual function,4, 9 decreased health-related quality of life, 10, 11 diminished independence,4, 12 slower gait speed,13 and increased likelihood of falls, 4, 13, 14 fractures, 13, 14 and institutional placement.14 Several other groups have evaluated visual functioning and quality of life associated with decreased vision from any cause (refractive or non-refractive) as determined by a person's presenting visual acuity (PVA). Decreased PVA has been associated with impaired task performance,15 more falls,16 greater subjective difficulty with visual tasks,17-20 and lower quality of life.18, 19, 21
The variety of approaches taken in these studies suggests a lack of consensus on the relative implications of vision-related disability conferred by refractive and non-refractive vision loss. Surprisingly, only a few studies have compared the impact of both refractive and non-refractive vision loss on function and/or quality of life.4, 11, 17, 19, 21, 22 Some population studies have demonstrated minimal functional impairment in URE, 4, 11, 17, 19, 22 though one Mexican-American population demonstrated similar functional impairment in both URE-related and non-refractive vision loss.21 The limitations of these few studies include: (1) failure to account for visual acuity (VA) differences in the groups with URE-related and non-refractive vision loss, (2) use of subjective measures of ability and quality of life with limited examination of objective measures of functional ability, and (3) an overemphasis on aggregate measures of disability instead of separate assessment of disability within specific functional domains.
The Salisbury Eye Evaluation (SEE) is a population-based study of older Americans that offers a unique opportunity to compare disability from URE and non-refractive vision loss such that the limitations stated above are addressed. The SEE study evaluated a broad range of subjective and objective measures of vision-related ability within several functional domains. Here we compared the affect of URE and non-refractive visual impairment (VI), defined as decreased vision not due to URE, on these metrics of disability in order to understand the relative impact of these two types of vision loss.
Methods
Population
The analyzed population was derived from the SEE project, a population-based study relating visual impairment and eye disease to functional status in community dwelling adults.15, 23 Characteristics of this population have been described elsewhere.24 Data was obtained from the first round of this longitudinal study, which examined subjects aged 65 to 84 years between 1993 and 1995. The study protocol was approved by the Johns Hopkins University Institutional Review Board and written informed consent was obtained from all study participants.
Evaluation of Vision
Distance VA was measured with backlit Early Treatment Diabetic Retinopathy Study (ETDRS) charts using a standard forced choice procedure. Binocular VA was first measured with the subjects' presenting correction, if any, to obtain PVA. Right and left eye presenting acuities were also assessed and subjective refraction performed to obtain BCVA in the eye(s) with 20/30 or worse vision. This was followed by measurement of binocular BCVA. All scores were converted to a logarithm of the minimum angle of resolution (logMAR) scale, as previously described.25
For this study, individuals whose binocular PVA was better than 20/30 were considered to have normal vision, reflecting the fact that SEE participants were refracted in eyes seeing worse than 20/30. Subjects were considered to have URE if their binocular PVA was worse than or equal to 20/30 but improved to better than 20/30 after subjective refraction. Individuals with binocular PVA and BCVA worse than or equal to 20/30 were considered to have VI. The degree of vision loss (defined by PVA) was sub-classified as: (1) worse than or equal to 20/30 but better than or equal to 20/80 and (2) worse than 20/80. To minimize the potential effect of group differences in visual acuity on outcome measures and since all individuals with VA worse than 20/80 belonged to the VI group, all analyses were restricted to individuals with PVA better than or equal to 20/80. As a result, 51 individuals with PVA worse than 20/80 were omitted.
In order to compare the impact of one line of URE-associated or VI-associated vision loss, the degree of VA decrement attributable to each was calculated for all subjects. Decrease in vision attributable to VI was taken as the difference between BCVA and 20/30 (logMAR 0.176), and subjects with BCVA better than 20/30 were assigned value of 0. Decreased vision attributable to URE was calculated as the difference between PVA and BCVA. If BCVA and/or PVA were better than 20/30, a value of 0 logMAR units was assigned for the respective value(s). Fifty-one individuals with decreased vision attributable to both URE and VI were excluded from these analyses.
Outcome Measures
Driving cessation, self-reported visual function, and objective measurement of task speed or performance were all evaluated as outcomes.
Driving habits were obtained from questionnaires as previously described.26 Subjects who reported no longer driving in the previous 12 months were considered to have stopped driving while subjects who had never driven were excluded from analysis (N=172).
Self-reported visual function was obtained using the Activities of Daily Vision (ADV) questionnaire as previously described.20 Participants scored their level of difficulty on a scale of one to 5 (one being the most severe difficulty and 5 being no difficulty at all) in performing 21 vision-related activities. Participants who had not done a particular activity (not due to vision) in the previous 3 months were not scored on that activity.27
Objective measures of ability were derived from timed performance on mobility and near vision tasks. Mobility measures included speed of climbing 7 steps (steps/second), descending 7 steps, and walking on a straight, flat 4-meter course (meters/second).15 Near vision task measures included the time it took participants to insert a plug into a socket, dial a number on a rotary telephone, or insert a key into a lock (seconds).15 Reading speed was evaluated by asking participants to read out loud a short passage as quickly as possible from text presented on a computer screen. Number of words read correctly in 15-second intervals was used to calculate reading speed per minute. For this analysis, only reading speed of newspaper-sized text (0.260) was used.
Statistical Analysis
Global differences among the three groups in continuous and categorical demographic variables were evaluated by ANOVA and chi-squared analysis respectively. This was complemented by pair-wise comparisons of the groups using two-tailed t-tests and chi-squared tests. The association between functional measures and vision were assessed using two sets of models: (1) group analysis with subjects categorized as normal vision, URE or VI, using the group with normal vision as reference, and (2) continuous analyses using a VA decrement (a 0.1 logMAR increment) attributable to VI and URE (calculated as described above) within the same model.
Rasch analysis of the ADV questionnaire data was performed using Winsteps (Winsteps 3.80.1, Chicago, IL). For all ADV items, participant responses were collapsed from the original five categories to three, collapsing “little difficulty” and “moderate difficulty” categories into one and “extreme difficulty” and “unable to perform task because of vision” into another. Linear item measure scores for each task, representing each task's visual difficulty, were calculated using the responses of persons with VI and URE. Differential item functioning (DIF) analysis was performed on the two study groups, VI and URE, to investigate item bias. Item measures were validated by comparison to the item measures generated from a prior investigation of visual functioning questions, including the ADV, in low vision patients.28 Correlating our item measures to the item measures generated by Rasch analysis of ADV responses in the above mentioned cohort of low vision patients revealed a Pearson correlation coefficient of 0.85, indicating similar calibration.28 Item measures and category thresholds were then anchored and used to calculate linear person measure scores for all persons in this study (including those with normal vision), representing the person's visual ability. Person measure scores are expressed as log-odds units (logits) on a single scale. Higher person measures corresponded to more self-reported ability.
Linear regression was used to analyze continuous outcomes and logistic regression was used to analyze driving cessation. In order to minimize the contribution of extreme high and low values on regression models of Rasch person-measure scores, a weighted least squares regression model was used to look at the association between vision and the Rasch-derived person measures. Each subject's person measure was weighted as the inverse of the squared standard error estimate (Fisher information).
All outcomes were adjusted for age, race, gender, education, cognitive ability, number of comorbid illnesses,15 and presence of any depressive symptoms. Additionally, all outcomes except reading speed were adjusted for grip strength (a marker for frailty) and mobility parameters were also adjusted for body mass index (BMI). All continuous independent variables included in the above regression models were centered about their mean values. Post-hoc estimation of power was conducted by two-sample comparison of means using one mobility measure (walking speed) and one reading measure (reading speed). Using known sample sizes, means and standard deviations and a p value of 0.05 yielded power of 0.975 and 0.998 to detect a 5 m/min difference in walking speed in URE vs. normal vision and VI vs. normal vision groups respectively. Similarly, calculated power to detect a 20 words/min difference in reading speed reading speed was 0.880 and 0.985 and for URE vs. normal vision and VI vs. normal vision groups respectively. All analyses were performed using Stata version 12 (StataCorp), with graphing performed in R.29
Results
Of the 2469 subjects with PVA better than or equal to 20/80, 132 (5.4%) had decreased acuity from URE and 191 (7.8%) had decreased acuity from VI. Group differences amongst subjects with normal vision, URE and VI were observed with respect to age, education, cognition, the presence of depressive symptoms and the number of comorbid medical conditions (p<0.05) (Table 1). Pair-wise analyses demonstrated that, compared to those with URE, individuals with VI were older (p=0.003) and had a larger number of comorbid medical conditions (p=0.04). The mean binocular PVA for the VI group was roughly a half-line worse than the URE group (0.32 ± 0.12 vs. 0.26 ± 0.07 logMAR, p<0.01).
Table 1. Characteristics of SEE participants by vision status.
| Characteristic | Normal vision* (N=2146) | Uncorrected Refractive† Error (N=132) | Visual Impairment‡ (N=191) | p§ |
|---|---|---|---|---|
| Age, mean (SD) | 73.1 (4.9) | 74.9 (5.2) | 76.7 (5.5) | <0.01 |
| Male, % | 42.8 | 40.9 | 32.5 | 0.06 |
| African American, % | 25.3 | 30.3 | 34.0 | 0.05 |
| Last Grade Completed, mean (SD) | 11.4 (3.3) | 10.2 (3.6) | 10.1 (3.8) | <0.01 |
| MMSE score, mean (SD) | 27.4 (2.5) | 26.5 (2.9) | 26.1 (3.1) | <0.01 |
| Presence of any depressive symptoms, % | 9.2 | 12.1 | 18.9 | <0.01 |
| Number of comorbid conditions, mean (SD) | 2.4 (1.6) | 2.4 (1.7) | 2.7 (1.7) | <0.01 |
Binocular presenting visual acuity better than 20/30
Binocular presenting visual acuity worse than or equal to 20/30 but improving to better than 20/30 with subjective refraction
Binocular presenting and best correct visual acuity worse than or equal to 20/30
p<0.05 taken as significant
MMSE = Mini-Mental Status Exam; SD = standard deviation
In multivariable analyses, individuals with VI completed all mobility tasks significantly slower than subjects with normal vision, while subjects with URE were slower than subjects with normal vision in walking speed only (Table 2, Figure 1A-C). As compared to subjects with normal vision, individuals with vision loss due to either URE or VI demonstrated slower near vision task performance (Table 2), though the magnitude of the performance decrement was consistently greater in subjects with VI (Figure 1D-G). The average task performance times for subjects with normal vision are reported in Table 2, estimated as the intercept value for each multivariable regression model. All continuous covariates were centered about their mean values to derive the intercepts for each regression model.
Table 2. Multivariate analyses of uncorrected refractive error and non-refractive visual impairment on objective measures of functional ability.
| Uncorrected Refractive Error | Visual Impairment | ||||
|---|---|---|---|---|---|
| Outcome parameter | Intercept (95% CI) | Δ in outcome compared with subjects with normal vision (95% CI)‡ | p§ | Δ in outcome compared with subjects with normal vision (95% CI)‡ | p§ |
| Mobility | |||||
| Walking speed (m/min)* | 47.5 (46.4, 48.5) | -2.6 (-4.6, -0.6) | 0.01 | -3.5 (-5.3, -1.7) | <0.01 |
| Stairs, climb speed (steps/min)* | 50.7 (49.5, 51.9) | 0.7 (-1.5, 2.9) | 0.54 | -3.0 (-4.9, -1.0) | <0.01 |
| Stairs, descent speed (steps/min)* | 47.3 (46.1, 48.6) | 1.00 (-1.4, 3.4) | 0.42 | -5.0 (-7.2, -2.9) | <0.01 |
| Near Tasks | |||||
| Plug insertion time (s)† | 8.4 (8.0, 8.8) | 0.9 (0.2, 1.6) | 0.01 | 3.3 (2.7, 3.9) | <0.01 |
| Key insertion time (s)† | 14.9 (14.3, 15.4) | 1.3 (0.2, 2.4) | 0.02 | 3.1 (2.1, 4.1) | <0.01 |
| Dial telephone no. time (s)† | 9.0 (8.7, 9.3) | 1.0 (0.4, 1.7) | <0.01 | 1.8 (1.2, 2.3) | <0.01 |
| Reading Speed (wpm)* | 141.3 (136.9, 145.8) | -61.1 (-70.0, -52.3) | <0.01 | -90.0 (-97.8, -82.3) | <0.01 |
Change in outcome parameters predicted by vision status as compared with those with normal vision.
Increased difficulty with these mobility and reading tasks expressed as decreased speed (negative coefficient)
Increased difficulty with these near tasks expressed as increased time (positive coefficient).
All outcomes adjusted for age, race, gender, education, cognitive ability, number of comorbid illnesses, and presence of depressive symptoms. All outcomes except reading speed also adjusted for grip strength and mobility parameters also adjusted for body mass index.
All continuous covariates were centered about their mean values to derive the intercepts for each regression model. Intercepts estimate average task performance times for subjects with normal vision.
Δ = change, CI = confidence interval, m = meters, min = minute, s = seconds, wpm = words per minute
p<0.05 taken as significant
Figure 1.
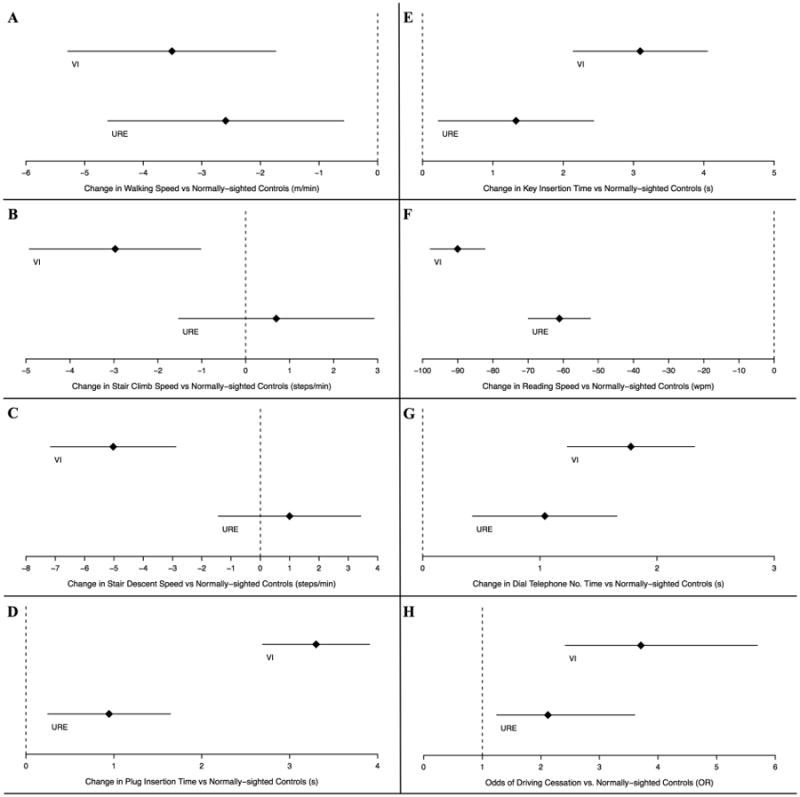
Comparison of objective and subjective measures of visual disability by vision status among Salisbury Eye Evaluation participants. Analysis performed for all subjects with a binocular presenting visual acuity (PVA) better than or equal to 20/80. Diamonds represent regression coefficients [A-G] and odds ratios (OR) [H] from multivariable regression models comparing the given disability measure outcomes in individuals with either visual impairment (VI - top line in each panel) or uncorrected refractive error (URE – bottom line in each panel) with controls. Lines extending to the left and right of diamonds represent the 95% confidence intervals. Increased difficulty with mobility [A-C] and reading [G] tasks expressed as decreased speed (negative coefficient) while increased difficulty with near tasks [D-F] expressed as increased time (positive coefficient).
* m = meters, min = minute, s = seconds, wpm = words per minute
Worse vision due to URE and VI were both associated with a greater likelihood of driving cessation as compared to those with normal vision, with even higher odds of driving cessation noted for subjects with VI (OR 2.1, 95% CI 1.3- 3.6 for URE vs normal vision and OR 3.7, 95% CI 2.4- 5.7 for VI vs normal vision) (Figure 1H).
To account for the slightly worse visual acuities in subjects with VI compared with individuals with URE, additional multivariable regression models were run to assess the disability impact of a one-line (0.1 logMAR) decrement in VA attributable to URE and VI (Figure 2, Tables 3). The average task performance times for subjects without VI and URE associated vision loss are reported in Table 3, estimated as the intercept value for each multivariable regression model. Each one-line decrement in acuity due to VI was significantly associated with slower completion of walking and stair descent mobility tasks but was not significantly associated with stair climbing task speed. The same decrement in vision attributable to URE was associated with slower walking speed, but not other measures of mobility (Table 3, Figure 2A-C). A one-line decrement in VA due to either URE or VI was associated with similar decrease in performance on all near vision tasks except for plug insertion time (Table 3) where VI-related vision loss conferred slower task completion time (Figure 2D-G).
Figure 2.
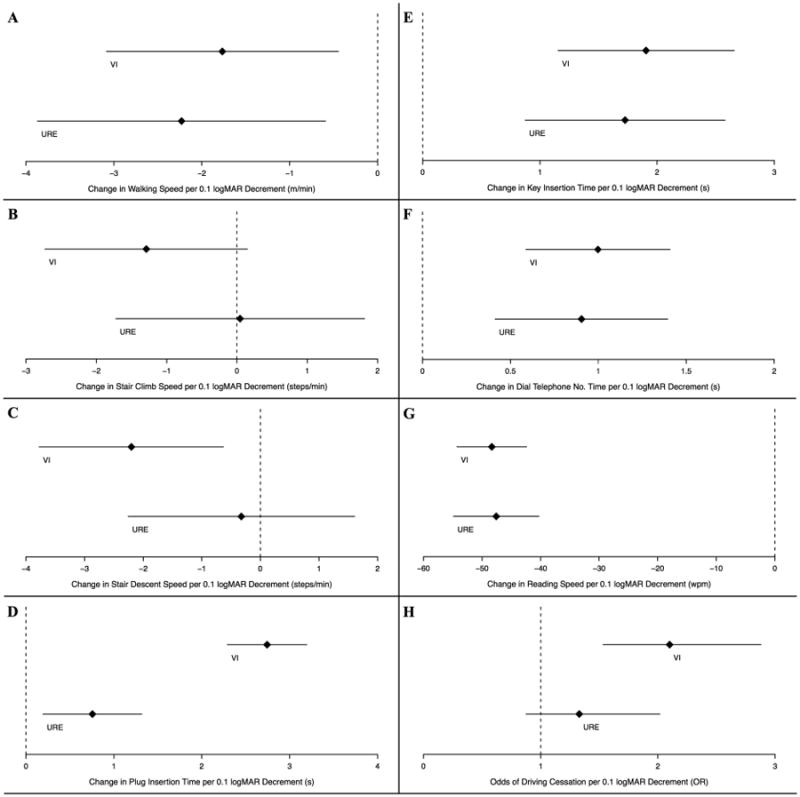
Comparison of objective and subjective measure of visual disability associated with a one-line decrement in visual acuity (VA) among Salisbury Eye Evaluation participants. Analysis performed for all subjects with a binocular presenting visual acuity (PVA) better than or equal to 20/80. Diamonds represent regression coefficients [A-G] and odds ratios (OR) [H] from multivariable regression models comparing the given disability measure outcomes in VA decrement attributable to either visual impairment (VI - top line in each panel) or uncorrected refractive error (URE - bottom line in each panel). Lines extending to the left and right of diamonds represent the 95% confidence intervals. Increased difficulty with mobility [A-C] and reading [G] tasks expressed as decreased speed (negative coefficient) while increased difficulty with near tasks [D-F] expressed as increased time (positive coefficient).
* m = meters, min = minute, s = seconds, wpm = words per minute
Table 3. Multivariable analyses examining the associations between a one-line (0.1 logMAR) decrement in visual acuity due to uncorrected refractive error or non-refractive visual impairment and objective measures of functional ability.
| Uncorrected Refractive Error | Visual Impairment | ||||
|---|---|---|---|---|---|
| Outcome parameter | Intercept (95% CI) | Δ in outcome per 0.1 logMAR decrement in VA (95% CI)‡ | p§ | Δ in outcome per 0.1 logMAR decrement in VA (95% CI)‡ | p§ |
| Mobility | |||||
| Walking speed (m/min)* | 47.4 (46.3, 48.5) | -2.2 (-3.9, -0.6) | <0.01 | -1.8 (-3.1, -0.4) | <0.01 |
| Stairs, climb speed (steps/min)* | 50.8 (49.6, 52.0) | 0.0 (-1.7, 1.8) | 0.96 | -1.3 (-2.7, 0.2) | 0.08 |
| Stairs, descent speed (steps/min)* | 47.4 (46.1, 48.7) | -0.3 (-2.3, 1.6) | 0.74 | -2.2 (-3.8, -0.6) | <0.01 |
| Near Tasks | |||||
| Plug insertion time (s)† | 8.4 (8.0, 8.7) | 0.8 (0.2, 1.3) | <0.01 | 2.7 (2.3, 3.2) | <0.01 |
| Key insertion time (s)† | 14.6 (14.0, 15.1) | 1.7 (0.9, 2.6) | <0.01 | 1.9 (1.2, 2.7) | <0.01 |
| Dial telephone no. time (s)† | 9.0 (8.7, 9.3) | 0.9 (0.4, 1.4) | <0.01 | 1.0 (0.6, 1.4) | 0.01 |
| Reading Speed (wpm)* | 139.1 (134.6, 143.5) | -47.5 (-54.9, -40.3) | <0.01 | -48.3 (-54.3, -42.4) | <0.01 |
Change in outcome parameters due to decreased vision attributable to uncorrected refractive error and non-refractive visual impairment was determined by excluding participants with both refractive and non-refractive causes of vision loss from the model (N=51).
Increased difficulty with these mobility and reading tasks expressed as decreased speed (negative coefficient)
Increased difficulty with these near tasks expressed as increased time (positive coefficient).
All outcomes adjusted for age, race, gender, education, cognitive ability, number of comorbid illnesses, and presence of depressive symptoms. All outcomes except reading speed also adjusted for grip strength and mobility parameters also adjusted for body mass index.
All continuous covariates were centered about their mean values to derive the intercepts for each regression model. Intercepts estimate average task performance times for subjects without VI and URE.
Δ = change, CI = confidence interval, m = meters, min = minute, s = seconds, wpm = words per minute, VA = visual acuity
p<0.05 taken as significant
In multivariable models, a one-line (0.1 logMAR) decrement in VA due to VI was associated with greater odds of driving cessation (OR 2.1, 95% CI 1.5, 2.9), while no significant association was noted for the same decrement in acuity due to URE (OR 1.3, 95% CI 0.9 -2.0) (Figure 2H).
ADV ability was estimated using Rasch analysis. DIF analysis showed that all items scaled similarly for those with URE and VI, indicating no substantial item bias. To determine the validity of applying the Rasch model, infit z-scores were calculated for each ADV item. There was good fit for all items (z-score ≤2.30 for all) with the exception of two items “seeing moving objects while driving at night” and “driving at night with oncoming headlights” – these were excluded from further analysis (infit z statistic 7.54 and -2.77, respectively).
In weighted least squares regression modeling, as compared to subjects with normal vision, individuals with URE and individuals with VI both demonstrated less self-reported visual ability, with a lower decrement in visual ability associated with URE as compared to VI (β -0.30 logits, 95% CI -0.40 to -0.20, p<0.001 and β -0.83 logits, 95% CI -0.94 to -0.72, p<0.001 respectively) (Figure 3A). A 0.1 logMAR decrement in VA due to both URE and VI was also associated with less self-reported ability on ADV-defined visual tasks (β -0.30 logits, 95% CI -0.38 to -0.23, p<0.001 and β -0.30 logits, 95% CI -0.41 to -0.18, p<0.001 respectively) (Figure 3B).
Figure 3.
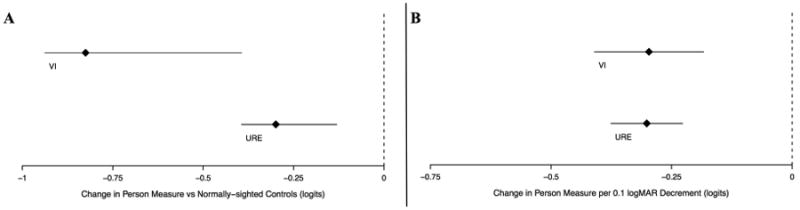
Comparison of Rasch-estimation of subjective ability using ADV questions among Salisbury Eye Evaluation participants. Analysis performed for all subjects with a binocular presenting visual acuity (PVA) better than or equal to 20/80. Diamonds represent regression coefficients from multivariable regression models comparing [A] individuals with either visual impairment (VI - top line in each panel) or uncorrected refractive error (URE – bottom line in each panel) with controls and [B] a VA decrement attributable to either VI or URE. Lines extending to the left and right of diamonds represent the 95% confidence intervals. Increased difficulty is expressed as negative coefficient β in logits.
Discussion
This population-based sample of older Americans demonstrates substantial differences in vision-related disability attributable to URE and VI-related vision loss. Compared to those with normal vision, individuals with VI demonstrated significant impairment in all objective measures of mobility, near vision tasks, driving, and self-reported visual function. In contrast, those with URE had difficulty with driving, performing near vision tasks and self-reported visual function with less consistent mobility impairment. Even in domains where both VI and URE subjects differed from subjects with normal vision, the relative impact of VI on disability was considerably greater than that for URE. Observed differences were not simply the result of differences in the level of acuity in the VI and URE groups, as the disability impact of a one-line change in VA due to VI often exceeded that of URE. Our findings demonstrate that the type of vision loss (URE versus VI) has a profound impact on functional ability, and suggest that refractive and non-refractive vision loss should be distinguished when evaluating the association between vision and disability.
The differential impact of VI and URE was particularly notable with regards to mobility measures. VI-related vision loss was associated with greater impairment in mobility than URE-related vision loss in all group analyses and also stair climbing and descent speeds (but not walking speed) in analyses evaluating the impact of a one-line VA decrement due to either VI or URE. These results are consistent with prior findings from the National Health and Nutrition Examination Survey (NHANES), in which VI was associated with almost 50% less physical activity than in individuals with URE.30 Impaired mobility in individuals with VI may be due to their decrease in contrast sensitivity, which can lead to specific problems such as detecting edges,31 and thus navigation difficulty.32-37 The observed difference in mobility could also be related to balance and fear of falling. VI 38 and decreased contrast sensitivity, but not refractive error, 39 have been shown to reduce postural stability. This may explain why the magnitude of the association between a one-line VA decrement from VI was greater than the same decrement from URE on stair tasks requiring edge detection and balance, but this difference in the association was not observed on the 4 meter walking task where edge detection and balance are less critical.
In contrast to mobility task performance, both VI and URE were associated with poorer performance on tasks of near vision. While those with VI exhibited slower near vision task completion compared to those with normal vision, the magnitude of task performance impairment conferred by 0.1 logMAR decrement in vision by both VI and URE were largely similar. However, the slower reading speed associated with refractive vision loss may partly reflect the tendency of poor readers to less frequently correct their RE, leaving open the possibility that URE and VI do affect reading to differing extents.
Individuals with either URE or VI were more likely to have stopped driving when compared to those with normal vision, though the odds of driving cessation due to VI was nearly twice that conferred by URE. In addition, 0.l logMAR decrease in vision attributable to VI, but not URE, was significantly associated with driving cessation. These findings are in accordance with work by Wood and colleagues, which found that simulated non-refractive VI imparted greater limitation in night driving than simulated refractive error, independent of VA.40 It is surprising that individuals with URE may be making a life change as significant as driving cessation as a result of an easily correctable limitation. As with reading speed, it is possible that the observed relationship between URE and driving cessation is bidirectional and that individuals who have stopped driving are less in need of, and therefore less likely to obtain, up-to-date refractive correction.
Though both URE and VI were associated with decreased self-reported visual ability as reflected by Rasch-derived ADV person-measure scores, the magnitude of self-reported difficulty was greater in VI than in URE in group analyses. However this finding should be interpreted with caution as our analyses assessing the impact of a 0.1 logMAR decrement in VA failed to confirm this result. Most studies that have previously compared the association between URE and VI and self-reported visual function have reported milder impact of URE on various vision specific quality of life instrument scores compared to VI.17, 19, 21, 22 Though one study reported similar functional difficulty in both URE-related and cataract-related vision loss,21 this was not the case in others.17, 19 These studies failed to compare similar levels of VA amongst URE and VI groups, allowing for the possibility that differences were attributable to the degree of vision loss in these groups.
Limitations of this study include the fact that we were unable to consistently identify the causes of non-refractive vision loss in our population and thus could not differentiate between specific eye diseases. Additionally, as previous studies suggest,17, 21, 41 there may be differential impact of the types of refractive error and disability, though this was not studied. The SEE project did not measure near vision, and distance visual acuity deficits may not fully capture difficulty with near vision tasks. Due to the cross-sectional design it was not possible to decipher the bidirectional causality that may partially explain the association between URE and reading speed and driving cessation observed in this study. Strengths of the study include a large, population-based sample, which is likely to be representative of older Americans. In addition, our study is unique in its rigor as we assessed both subjective and objective measures of function and used a validated Rasch analytical method to determine that overall visual ability.
In summary, a similar decrement in vision due to URE and VI has considerably different associations with visual functioning. Even at relatively modest levels of vision loss, VI results in a consistently poorer objective and subjective visual functioning compared to URE. Our results suggest that decreased vision due to URE may be fundamentally different from that due to ocular disease. Therefore, the types of vision loss should be defined and classified when relating vision to disability. In addition, given the disability conferred by modest visual loss due to non-refractive causes, this study highlights the need for early detection and treatment of ocular disease and increased vision and physical rehabilitation efforts in individuals with VI. Further studies may help elucidate the full extent of disability conferred by decreased vision due to refractive and non-refractive causes.
Non-refractive visual impairment more strongly impacted mobility, near task performance, driving cessation, and self-reported visual function than uncorrected refractive error after adjusting for the severity of vision loss.
Acknowledgments
Financial Support: This work was supported by NIH grants EY01765, AG10184, EY015025, and the Research to Prevent Blindness Special Scholar Award. The funding organizations had no role in the design or conduct of this research.
Footnotes
Conflict of interest: No conflicting relationship exists for any author.
Publisher's Disclaimer: This is a PDF file of an unedited manuscript that has been accepted for publication. As a service to our customers we are providing this early version of the manuscript. The manuscript will undergo copyediting, typesetting, and review of the resulting proof before it is published in its final citable form. Please note that during the production process errors may be discovered which could affect the content, and all legal disclaimers that apply to the journal pertain.
References
- 1.Pascolini D, Mariotti SP. Global estimates of visual impairment: 2010. Br J Ophthalmol. 2012;96:614–8. doi: 10.1136/bjophthalmol-2011-300539. [DOI] [PubMed] [Google Scholar]
- 2.Vitale S, Cotch MF, Sperduto R, Ellwein L. Costs of refractive correction of distance vision impairment in the United States, 1999-2002. Ophthalmology. 2006;113:2163–70. doi: 10.1016/j.ophtha.2006.06.033. [DOI] [PubMed] [Google Scholar]
- 3.Taylor HR. LXIII Edward Jackson Memorial Lecture: Eye care: dollars and sense. Am J Ophthalmol. 2007;143:1–8. doi: 10.1016/j.ajo.2006.10.003. [DOI] [PubMed] [Google Scholar]
- 4.Vu HT, Keeffe JE, McCarty CA, Taylor HR. Impact of unilateral and bilateral vision loss on quality of life. Br J Ophthalmol. 2005;89:360–3. doi: 10.1136/bjo.2004.047498. [DOI] [PMC free article] [PubMed] [Google Scholar]
- 5.Lamoureux EL, Saw SM, Thumboo J, et al. The impact of corrected and uncorrected refractive error on visual functioning: the Singapore Malay Eye Study. Invest Ophthalmol Vis Sci. 2009;50:2614–20. doi: 10.1167/iovs.08-2164. [DOI] [PubMed] [Google Scholar]
- 6.Sandhu RK, Munoz BE, Swenor BK, West SK. Refractive Error and Visual Function Difficulty in a Latino Population. Ophthalmology. 2012;119:1731–6. doi: 10.1016/j.ophtha.2012.03.003. [DOI] [PMC free article] [PubMed] [Google Scholar]
- 7.Esteso P, Castanon A, Toledo S, et al. Correction of moderate myopia is associated with improvement in self-reported visual functioning among Mexican school-aged children. Invest Ophthalmol Vis Sci. 2007;48:4949–54. doi: 10.1167/iovs.07-0052. [DOI] [PubMed] [Google Scholar]
- 8.Coleman AL, Yu F, Keeler E, Mangione CM. Treatment of uncorrected refractive error improves vision-specific quality of life. J Am Geriatr Soc. 2006;54:883–90. doi: 10.1111/j.1532-5415.2006.00817.x. [DOI] [PubMed] [Google Scholar]
- 9.Wu SY, Nemesure B, Hennis A, Leske MC. Visual acuity impairment and vision-related quality of life: the Barbados Eye Studies. British Journal of Visual Impairment. 2009;27:9–24. [Google Scholar]
- 10.Chia EM, Mitchell P, Rochtchina E, et al. Unilateral visual impairment and health related quality of life: the Blue Mountains Eye Study. Br J Ophthalmol. 2003;87:392–5. doi: 10.1136/bjo.87.4.392. [DOI] [PMC free article] [PubMed] [Google Scholar]
- 11.Chia EM, Wang JJ, Rochtchina E, et al. Impact of bilateral visual impairment on health-related quality of life: the Blue Mountains Eye Study. Invest Ophthalmol Vis Sci. 2004;45:71–6. doi: 10.1167/iovs.03-0661. [DOI] [PubMed] [Google Scholar]
- 12.Wang JJ, Mitchell P, Smith W, et al. Impact of visual impairment on use of community support services by elderly persons: the Blue Mountains Eye Study. Invest Ophthalmol Vis Sci. 1999;40:12–9. [PubMed] [Google Scholar]
- 13.Klein BE, Klein R, Lee KE, Cruickshanks KJ. Performance-based and self-assessed measures of visual function as related to history of falls, hip fractures, and measured gait time. The Beaver Dam Eye Study. Ophthalmology. 1998;105:160–4. doi: 10.1016/s0161-6420(98)91911-x. [DOI] [PubMed] [Google Scholar]
- 14.Klein BE, Moss SE, Klein R, et al. Associations of visual function with physical outcomes and limitations 5 years later in an older population: the Beaver Dam eye study. Ophthalmology. 2003;110:644–50. doi: 10.1016/S0161-6420(02)01935-8. [DOI] [PubMed] [Google Scholar]
- 15.West SK, Rubin GS, Broman AT, et al. How does visual impairment affect performance on tasks of everyday life? The SEE Project. Salisbury Eye Evaluation. Arch Ophthalmol. 2002;120:774–80. doi: 10.1001/archopht.120.6.774. [DOI] [PubMed] [Google Scholar]
- 16.Lamoureux EL, Chong E, Wang JJ, et al. Visual impairment, causes of vision loss, and falls: the singapore malay eye study. Invest Ophthalmol Vis Sci. 2008;49:528–33. doi: 10.1167/iovs.07-1036. [DOI] [PubMed] [Google Scholar]
- 17.Lamoureux EL, Chong EW, Thumboo J, et al. Vision impairment, ocular conditions, and vision-specific function: the Singapore Malay Eye Study. Ophthalmology. 2008;115:1973–81. doi: 10.1016/j.ophtha.2008.05.005. [DOI] [PubMed] [Google Scholar]
- 18.Varma R, Wu J, Chong K, et al. Impact of severity and bilaterality of visual impairment on health-related quality of life. Ophthalmology. 2006;113:1846–53. doi: 10.1016/j.ophtha.2006.04.028. [DOI] [PubMed] [Google Scholar]
- 19.Nirmalan PK, Tielsch JM, Katz J, et al. Relationship between vision impairment and eye disease to vision-specific quality of life and function in rural India: the Aravind Comprehensive Eye Survey. Invest Ophthalmol Vis Sci. 2005;46:2308–12. doi: 10.1167/iovs.04-0830. [DOI] [PubMed] [Google Scholar]
- 20.Rubin GS, Bandeen-Roche K, Huang GH, et al. The association of multiple visual impairments with self-reported visual disability: SEE project. Invest Ophthalmol Vis Sci. 2001;42:64–72. [PubMed] [Google Scholar]
- 21.Broman AT, Munoz B, Rodriguez J, et al. The impact of visual impairment and eye disease on vision-related quality of life in a Mexican-American population: proyecto VER. Invest Ophthalmol Vis Sci. 2002;43:3393–8. [PubMed] [Google Scholar]
- 22.Chia EM, Mitchell P, Ojaimi E, et al. Assessment of vision-related quality of life in an older population subsample: The Blue Mountains Eye Study. Ophthalmic Epidemiol. 2006;13:371–7. doi: 10.1080/09286580600864794. [DOI] [PubMed] [Google Scholar]
- 23.Rubin GS, West SK, Munoz B, et al. A comprehensive assessment of visual impairment in a population of older Americans. The SEE Study. Salisbury Eye Evaluation Project. Invest Ophthalmol Vis Sci. 1997;38:557–68. [PubMed] [Google Scholar]
- 24.Munoz B, West S, Rubin GS, et al. Who participates in population based studies of visual impairment? The Salisbury Eye Evaluation project experience. Ann Epidemiol. 1999;9:53–9. doi: 10.1016/s1047-2797(98)00026-x. [DOI] [PubMed] [Google Scholar]
- 25.Sheedy JE, Bailey IL, Raasch TW. Visual acuity and chart luminance. Am J Optom Physiol Opt. 1984;61:595–600. doi: 10.1097/00006324-198409000-00010. [DOI] [PubMed] [Google Scholar]
- 26.Ramulu PY, West SK, Munoz B, et al. Driving cessation and driving limitation in glaucoma: the Salisbury Eye Evaluation Project. Ophthalmology. 2009;116:1846–53. doi: 10.1016/j.ophtha.2009.03.033. [DOI] [PMC free article] [PubMed] [Google Scholar]
- 27.Valbuena M, Bandeen-Roche K, Rubin GS, et al. Self-reported assessment of visual function in a population-based study: the SEE project. Salisbury Eye Evaluation. Invest Ophthalmol Vis Sci. 1999;40:280–8. [PubMed] [Google Scholar]
- 28.Massof RW. An interval-scaled scoring algorithm for visual function questionnaires. Optom Vis Sci. 2007;84:689–704. doi: 10.1097/OPX.0b013e31812f5f35. [DOI] [PubMed] [Google Scholar]
- 29.Hornik K. [Accessed January 30, 2015];The R FAQ. Available at: http://CRAN.R-project.org/doc/FAQ/R-FAQ.html.
- 30.Willis JR, Jefferys JL, Vitale S, Ramulu PY. Visual impairment, uncorrected refractive error, and accelerometer-defined physical activity in the United States. Arch Ophthalmol. 2012;130:329–35. doi: 10.1001/archopthalmol.2011.1773. [DOI] [PubMed] [Google Scholar]
- 31.Helbostad JL, Vereijken B, Hesseberg K, Sletvold O. Altered vision destabilizes gait in older persons. Gait Posture. 2009;30:233–8. doi: 10.1016/j.gaitpost.2009.05.004. [DOI] [PubMed] [Google Scholar]
- 32.Shandiz JH, Derakhshan A, Daneshyar A, et al. Effect of cataract type and severity on visual acuity and contrast sensitivity. J Ophthalmic Vis Res. 2011;6:26–31. [PMC free article] [PubMed] [Google Scholar]
- 33.Wilensky JT, Hawkins A. Comparison of contrast sensitivity, visual acuity, and Humphrey visual field testing in patients with glaucoma. Trans Am Ophthalmol Soc. 2001;99:213–7. [PMC free article] [PubMed] [Google Scholar]
- 34.Della Sala S, Bertoni G, Somazzi L, et al. Impaired contrast sensitivity in diabetic patients with and without retinopathy: a new technique for rapid assessment. Br J Ophthalmol. 1985;69:136–42. doi: 10.1136/bjo.69.2.136. [DOI] [PMC free article] [PubMed] [Google Scholar]
- 35.Katz G, Levkovitch-Verbin H, Treister G, et al. Mesopic foveal contrast sensitivity is impaired in diabetic patients without retinopathy. Graefes Arch Clin Exp Ophthalmol. 2010;248:1699–703. doi: 10.1007/s00417-010-1413-y. [DOI] [PubMed] [Google Scholar]
- 36.Richman J, Lorenzana LL, Lankaranian D, et al. Importance of visual acuity and contrast sensitivity in patients with glaucoma. Arch Ophthalmol. 2010;128:1576–82. doi: 10.1001/archophthalmol.2010.275. [DOI] [PubMed] [Google Scholar]
- 37.Liou SW, Chiu CJ. Myopia and contrast sensitivity function. Curr Eye Res. 2001;22:81–4. doi: 10.1076/ceyr.22.2.81.5530. [DOI] [PubMed] [Google Scholar]
- 38.Ray CT, Horvat M, Croce R, et al. The impact of vision loss on postural stability and balance strategies in individuals with profound vision loss. Gait Posture. 2008;28:58–61. doi: 10.1016/j.gaitpost.2007.09.010. [DOI] [PubMed] [Google Scholar]
- 39.Anand V, Buckley JG, Scally A, Elliott DB. Postural stability changes in the elderly with cataract simulation and refractive blur. Invest Ophthalmol Vis Sci. 2003;44:4670–5. doi: 10.1167/iovs.03-0455. [DOI] [PubMed] [Google Scholar]
- 40.Wood JM, Tyrrell RA, Chaparro A, et al. Even moderate visual impairments degrade drivers' ability to see pedestrians at night. Invest Ophthalmol Vis Sci. 2012;53:2586–92. doi: 10.1167/iovs.11-9083. [DOI] [PubMed] [Google Scholar]
- 41.Evans JR, Fletcher AE, Wormald RP. Depression and anxiety in visually impaired older people. Ophthalmology. 2007;114:283–8. doi: 10.1016/j.ophtha.2006.10.006. [DOI] [PubMed] [Google Scholar]