

Abstract
Objectives
The purpose of this study was to evaluate the effectiveness of the Walk Your Heart to Health (WYHH) intervention, one component of the multilevel CATCH:PATH intervention designed to promote physical activity and reduce cardiovascular risk (CVR) among non-Hispanic Black (NHB) and Hispanic residents of Detroit, Michigan. The study was designed and implemented using a community-based participatory research approach that actively engaged community residents, health service providers and academic researchers. It was implemented between 2009–2012.
Methods
WYHH was a 32 week Community-Health Promoter (CHP)-facilitated walking group intervention. Groups met three times per week at community-based or faith-based organizations, and walked for 45–90 minutes (increasing over time). The study used a cluster randomized control design to evaluate effectiveness of WYHH, with participants randomized into intervention or lagged intervention (control) groups. Psychosocial, clinical, and anthropometric data were collected at baseline, 8 and 32 weeks, and pedometer step data tracked using uploadable peiso-electric pedometers.
Results
Participants in the intervention group increased steps significantly more during the initial 8 week intervention period, compared to the control group (β=2004.5, p=0.000). Increases in physical activity were associated with reductions in systolic blood pressure, fasting blood glucose, total cholesterol, waist circumference and BMI at 8 weeks, and maintained at 32 weeks.
Conclusion
The WYHH CHP-facilitated walking group intervention was associated with significant reductions in multiple indicators of CVR among predominantly Hispanic and NHB participants in a low-to-moderate income urban community. Such interventions can contribute to reductions in racial, ethnic and socioeconomic inequities in cardiovascular mortality.
Keywords: Walking groups, health inequities, community health promoters, community-based participatory research
Introduction
The purpose of this study was to evaluate the effectiveness of the Walk Your Heart to Health (WYHH) walking group intervention designed to promote physical activity and reduce CVR among predominantly NHB and Hispanic residents of urban communities. Sedentary lifestyles influence multiple risk factors for cardiovascular disease (CVD), the largest contributor to all-cause mortality in the U.S. accounting for one-third of the excess mortality experienced by NHBs compared with non-Hispanic Whites (NHWs) (Wong, Shapiro et al. 2002). Nationally, just 48% of U.S. adults meet recommended guidelines for adequate physical activity (Services 2008, Services 2008). Leisure time physical activity is positively associated with socioeconomic status (SES) (Schiller, Lucas et al. 2012), and NHBs and Hispanics report lower levels of leisure time physical activity compared with NHWs (Marshall, Jones et al. 2007, 2008). NHBs and Hispanics remain disproportionately likely to live in racially segregated neighborhoods with high rates of poverty, and neighborhood characteristics associated with poverty have been linked to heightened behavioral and clinical risk factors for CVD (Moore, Diez Roux et al. 2008, Mujahid, Diez Roux et al. 2008, Sallis, Floyd et al. 2012), including lower levels of physical activity (Echeverria, Diez-Roux et al. 2008, Sallis, Floyd et al. 2012). Thus, interventions effective in increasing leisure time physical activity among racial, ethnic and socioeconomic groups with high CVR stand to make important contributions toward the elimination of persistent CV inequities.
Walking, a widely accessible form of physical activity across SES and age groups (Services 2008, Tudor-Locke, Johnson et al. 2010), poses low risk of injury, does not require formal training or special equipment and can be sustained into old age (Services 2008) Walking has been demonstrated to reduce multiple indicators of CVR among previously sedentary adults (Swartz, Strath et al. 2003, Tully, Cupples et al. 2005, Murphy, Murtagh et al. 2006, Murphy, Nevill et al. 2007, Ainsworth, Haskell et al. 2011, Kassavou, Turner et al. 2013) and with substantial reductions in the incidence of cardiovascular events and mortality (Manson, Greenland et al. 2002, Williams and Thompson 2013). Interventions to promote walking have been effective in a variety of community contexts (Ogilvie, Craig et al. 2009, Kassavou, Turner et al. 2013), and have been shown to be well accepted by previously sedentary participants (Fisher and Li 2004). Walking group interventions emphasizing strengthening social networks and support for behavior change have been particularly effective (Bjaras, Harberg et al. 2001, Kahn, Ramsey et al. 2002). A recent systematic review of the literature focused on interventions to promote walking in groups concluded that there are no difference in effectiveness between groups facilitated by lay versus professional leaders, with larger effects among groups that include both genders, all ages, and longer duration (Kassavou, Turner et al. 2013). In this same review, (Kassavou, Turner et al. 2013) noted low homogeneity of results across studies, and identified a number of limitations, including: the small number of studies that used objective measures of physical activity; the predominance of NHW participants with limited representation from other racial or ethnic groups, and an inability to compare effectiveness across racial, ethnic, or SES groups (Kassavou, Turner et al. 2013). Thus, while the current evidence base supports the benefits of group interventions to promote walking in community settings, there is a need for further evidence regarding the effectiveness of walking group interventions among racial, ethnic and SES groups with disproportionate CVR.
WYHH Intervention Context
The Walk Your Heart to Health (WYHH) walking group intervention, described in detail below, was designed to test the effectiveness of a lay, community-health promoter-led walking group intervention in Detroit, Michigan, a city whose predominantly NHB and Hispanic residents experience substantial excess age-adjusted mortality due to heart disease (318.4 per 100,000), compared to national rates (192.9 per 100,000) (Health 2012, Murphy 2012). A thriving and prosperous community with a strong middle class for much of the 20th Century, Detroit, like many similar urban areas, experienced population out-migration and economic disinvestment beginning in the 1950s continuing to the present (Sugrue 1996, Farley, Danziger et al. 2000, Southeast Michigan Council of Governments 2006, Bureau 2010). As NHW residents left the city, Detroit’s population shifted from 16% NHB in1950 to 83% NHB and 7% Hispanic in 2010 (Bureau 2010). Simultaneously, economic divestment resulted in exponential growth of poverty in the city (Rossi, Freeman et al. 1999, Farley, Danziger et al. 2000, Bureau 2010). In the face of these challenges, Detroit also has a number of unique strengths, including: partnerships working together to understand and address cardiovascular health disparities, efforts of community groups and organizations to increase physical activity and improve activity- friendliness of neighborhoods; and longstanding collaborations among these entities.
In this paper, we present results from tests of the effectiveness of the HEP WYHH walking group intervention, collaboratively designed, implemented and evaluated by one such Detroit-based partnership, the Detroit Healthy Environments Partnership (described below). Specifically, we test the following hypotheses: 1) adherence to WYHH will not differ by race, ethnicity or SES; 2) participants in the WYHH intervention group will show a larger increase in steps per day (physical activity) from baseline to eight weeks, compared to the lagged intervention group; 3) increases in physical activity during the intervention period (weeks 1–8) will be associated with reductions in indicators of CVR; and 4) reductions in CVR attained during the intervention period will be sustained during the maintenance period (weeks 9–32).
Methods
WYHH was one component of the multilevel Community Approaches to Cardiovascular Health: Pathways to Heart Health (CATCH: PATH) intervention designed by HEP (see acknowledgements), using a community-based participatory research partnership approach that engaged community residents, community-based organizations, health service providers and academic researchers in a two-year community planning process (see (Schulz, Israel et al. 2011). CATCH-PATH was grounded in the community-identified priorities that emerged from this planning process, was informed by a social-ecological model (SEM) that suggests that individual behaviors and risks occur within the context of organizational, community and policy environments (Sallis, Floyd et al. 2012). CATCH: PATH aimed to promote cardiovascular health through walking groups, and through organizational, community and policy change to support activity-friendly communities. The design incorporated risk and protective factors for heart health across multiple levels of a SEM, and attempted to address barriers and strengthen facilitating factors identified in the planning process (Schulz 2011).
The WYHH component of this intervention was guided by a conceptual model, and empirical evidence, suggesting that participation in lay-health advisor-led walking groups can be effective in promoting physical activity (Kassavou, Turner et al. 2013). The intervention was informed by social support interventions (Heaney and Israel 1997) and group dynamics theories (Johnson and Johnson 2012). Empirical literature suggests that groups that offer peer support, and whose leaders promote group cohesion can be effective in increasing intervention adherence (Estabrooks and Carron 1999), increased physical activity (Estabrooks, Fox et al. 2005, Wilson, Basta et al. 2010, Lee, O'Connor et al. 2012) and increased cardiorespiratory fitness (Perry, Rosenfeld et al. 2007) . Guided by this conceptual model and associated empirical evidence, WYHH was a group level intervention to promote physical activity and heart health through organized groups with structured activities and an emphasis on social support and group cohesion (see Figure 1 for the overall conceptual model. Dimensions tested in this manuscript are bolded). Walking groups were hosted by community- or faith-based organizations in Detroit neighborhoods, who received a rental fee for use of their space, as well as funds to support a part time (10 hours per week) Site Community Health Promoter to assist with facilitation of the walking groups, and a small percent effort for on-site supervision. Groups met three times per week for 1.5 hours each time, and were facilitated by Community Health Promoters (CHPs), project staff members who were community residents with strong social and facilitation skills and who matched the demographic and linguistic characteristics of the community. Approval for research on human subjects was granted by the University of Michigan Institutional Review Board on January 31, 2008. The ClinicalTrials.gov identifier is NCT02036593.
Figure 1.

Conceptual Model of the WYHH Intervention
Study Design
Detroit residents aged >18 were eligible to participate following completion of a modified version of the Physical Activity Readiness Questionnaire (Cardinal, Esters et al. 1996). Those currently pregnant, with systolic blood pressure>180 or diastolic >110, fasting blood glucose levels>180, Type 1 or Type 2 diabetes, bone or joint pain, chest pain, dizziness, or currently taking medication for high blood pressure or a heart condition were advised to consult their health care provider before enrolling. Following completion of the informed consent process, participants completed an interviewer-administered baseline Health Risk Assessment (HRA) including a questionnaire, and anthropometric and clinical indicators of cardiovascular risk (CVR) (e.g., blood pressure, lipid panel). Interviewers were community residents who received training in conducting Computer Assisted Personal Interviews (CAPI), clinical and anthropometric measurements, and who worked under the supervision of the CATCH Project Evaluator. Intervention staff were present at these sessions to issue participants pedometers, and to explain their use. Prior to the start of the intervention, each participant wore a pedometer (with the step-counter blinded) for one week to provide baseline steps data.
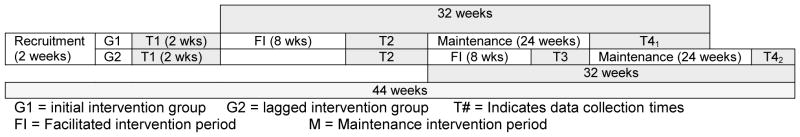
A cluster randomized controlled design with a lagged intervention for the control group was used to evaluate the effectiveness of WYHH (see Figure 2). Participants were randomized into one of two groups: intervention and lagged intervention. Participants who indicated that they were enrolling with one or more friends or family members were randomized as clusters (e.g., three family members who joined together were randomized as a group to assure that they were in the same walking group). Participants randomized into the intervention arm began the WYHH intervention immediately following completion of baseline data collection. Those randomized into the lagged intervention arm returned for a second HRA at 8 weeks, along with those in the intervention group, as shown in Figure 2. Following this data collection point, the lagged intervention group began the WYHH intervention.
Figure 2.
Lagged intervention design for evaluation of WYHH intervention
Following baseline data collection (T1, Figure 2), the intervention group completed the 8-week WYHH intervention, followed by a second wave of data collection, involving interviewer-administered face-to-face interviews and anthropometric measurements for both the initial and lagged intervention groups (T2, Figure 2). The lagged intervention group then completed the 8 week WYHH intervention, followed by a third wave of data collection (T3). Both groups continued walking for another 24 weeks, with follow up data collection (T4) conducted 32 weeks after the initiation of WYHH to assess maintenance of change over time. Thirty WYHH groups (15 paired intervention/lagged intervention groups) were held at 11 sites located in Detroit neighborhoods (May 2009 – May 2012). Two Detroit-based project coordinators provided supervision and day-to-day oversight for the intervention activities, following protocols developed by the Project Manager working in conjunction with the HEP SC and the Project Director.
Data & Measures
HRAs were completed at baseline, 8 and 32 weeks, using face-to-face computer assisted personal interviews, in English or Spanish based on the preference of the participant. Interviews were conducted by non-intervention staff who were community members and who received training in interviewing techniques. Height (inches) was recorded at baseline. Weight (pounds), waist circumference (cm), and three measures of resting systolic and diastolic blood pressure (micrograms mercury) were recorded (one minute between measurements, using an Omron HEM-712C digital blood pressure monitor) at each data collection point. At each data collection point, a fasting blood sample was collected using a finger stick to monitor total and high density lipids (mg/dL), and glucose (mg/dL) using a Cholestec LDX machine. Participants wore an Omron JH 112 pieso-electric pedometer for one week prior to initiating the walking groups to record baseline steps (T1, Figure 2), and for the duration of the study period.
Measures
Dependent variables included indicators of physical activity and cardiovascular risk (CVR). Physical activity included continuous measures of: WYHH Steps (mean steps on days participants walked with WYHH groups); non-WYHH Steps (mean steps on days they walked without the groups); and Overall Steps (mean daily steps on all days), constructed using data from the Omron peiso-electric pedometer. Indicators of CVR included: high blood pressure, measured as systolic BP >140, diastolic >90, or currently taking blood pressure medication; total cholesterol (mg/dL); high density lipoproteins (mg/dL); glucose (mg/dL); waist circumference (cm); and BMI. We also assessed cumulative biologic risk (CBR), calculated as the sum of the following indicators: systolic blood pressure >=140; diastolic blood pressure >=90; waist circumference >=102 cm [males] or >=88 cm [females]; glucose >=110; total cholesterol >240 or total cholesterol<=240 and LDL>=130; and HDL (<40 for men or <50 for women). Following (Geronimus, Hicken et al. 2006), the index included points for individuals whose systolic and diastolic blood pressure levels were below the high blood pressure cut points and who were taking hypertension medication; those with glucose levels below the high risk cut point who were taking medication, and those whose lipid levels were within the normal range and who were taking medication for dyslipidemia.
Independent variables include two measures of adherence to the WYHH protocol, number of sessions attended overall; and consistency of participation, assessed as the number of weeks the participant attended at least one WYHH session. Adherence was entered into models using two sets of dummy variables: The first set reflected adherence during the 8 week intervention period (Adherence I), and the second reflected adherence during the 24 week maintenance period (Adherence M). Adherence I took the value of 0 at baseline and 32 weeks, and at 8 weeks reflected the number of sessions attended during the 8 week intervention period (up to three sessions per week, range 0–24), or the consistency of attendance in the intervention period (range 0–8). Adherence M took the value of 0 at baseline and 8 weeks, and at 32 weeks reflected the value of the number of sessions attended during the maintenance period (3 sessions per week, weeks 9–32: range 0–72) or the number of weeks the participant had attended at least one session (consistency) (0–24). In models with CVR as the dependent variable, measures of physical activity were used as independent variables. For these models, each measure of physical activity (WYHH Steps, Overall Steps, and non-WYHH Steps, described above) was entered as a dummy variable. Physical Activity I represented the change in mean steps per day from baseline to the end of the 8 week intervention period: it took the value of 0 at baseline and 32 weeks. Physical Activity M represented the change in mean steps per day during the maintenance period, weeks 9–32: it took the value of 0 at baseline and 8 weeks. Demographic controls included age (in years), gender, and self-reported race or ethnicity (NHB, Hispanic, NHW).
Data Analysis
Preliminary analyses included frequencies, means and variances for key variables, followed by bivariate analysis of crude associations, using odds ratios for categorical and correlation coefficients for continuous variables. Multivariate models examined effects of WYHH participation on physical activity, and on key indicators of CVR. We used generalized estimating equations (GEEs) to deal with intraclass correlations due to: observations obtained from the same participant over time; clustering of individuals within walking groups; and clustering due to randomization of groups of friends or family members together into the same walking group. To assess the first research question, the extent to which the WYHH intervention was successful in recruiting members of the focal population (low to moderate income Hispanic and NHB residents), we examined the racial, ethnic and educational characteristics of the WYHH participants, as well as their self-reported household income. Next, we calculated retention rates at eight and 32 weeks overall, and by education, income, and race and ethnicity.
To test the hypothesis that participants in the WYHH intervention increased physical activity more than those in the lagged intervention (control) group (effectiveness), we ran GEE models comparing change in steps from baseline to 8 weeks for intervention compared to lagged intervention groups.
Next, we ran GEE models to assess more specifically the effectiveness of participation in the WYHH intervention in: a) increasing physical activity, and b) reducing CVR with increased physical activity. There were no significant differences between the intervention and lagged intervention groups in demographic characteristics, baseline steps, or changes in physical activity over time during the 8 week intervention period. Hence, data from the intervention and lagged intervention groups were pooled for the tests of these hypotheses. In addition, because there were no significant differences in steps or cardiovascular health indicators in the lagged intervention group between T1 and T2, T1 data was used as baseline data for both the intervention and the lagged intervention groups. This allows for chronologic concordance of baseline data across groups. Model 1 tested the hypothesis that adherence (number of sessions attended, consistency) to the WYHH intervention protocol was positively associated with steps.
| [1] |
Next, to test the hypothesis that change in steps over time will reduce CVR, we ran regression models of the form shown in Model 2.
| [2] |
CVR is the longitudinal vector of the relevant indicator of CVR risk (e.g., HBP).
Results
As shown in Table 1, 695 individuals enrolled in WYHH. At baseline, 61% identified as NHB; 3% as NHW; 36% as Hispanic. The majority (90%) were female, 42% had high school education or less, 71% reported annual household incomes of less than $35,000, and mean age was 46.7. Of the 695 who enrolled, 603 (87%) attended any WYHH sessions. There were no differences by race, ethnicity, household income, education or waist circumference between those who enrolled and never attended, and those who enrolled and attended any session (results not shown). Those who enrolled and never attended were younger (40.1 vs. 47.5 years, p=0.07), and were less likely to have high blood pressure (28.3% vs. 43.8%, p<0.001) than those who enrolled and attended.
Table 1.
Characteristics of WYHH Study Participants at Baseline, Eight and Thirty-two weeks.
| (A) Baseline (n=695) | (B) 8 weeks (n=541) | ( C ) 32 weeks (n=388) | (A)vs (B) | (A) vs ( C ) | (A) Vs (B) | |
|---|---|---|---|---|---|---|
| Age, mean (Stdev) | 46.6(13.5) | 48.6 (13.6) | 49.6 (13.4) | *** | *** | |
| Race/Ethnicity, % | ||||||
| Hispanic | 36.1 | 34.2 | 33.3 | |||
| Non-Hispanic Black | 62.0 | 62.1 | 62.8 | |||
| Non-Hispanic White | 1.9 | 0.7 | 0.8 | |||
| Other | 2.7 | 3.0 | 3.1 | |||
| Baseline Education, % | ||||||
| <12 years | 21.5 | 21.7 | 21.5 | |||
| 12 years | 20.7 | 20.9 | 20.9 | |||
| More than 12years | 55.2 | 54.9 | 55.2 | |||
| Other | 2.6 | 2.4 | 2.4 | |||
| Annual Household Income | ||||||
| $9,999 or less | 17.7 | 13.1 | 13.9 | |||
| $10,000 to $19,999 | 23.9 | 24.2 | 25.8 | |||
| $20,000 to $34,999 | 23.3 | 26.3 | 25.3 | |||
| More than $35,000 | 28.8 | 29.6 | 29.2 | |||
| Refused | 6.3 | 6.8 | 5.8 |
Indicates significance at p<0.05
Also shown in Table 1, eight week retention was 78% (540/695) of all who enrolled, and 90% (540/603) among those exposed (ever attended WYHH sessions). Thirty-two week retention was 56% of all who enrolled (388/695), and 64% (388/603) of those exposed (ever attended any session). There were no differences in retention by race, ethnicity, education or income. Those active at 8 and 32 weeks were older (p<.05) (48.6 & 49.6, respectively, compared to 46.7 at baseline).
Effectiveness in Promoting Physical Activity
Mean number of steps per day adjusting for age, gender and race, did not differ between the intervention and lagged intervention groups at baseline (6524.4 and 6694.3, respectively, p=0.222). At week eight, intervention group participants recorded significantly more steps per day compared to the lagged intervention control group (β=2004.5, p<0.001).
Figure 3 shows unadjusted mean steps per person per day for each of the three measures of physical activity included in this analysis: non-WYHH Steps (mean steps per day on days not walking with the WYHH groups); WYHH Steps (mean steps per day on days walking with the WYHH groups); and Overall Steps (mean steps per day on all days of the week). Overall, in these unadjusted models, participants recorded significantly more steps compared to baseline at 8 (β=2264, p<0.001) and 32 weeks (β=2110, p<0.001), respectively. As shown, the unadjusted mean number of steps per day is significantly greater on days that participants walked with the WYHH groups, compared either to baseline steps or to the mean number of steps per day on days they did not walk with the WYHH group. These unadjusted results suggest that adherence or participation in the WYHH groups may be associated with increased physical activity.
Figure 3.

Unadjusted mean steps per day on days walked with WYHH (WYHH Steps), days not walked with WYHH (non-WYHH), and overall (Overall)
To test this hypothesis more specifically, we ran models examining whether adherence (number of sessions attended, consistency of attendance) was positively associated with physical activity (steps), adjusting for demographic characteristics, using each of the three measures of physical activity described above. Results for Overall Steps are shown in Table 2.
Table 2.
Overall Mean Steps regressed on participation (number of sessions & consistency) of Intervention Period (weeks 1–8), and Maintenance Period (weeks 9–32) controlling for age, gender and race.
| Parameter | Estimate | Stderr | 95%CI | p-value | Estimate | Stderr | 95%CI | p-value |
|---|---|---|---|---|---|---|---|---|
| Intercept | 7545.6 | 555.8 | (6456.3,8634.9) | 0.000 | 7216.4 | 564.9 | (6109.1,8323.6) | 0.000 |
| Age | −25.2 | 7.7 | (−40.3, −10.1) | 0.001 | −19.4 | 7.8 | (−34.7, −4.0) | 0.013 |
| Female | −1346.3 | 449.3 | (−2226.9, −465.7) | 0.003 | −1354.1 | 454.4 | (−2244.7, −463.5) | 0.003 |
| Non-Hispanic Black | −680.1 | 216.4 | (−1104.3, −256) | 0.002 | −693.3 | 217.3 | (−1119.3, −267.4) | 0.001 |
| Number of Sessions Intervention (weeks 0–8) | 178.9 | 7.6 | (164,193.7) | 0.000 | ||||
| Number of Sessions Maintenance (weeks 9–32)+ | 64.1 | 3.8 | (56.6,71.5) | 0.000 | ||||
| Consistency Intervention (weeks 0–8) | 396.0 | 16.7 | (363.3,428.6) | 0.000 | ||||
| Consistency Maintenance (weeks 9–32)+ | 132.1 | 8.2 | (116,148.2) | 0.000 |
+ Increases in steps during the maintenance period are interpreted as increases over the average number of steps per day at 8 weeks, rather than baseline. That is, continued increases in steps over and above the improvements attained at the 8 week mark.
Overall Steps increased significantly with both the number of sessions (β=178.9, p<0.001) and consistency (number of weeks attended at least one session) (β=396.0, p<0.001). Each additional WYHH session (number) attended weeks 1–8, was associated with an additional 178.9 Overall Steps per day. Each additional week of attendance (consistency) was associated with an additional 396.0 Overall Steps per day. Extrapolating these results, a participant who attended 18 WYHH sessions in weeks 1–8 would be expected to increase Overall Steps by 3,364 steps/day. Patterns were similar for models using WYHH Steps and non-WYHH Steps (results not shown).
Similarly, both the number (β=64.1, p<0.001), and consistency (β=132.1, p<0.001) of attendance during the maintenance period, weeks 9–32, were positively associated with Overall Steps, suggesting continued increases in physical activity associated with adherence during the maintenance period. Patterns were similar for models run using WYHH Steps and non-WYHH Steps (results not shown).
Effectiveness in Reducing CVR
Table 3 shows results from tests of the hypothesis that physical activity was inversely associated with anthropometric and clinical indicators of CVR over the intervention and maintenance periods. These models disentangle the associations with physical activity of the mean number of steps per day recorded at baseline (baseline steps), the change in the mean number of steps per day during the 8 week intervention period (Physical Activity Intervention), and the change in steps per day during the 24 week maintenance period (Physical Activity Maintenance). Each increase of 1000 Overall Steps at 8 weeks compared to baseline (Physical Activity Intervention) was associated with lower odds of high blood pressure (0.9, p=0.01), and with reductions in total cholesterol (β=−0.10, p=0.02), high density lipoprotein (β= −0.3, p=0.00), blood glucose (β= −0.4, p=0.04) and waist circumference (β= −0.2 cm, p=0.01). BMI (β= −0.01, p=0.04) and CBR (β= −0.1, p=0.00) were also reduced significantly (results not shown) at eight weeks. Similar patterns were found for WYHH Steps and non-WYHH steps (results not shown).
Table 3.
Indicators of cardiovascular risk (systolic BP, diastolic BP, total cholesterol, HDL, fasting blood glucose, waist circumference) regressed on change in overall mean steps (per 1000 steps) during the intervention period, and overall mean steps (per 1000 steps) during the maintenance period, controlling for age, gender and racial or ethnic status)
| High Blood Pressure | Total Cholesterol | High Density Lipoproteins | Blood Glucose Levels | Waist Circumference | CBR | |||||||||||||
|---|---|---|---|---|---|---|---|---|---|---|---|---|---|---|---|---|---|---|
|
| ||||||||||||||||||
| OR | 95%CI | pvalue | Estimate | 95%CI | pvalue | Estimate | 95%CI | pvalue | Estimate | 95%CI | pvalue | Estimate | 95%CI | pvalue | Estimate | 95%CI | pvalue | |
|
| ||||||||||||||||||
| Intercept | 152.1 | (136.7,167.4) | 0.00 | 17.7 | (12,23.5) | 0.00 | 86.9 | (79.5,94.3) | 0.00 | 115.6 | (107.8,123.4) | 0.00 | 0.9 | (0.2,1.6) | 0.02 | |||
| Age | 1.1 | (1.0,1.1) | 0.00 | 0.4 | (0.1,0.6) | 0.00 | 0.3 | (0.2,0.4) | 0.00 | 0.4 | (0.2,0.5) | 0.00 | −0.2 | (−0.3,0.0) | 0.01 | 0.0 | (0,0.1) | 0.00 |
| Female | 0.8 | (0.4,1.5) | 0.52 | 6.0 | (−4.9,16.8) | 0.28 | 10.4 | (6.9,13.9) | 0.00 | −0.3 | (−4.5,4.0) | 0.89 | −6.3 | (−11.2, −1.5) | 0.01 | 0.2 | (−0.3,0.7) | 0.44 |
| Non-Hispanic Black | 2.7 | (1.8,4.1) | 0.00 | −0.5 | (−6.5,5.5) | 0.87 | 4.7 | (2.2,7.2) | 0.00 | −0.9 | (−4.5,2.6) | 0.62 | 4.8 | (1.9,7.7) | 0.00 | 0.1 | (−0.2,0.4) | 0.41 |
| Physical Activity Baselinea | 0.9 | (0.8,1.0) | 0.01 | 0.4 | (−0.6,1.5) | 0.38 | 0.6 | (0.2,1.0) | 0.01 | −0.7 | (−1.3, −0.2) | 0.01 | −0.9 | (−1.4, −0.4) | 0.00 | −0.1 | (−0.1,0) | 0.00 |
| Physical Activity Intervention | 0.9 | (0.9,1.0) | 0.00 | −0.7 | (−1.2, −0.1) | 0.02 | −0.3 | (−0.5, −0.1) | 0.00 | −0.4 | (−0.8,0.0) | 0.04 | −0.2 | (−0.3,0.0) | 0.01 | −0.1 | (−0.1,0) | 0.00 |
| Physical activity Maintenance c | 0.9 | (0.8,1.1) | 0.32 | −2.2 | (−4, −0.3) | 0.02 | −0.7 | (−1.5,0.0) | 0.06 | 0.1 | (−1.0,1.2) | 0.87 | −0.2 | (−0.8,0.5) | 0.62 | −0.1 | (−0.2,0) | 0.21 |
mean steps per day (per 1000 steps) at baseline
change in mean steps per day (per 1000 steps) from baseline to 8 weeks (intervention period)
change in mean steps per day (per 1000 steps) from 9 to 32 weeks (maintenance period)
Coefficients for Physical Activity Maintenance indicate that odds of high blood pressure (0.92, p=0.32), and associations with total cholesterol (β= −2.2, p=0.02), high density lipoproteins (β= −0.7, p=0.06), blood glucose (β=0.1, p=0.87) and waist circumference (β= −0.2 cm, p=0.62) continue to be inversely associated with physical activity. Trends were similar for BMI (β= −0.0, p=0.98), and CBR (β= −0.1, p=0.21) (not shown). With the exception of total cholesterol and CBR, additional reductions during the maintenance period were not statistically significant, beyond reductions achieved during the intervention period, using Overall Steps as the independent variable. Similar patterns were evident for models using non-WYHH Steps and for WYHH Steps, which showed continued significant reductions in waist circumference (β = −0.00, p=0.032), and BMI (β = −0.00, p=0.031) for each additional 1000 steps per day during the maintenance period using the latter measure of physical activity (results not shown).
Discussion
There are four main findings from this study. First, WYHH walking groups, conducted at community-based locations and facilitated by CHPs, were effective in engaging residents of low-to-moderate income, predominantly NHB and Hispanic communities at high risk for CVD, in physical activity. There were no differences in retention by race, ethnicity or SES. Second, results suggest that participation in the WYHH intervention was associated with increased physical activity, compared to participants in the lagged intervention control group. Third, increases in walking (steps), a moderate form of physical activity, were associated with improvements in multiple indicators of CVR during the 8-week intervention period. Finally, reductions in multiple CVD risk indicators attained during the eight week intervention period were largely maintained during the 24 week maintenance period, with some evidence of continued reduction in risk for specific outcomes. These results are generally consistent with a growing body of evidence suggesting that walking group interventions are efficacious in promoting physical activity (Kassavou, Turner et al. 2013), and a more limited body of evidence suggesting that they may be an effective strategy for reducing CVR among racial, ethnic and socioeconomic groups who experience excess risk (Rogers 1997, Banks-Wallace and Conn 2005, Banks-Wallace 2007, Hogue 2007, Lee, O'Connor et al. 2012). We discuss each of these findings below, followed by limitations, and implications for interventions to reduce racial, ethnic and socioeconomic health disparities.
Engaging residents of low-to-moderate income urban communities in physical activity
WYHH was successful in recruiting NHB and Hispanic participants, across a range of educational levels, with low to moderate household incomes. Our finding that 86% of those who completed baseline assessments attended at least one walking group session is comparable to 84% reported by (Coull, Taylor et al. 2004) for a sample of individuals aged 60 and over with ischaemic heart disease. Retention rates at 8 weeks (86% of all enrolled and 91% of those who attended one or more session) exceed the Prevention Research Synthesis criteria for 70% retention (Lyles, Crepaz et al. 2006). At 32 weeks, retention (56% of all enrolled and 65% of those who attended at least one session) falls below this bar. Loss to follow-up is problematic in most longitudinal studies and may lead to bias, depending on whether data is missing completely at random, missing at random, or missing not at random. In a simulation study (Kristman, Manno et al. 2004) used 1000 computer replications of a cohort of 500 observations with differing levels of loss to follow-up generated through three mechanisms: missing completely at random (MCAR), missing at random (MAR) and missing not at random (MNAR). They report no important bias with levels of loss that varied from 5 to 60% when loss to follow-up was related to MCAR or MAR mechanisms. However, when observations were lost to follow-up based on a MNAR mechanism, the authors found seriously biased estimates. Subject loss rarely, if ever, occurs completely at random, rather there is usually a systematic reason why subjects are lost from a longitudinal study. When observations are MAR, it is assumed that the probability of a subject remaining in the study depends on the exposure or confounders, but not on the outcome (Kristman, Manno et al. 2004). In this scenario, loss to follow up should not differ by any of our dependent variables (e.g., blood pressure, total cholesterol, HDL, blood glucose). In this particular analysis we found no association of loss to follow-up and relevant health outcomes, nor did we find differences by several key independent variables, including race, ethnicity, income and education. Our finding of differences in retention by age, with older participants less likely to be lost to follow up is consistent with a MAR scenario, and may be of less concern than MNAR because previously collected variables can help explain the potential bias by controlling for the covariates that are associated with loss to follow-up in multivariate analysis (Kristman, Manno et al. 2004).
Thus, while the level of attrition in this study is higher than has been reported in some studies with different sample and intervention characteristics (76% (Estabrooks, Bradshaw et al. 2008), and we can not rule out the possibility that data are MNAR on some other variable not examined here, our assessment of patterns of loss to follow up are suggestive of MAR. Furthermore, our rate of loss to follow up is comparable to 6 month retention rates recently reported for community-based walking group interventions with comparable samples (61%, (Warren, Maley et al. 2010); 68%, (Jancey, Lee et al. 2008), Variations in intervention design, sampling strategies (e.g., community sample versus disease-specific sample), age of participants, and in reporting of participant retention contribute to challenges in comparing these results. Despite these limitations, our findings suggest that walking groups based in community- or faith-based organizations in urban communities, that offer social support and structured opportunities for walking, and with leadership from CHPs, can be successful in recruiting participants from racial, ethnic and socioeconomic groups that experience disproportionate risk of CVD, with needed attention to retention. Our finding that older participants are more likely to remain engaged in the walking groups, and therefore more likely to realize the health benefits described above, is consistent with results from a recent meta-analysis reporting that walking groups with older participants were more likely to realize greater health improvements (Kassavou, Turner et al. 2013). While the evidence is limited by the small number of studies, some with relatively small sample sizes, and variations in reporting that contribute to challenges in comparisons across studies, retention may be a particular concern in communities whose demographics are consistent with excess CVR.
Participation in walking groups and physical activity levels
A comparison of participants in the WYHH intervention walking groups compared to the lagged intervention groups shows that those in the intervention group increased average steps per day about 2000 steps more (p<.0001) compared to those in the lagged group during the same 8 week period. Mean increases in overall steps per day at 8 weeks and 32 weeks (2264 and 2110, respectively) are comparable to results reported elsewhere in the literature, including studies by: (Banks-Wallace 2007) who reports increases of 203 and 1425 steps per day at 6 and 12 months respectively; (Zoellner, Connell et al. 2010) who report an increase in 2567 steps per day at 6 months; and (Duru, Sarkisian et al. 2010) who report an average increase in weekly steps of 9,883 (1411 steps per day) at 6 months. .
Adherence, whether assessed as number of sessions attended or consistency (number of weeks attended at least one session), was positively associated with increases in physical activity. Participants walked significantly more steps on the days that they walked with the walking groups compared to either baseline or to the days that they did not walk with WYHH groups. Attending a greater number of sessions, or a greater number of weeks, was associated with greater increases in physical activity during the intervention and the maintenance period.
Reductions in anthropometric and clinical indicators of CVR (Intervention)
Results reported here suggest that walking was associated with significant reductions in multiple indicators of CVR. Reductions in the odds of high blood pressure, total cholesterol, blood glucose levels, waist circumference, BMI and cumulative biologic risk (CBR) were realized in just eight weeks of moderate physical activity. These results are consistent with findings reported elsewhere in the literature, with participation in walking group interventions associated with reduced risk of multiple indicators of CVR (Banks-Wallace 2007).
The one exception to this pattern was reflected in HDL, where reductions are in a direction generally associated with increased CVR. Meta-analysis of randomized controlled trials conducted by (Kodama, Tanaka et al. 2007) found wide variation in the effect of aerobic physical activity on serum HDL levels. Specifically, minimum exercise length and energy expenditure were needed to produce increases in HDL. Participants with high total cholesterol and low BMI experienced greater exercise effects on HDL (Kodama, Tanaka et al. 2007). Dietary factors may also have played a role in participant serum HDL if participants replaced saturated fats with polyunsaturated fats or carbohydrates during the intervention period (Barnard 1991).
Coefficients reported in Table 3 indicate improvements in multiple CVR indicators, and are reported for each 1000 step increase in mean steps taken per day (Overall Steps). As reported above, WYHH participants increased mean steps per day by 2004.5 steps during the 8 week intervention period. As a result, these results are a conservative estimate of reductions in risk achieved by participants in the WYHH intervention.
Maintenance of reductions in CVR
During the maintenance period (weeks 9–32), participants experienced continued significant reductions in total cholesterol associated with Overall Steps, in waist circumference and BMI associated with WYHH Steps, and in CBR regardless of the measure of physical activity used. While other indicators generally trended toward reductions in CVR, these reductions were not significantly beyond the reductions in risk realized during the initial 8 week intervention period.
Limitations
There are a number of limitations associated with this study. Notably, while retention at 8 weeks was strong, at 32 weeks study retention fell below 70%, thus raising concerns about potential retention bias. While we were able to demonstrate that there were no differences in retention by race, ethnicity, income or household education, we are not able to rule out the possibility that those who did not continue did not differ from those who continued in some way that may have affected our findings. The demographic composition of the study communities, and thus the demographic composition of participants, allowed us to test for differences in retention between NHB and Hispanic participants, but not for comparisons to NHWs. Finally, the inclusion of specific measures of dietary intake may have allowed further exploration of the declines in HDL observed over the course of the intervention, and to better understand what, if any, role changes in dietary intake may have contributed to changes in anthropometric and clinical indicators of CVR observed.
Implications for Practice
Despite the limitations described above, the findings reported here contribute to a growing body of evidence suggesting that interventions to promote walking in groups are effective in increasing physical activity (Kassavou, Turner et al. 2013). Perhaps most importantly, these findings contribute to, and substantially strengthen, a relatively small body of evidence suggesting that such interventions may be effective for NHB and Hispanic residents of low-to-moderate income neighborhoods, as well as NHWs (Banks-Wallace 2007, Duru, Sarkisian et al. 2010, Zoellner, Connell et al. 2010, Lee, O'Connor et al. 2012). They expand and strengthen previously reported results in several important ways. Specifically, the large sample size and randomized, controlled study design provide more robust evidence than has been available through several previous studies. The use of uploadable pedometers throughout the intervention and maintenance periods, and clinical and anthropometric measurements taken at baseline, 8 and 32 weeks is an advance over several previous studies that relied upon self-report data. The inclusion of both NHB and Hispanic participants in this study, and availability of measures of education and income, allowed testing for differences in adherence on these demographic indicators, with none found.
Thus the results reported here contribute to an increasingly robust body of evidence suggesting that members of racial, ethnic and socioeconomic groups that experience excess CVR, and who reside in neighborhoods where built and social environments may pose particular challenges for physical activity, have an interest in participation in walking groups. Furthermore, adherence at eight weeks was excellent, and while lower than optimal, roughly 60% of those enrolled continued to participate after 32 week. Participants realized increases in physical activity and reductions in CVR, with adherence highest and thus CVR reductions most likely among older individuals.
Walking group interventions designed in collaboration with community members to address aspects of local social and physical environments described as challenging for regular physical activity (e.g., mapping safe routes for groups to walk in their neighborhoods, identifying community locations where community members could walk indoors when weather conditions were poor). Because residents of such neighborhoods experience disproportionate CVR, designing interventions that take into account the contexts in which people attempt to be physically active are particularly important. The findings reported here provide evidence that such interventions can be effective in promoting physical activity and reducing CVR among groups that experience excess risk.
Dissemination of interventions such as WYHH that have demonstrated effectiveness in increasing physical activity and reducing CVR may contribute to reductions in racial, ethnic and socioeconomic health disparities. However, such reductions are unlikely, in and of themselves, to eliminate disparities in CVR. Rather, they are most likely to contribute to sustained reductions in CVR disparities if enacted as one component of multi-level efforts that encompass changes in social and economic policies as well as community efforts that simultaneously address socioeconomic, built and social environmental conditions that contribute to excess CVR (Sallis, Cervero et al. 2006, Frohlich and Potvin 2008, Garcia, Bracho et al. 2009).
In sum, NHBs and Hispanics experience excess CVR and are more likely to reside in communities with limited walkability compared to NHWs in the U.S. Relatively few studies have examined the acceptability and effectiveness of walking groups as interventions that may help to address challenges experienced by residents of low to moderate income urban communities in maintaining active lifestyles. The WYHH CHP-led walking group intervention was designed and implemented using a community-based participatory process with particular attention to addressing challenges and building on assets within low to moderate income neighborhoods in Detroit. Results reported here suggest that collaboratively designed interventions that engage community and academic partners, build on community strengths and assets (e.g., community-based organizations as host sites, community residents as CHPs), and that address resident-identified community challenges (e.g., safety) can effectively promote physical activity and cardiovascular health among those who experience excess risk. Dissemination of such evidence-based interventions can be one component of multilevel approaches to promote physical activity and reduce excess CVR.
Acknowledgments
The Healthy Environments Partnership (HEP) (www.hepdetroit.org) is a community-based participatory research partnership affiliated with the Detroit Community-Academic Urban Research Center (www.detroiturc.org). We thank the members of the HEP Steering Committee for their contributions to the work presented here, including representatives from Brightmoor Community Center, Detroit Department of Health and Wellness Promotion and Institute for Population Health, Detroit Hispanic Development Corporation, Friends of Parkside, Henry Ford Health System, Warren Conner Development Coalition, and University of Michigan School of Public Health. The study and analysis were supported by the National Institute for Minority Health and Health Disparities (R24 MD001619). The results presented here are solely the responsibility of the authors and do not necessarily represent the views of NIMHD, its directors, officers, or staff. We thank our funders for support for this manuscript, and also thank Sue Andersen and Cassandra Parks for critical support in its preparation.
References
- Ainsworth BE, Haskell WL, Herrmann SD, Meckes N, Bassett DR, Jr, Tudor-Locke C, Greer JL, Vezina J, Whitt-Glover MC, Leon AS. 2011 Compendium of Physical Activities: a second update of codes and MET values. Med Sci Sports Exerc. 2011;43(8):1575–1581. doi: 10.1249/MSS.0b013e31821ece12. [DOI] [PubMed] [Google Scholar]
- Banks-Wallace J. Outcomes from Walk the Talk: a nursing intervention for Black women. Abnf j. 2007;18(1):19–24. [PubMed] [Google Scholar]
- Banks-Wallace J, Conn V. Changes in steps per day over the course of a pilot walking intervention. Abnf j. 2005;16(2):28–32. [PubMed] [Google Scholar]
- Barnard RJ. Effects of life-style modification on serum lipids. Arch Intern Med. 1991;151(7):1389–1394. [PubMed] [Google Scholar]
- Bjaras G, Harberg LK, Sydhoff J, Ostenson CG. Walking campaign: a model for developing participation in physical activity? Experiences from three campaign periods of the Stockholm Diabetes Prevention Program (SDPP) Patient Educ Couns. 2001;42(1):9–14. doi: 10.1016/s0738-3991(99)00119-6. [DOI] [PubMed] [Google Scholar]
- Bureau USC. 2010 Census, Detroit City Quickfacts. 2010 Retrieved May 11, 2012, from. [Google Scholar]
- Cardinal BJ, Esters J, Cardinal MK. Evaluation of the revised physical activity readiness questionnaire in older adults. Med Sci Sports Exerc. 1996;28(4):468–472. doi: 10.1097/00005768-199604000-00011. [DOI] [PubMed] [Google Scholar]
- Coull AJ, Taylor VH, Elton R, Murdoch PS, Hargreaves AD. A randomised controlled trial of senior Lay Health Mentoring in older people with ischaemic heart disease: The Braveheart Project. Age Ageing. 2004;33(4):348–354. doi: 10.1093/ageing/afh098. [DOI] [PubMed] [Google Scholar]
- Duru OK, Sarkisian CA, Leng M, Mangione CM. Sisters in motion: a randomized controlled trial of a faith-based physical activity intervention. J Am Geriatr Soc. 2010;58(10):1863–1869. doi: 10.1111/j.1532-5415.2010.03082.x. [DOI] [PMC free article] [PubMed] [Google Scholar]
- Echeverria S, Diez-Roux AV, Shea S, Borrell LN, Jackson S. Associations of neighborhood problems and neighborhood social cohesion with mental health and health behaviors: the Multi-Ethnic Study of Atherosclerosis. Health Place. 2008;14(4):853–865. doi: 10.1016/j.healthplace.2008.01.004. [DOI] [PubMed] [Google Scholar]
- Estabrooks PA, Bradshaw M, Dzewaltowski DA, Smith-Ray RL. Determining the impact of Walk Kansas: applying a team-building approach to community physical activity promotion. Ann Behav Med. 2008;36(1):1–12. doi: 10.1007/s12160-008-9040-0. [DOI] [PubMed] [Google Scholar]
- Estabrooks PA, Carron AV. Group cohesion in older adult exercisers: prediction and intervention effects. J Behav Med. 1999;22(6):575–588. doi: 10.1023/a:1018741712755. [DOI] [PubMed] [Google Scholar]
- Estabrooks PA, Fox EH, Doerksen SE, Bradshaw MH, King AC. Participatory research to promote physical activity at congregate-meal sites. J Aging Phys Act. 2005;13(2):121–144. doi: 10.1123/japa.13.2.121. [DOI] [PubMed] [Google Scholar]
- Farley R, Danziger S, Holzer HJ. Detroit Divided. New York: Russell Sage Foundation; 2000. [Google Scholar]
- Fisher KJ, Li F. A community-based walking trial to improve neighborhood quality of life in older adults: a multilevel analysis. Ann Behav Med. 2004;28(3):186–194. doi: 10.1207/s15324796abm2803_7. [DOI] [PubMed] [Google Scholar]
- Frohlich KL, Potvin L. Transcending the known in public health practice: the inequality paradox: the population approach and vulnerable populations. Am J Public Health. 2008;98(2):216–221. doi: 10.2105/AJPH.2007.114777. [DOI] [PMC free article] [PubMed] [Google Scholar]
- Garcia R, Bracho A, Cantero P, Glenn BA. “Pushing” physical activity, and justice. Prev Med. 2009;49(4):330–333. doi: 10.1016/j.ypmed.2009.07.016. [DOI] [PubMed] [Google Scholar]
- Geronimus AT, Hicken M, Keene D, Bound J. “Weathering” and age patterns of allostatic load scores among blacks and whites in the United States. American Journal of Public Health. 2006;96(5):826–833. doi: 10.2105/AJPH.2004.060749. [DOI] [PMC free article] [PubMed] [Google Scholar]
- Health M. D. o. C. Mortality Statistics. 2012 Retrieved September 19, 2012, from “, from http://www.mdch.state.mi.us/pha/osr/CHI/Deaths/frame.asp.
- Heaney CA, Israel BA. Social networks and social support in health education. In: Glanz K, Lewis FM, Rimer BK, editors. Health Behavior and Health Education. San Francisco: Jossey-Bass; 1997. pp. 179–205. [Google Scholar]
- Hogue P. The effects of buddy support on physical activity in African American women. University of Toledo; US: 2007. [Google Scholar]
- Jancey JM, Lee AH, Howat PA, Clarke A, Wang K, Shilton T. The effectiveness of a physical activity intervention for seniors. Am J Health Promot. 2008;22(5):318–321. doi: 10.4278/ajhp.22.5.318. [DOI] [PubMed] [Google Scholar]
- Johnson DW, Johnson FP. Joining Together: Group Theory and Group Skills. Upper Saddle River, NJ: 2012. [Google Scholar]
- Kahn EB, Ramsey LT, Brownson RC, Heath GW, Howze E, Powell KE, Stone EJ, Rajab MW, Corso P. The effectiveness of interventions to increase physical activity: A systematic review. American Journal of Preventive Medicine. 2002;22(4 suppl):73–107. doi: 10.1016/s0749-3797(02)00434-8. [DOI] [PubMed] [Google Scholar]
- Kassavou A, Turner A, French DP. Do interventions to promote walking in groups increase physical activity? A meta-analysis. Int J Behav Nutr Phys Act. 2013;10:18. doi: 10.1186/1479-5868-10-18. [DOI] [PMC free article] [PubMed] [Google Scholar]
- Kodama S, Tanaka S, Saito K, Shu M, Sone Y, Onitake F, Suzuki E, Shimano H, Yamamoto S, Kondo K, Ohashi Y, Yamada N, Sone H. Effect of aerobic exercise training on serum levels of high-density lipoprotein cholesterol: a meta-analysis. Arch Intern Med. 2007;167(10):999–1008. doi: 10.1001/archinte.167.10.999. [DOI] [PubMed] [Google Scholar]
- Kristman V, Manno M, Cote P. Loss to follow-up in cohort studies: how much is too much? Eur J Epidemiol. 2004;19(8):751–760. doi: 10.1023/b:ejep.0000036568.02655.f8. [DOI] [PubMed] [Google Scholar]
- Lee RE, O'Connor DP, Smith-Ray R, Mama SK, Medina AV, Reese-Smith JY, Banda JA, Layne CS, Brosnan M, Cubbin C, McMillan T, Estabrooks PA. Mediating effects of group cohesion on physical activity and diet in women of color: health is power. Am J Health Promot. 2012;26(4):e116–125. doi: 10.4278/ajhp.101215-QUAN-400. [DOI] [PMC free article] [PubMed] [Google Scholar]
- Lyles CM, Crepaz N, Herbst JH, Kay LS. Evidence-based HIV behavioral prevention from the perspective of the CDC's HIV/AIDS Prevention Research Synthesis Team. AIDS Educ Prev. 2006;18(4 Suppl A):21–31. doi: 10.1521/aeap.2006.18.supp.21. [DOI] [PubMed] [Google Scholar]
- Manson JE, Greenland P, LaCroix AZ, Stefanick ML, Mouton CP, Oberman A, Perri MG, Sheps DS, Pettinger MB, Siscovick DS. Walking compared with vigorous exercise for the prevention of cardiovascular events in women. N Engl J Med. 2002;347(10):716–725. doi: 10.1056/NEJMoa021067. [DOI] [PubMed] [Google Scholar]
- Marshall SJ, Jones DA, Ainsworth BE, Reis JP, Levy SS, Macera CA. Race/ethnicity, social class, and leisure-time physical inactivity. Med Sci Sports Exerc. 2007;39(1):44–51. doi: 10.1249/01.mss.0000239401.16381.37. [DOI] [PubMed] [Google Scholar]
- Moore LV, Diez Roux AV, Nettleton JA, Jacobs DR., Jr Associations of the local food environment with diet quality--a comparison of assessments based on surveys and geographic information systems: the multi-ethnic study of atherosclerosis. Am J Epidemiol. 2008;167(8):917–924. doi: 10.1093/aje/kwm394. [DOI] [PMC free article] [PubMed] [Google Scholar]
- Mujahid MS, Diez Roux AV, Morenoff JD, Raghunathan TE, Cooper RS, Ni H, Shea S. Neighborhood characteristics and hypertension. Epidemiology. 2008;19(4):590–598. doi: 10.1097/EDE.0b013e3181772cb2. [DOI] [PubMed] [Google Scholar]
- Murphy MH, Murtagh EM, Boreham CA, Hare LG, Nevill AM. The effect of a worksite based walking programme on cardiovascular risk in previously sedentary civil servants [ NCT00284479] BMC Public Health. 2006;6:136. doi: 10.1186/1471-2458-6-136. [DOI] [PMC free article] [PubMed] [Google Scholar]
- Murphy MH, Nevill AM, Murtagh EM, Holder RL. The effect of walking on fitness, fatness and resting blood pressure: a meta-analysis of randomised, controlled trials. Prev Med. 2007;44(5):377–385. doi: 10.1016/j.ypmed.2006.12.008. [DOI] [PubMed] [Google Scholar]
- Murphy SL, Xu JQ, Kochanek KD. Deaths: Preliminary data for 2010. TABLE 1: Death and death rates by age, sex, and race and Hispanic origin and age adjusted death rates, by sex and race and Hispanic origin: United States, final 2009 and preliminary 2010. NVS Report. 2012;60:9–16. [Google Scholar]
- Ogilvie D, Craig P, Griffin S, Macintyre S, Wareham NJ. A translational framework for public health research. BMC Public Health. 2009;9:116. doi: 10.1186/1471-2458-9-116. [DOI] [PMC free article] [PubMed] [Google Scholar]
- Perry CK, Rosenfeld AG, Bennett JA, Potempa K. Heart-to-Heart: promoting walking in rural women through motivational interviewing and group support. J Cardiovasc Nurs. 2007;22(4):304–312. doi: 10.1097/01.JCN.0000278953.67630.e3. [DOI] [PubMed] [Google Scholar]
- Rogers T. PhD. University of Oregon; 1997. Effectiveness of a Walking Club and a Self-Directed Physical Activity Program in Increasing Moderate Intensity Physical Activity among African-American Females. [Google Scholar]
- Rossi PH, Freeman HE, Lipsey MW. Evaluation: A Systematic Approach. Thousand Oaks, CA: Sage; 1999. [Google Scholar]
- Sallis JF, Cervero RB, Ascher W, Henderson KA, Kraft MK, Kerr J. An ecological approach to creating active living communities. Annu Rev Public Health. 2006;27:297–322. doi: 10.1146/annurev.publhealth.27.021405.102100. [DOI] [PubMed] [Google Scholar]
- Sallis JF, Floyd MF, Rodriguez DA, Saelens BE. Role of built environments in physical activity, obesity, and cardiovascular disease. Circulation. 2012;125(5):729–737. doi: 10.1161/CIRCULATIONAHA.110.969022. [DOI] [PMC free article] [PubMed] [Google Scholar]
- Schiller JS, Lucas JW, Ward BW, Peregoy JA. Summary health statistics for U.S. adults: National Health Interview Survey, 2010. Vital Health Stat. 2012;10(252):1–207. [PubMed] [Google Scholar]
- Schulz AJ. Urban environments and health. In: Nriagu J, editor. Encyclopedia of Environmental Health. Burlington, MA: Elsevier; 2011. pp. 549–555. [Google Scholar]
- Schulz AJ, Israel BA, Coombe C, Gaines C, Reyes A, Rowe Z, Sand S, Strong L, Weir S. A community-based participatory planning process and multilevel intervention design: Toward eliminating cardiovascular health inequities. Health Promotion Practice. 2011 doi: 10.1177/1524839909359156. in press. [DOI] [PMC free article] [PubMed] [Google Scholar]
- Services, U. D. o. H. a. H. Be Active, Healthy, and Happy. H. H. Services; Washington, D.C: 2008. Physical guidelines for Americans. [Google Scholar]
- Services USDoHaH. Prevalence of self-reported physically active adults--United States, 2007. MMWR Morb Mortal Wkly Rep. 2008;57(48):1297–1300. [PubMed] [Google Scholar]
- Southeast Michigan Council of Governments. Population and Housing in Southeast Michigan 2000–2006. 2006 Sep; Retrieved September, 2006, from www.semcog.org.
- Sugrue TJ. The Origins of the Urban Crisis: Race and Inequality in Postwar Detroit. Princeton, NJ: Princeton University Press; 1996. [Google Scholar]
- Swartz AM, Strath SJ, Bassett DR, Moore JB, Redwine BA, Groer M, Thompson DL. Increasing daily walking improves glucose tolerance in overweight women. Prev Med. 2003;37(4):356–362. doi: 10.1016/s0091-7435(03)00144-0. [DOI] [PubMed] [Google Scholar]
- Tudor-Locke C, Johnson WD, Katzmarzyk PT. Frequently reported activities by intensity for U.S. adults: the American Time Use Survey. Am J Prev Med. 2010;39(4):e13–20. doi: 10.1016/j.amepre.2010.05.017. [DOI] [PubMed] [Google Scholar]
- Tully MA, Cupples ME, Chan WS, McGlade K, Young IS. Brisk walking, fitness, and cardiovascular risk: a randomized controlled trial in primary care. Prev Med. 2005;41(2):622–628. doi: 10.1016/j.ypmed.2004.11.030. [DOI] [PubMed] [Google Scholar]
- Warren BS, Maley M, Sugarwala LJ, Wells MT, Devine CM. Small Steps Are Easier Together: a goal-based ecological intervention to increase walking by women in rural worksites. Prev Med. 2010;50(5–6):230–234. doi: 10.1016/j.ypmed.2010.02.006. [DOI] [PubMed] [Google Scholar]
- Williams PT, Thompson PD. Walking versus running for hypertension, cholesterol, and diabetes mellitus risk reduction. Arterioscler Thromb Vasc Biol. 2013;33(5):1085–1091. doi: 10.1161/ATVBAHA.112.300878. [DOI] [PMC free article] [PubMed] [Google Scholar]
- Wilson MG, Basta TB, Bynum BH, DeJoy DM, Vandenberg RJ, Dishman RK. Do intervention fidelity and dose influence outcomes? Results from the move to improve worksite physical activity program. Health Educ Res. 2010;25(2):294–305. doi: 10.1093/her/cyn065. [DOI] [PubMed] [Google Scholar]
- Wong MD, Shapiro MF, Boscardin WJ, Ettner SL. Contribution of major diseases to disparities in mortality. New England Journal of Medicine. 2002;347(20):1585–1592. doi: 10.1056/NEJMsa012979. [DOI] [PubMed] [Google Scholar]
- Zoellner J, Connell C, Powers A, Avis-Williams A, Yadrick K, Bogle ML. Does a six-month pedometer intervention improve physical activity and health among vulnerable African Americans? A feasibility study. J Phys Act Health. 2010;7(2):224–231. doi: 10.1123/jpah.7.2.224. [DOI] [PubMed] [Google Scholar]