

Abstract
BALB/cJ mice housed under normal vivarium lighting conditions can exhibit profound retinal abnormalities, including retinal infoldings, autofluorescent inflammatory cells, and photoreceptor degeneration. To explore the sensitivity of the outer retina to cyclic lighting during aging, a cohort of BALB/cJ mice was evaluated with Scanning Laser Ophthalmoscopy (SLO), Spectral-Domain Optical Coherence Tomography (OCT) and conventional histopathology. Mice were bred and reared in a low-illuminance (extracage/intracage: 13 lx/1 lx) vivarium under cyclic light (14 h light: 10 h dark). Retinal imaging (around postnatal day 70) was performed to screen for any pre-existing abnormalities and to establish a baseline. Mice with normal retinas were separated into groups (A, B, C) and placed on bottom (Groups A & B) or top (Group C) of the cage racks where cage illumination was <10 & 150 lx respectively. Experimental groups B & C were imaged multiple times over a 17 month period. Mice from group A (controls) were imaged only once post-baseline at various times for comparison to groups B & C. Mice were assessed by histology at 8, 15, 20, 36, and 56 weeks and immunohistochemistry at 15 weeks post-baseline. SLO and OCT retinal images were measured and the resulting trends displayed as a function of age and light exposure. Retinal lesions (RL) and autofluorescent foci (AFF) were identified with histology as photoreceptor layer infoldings (IF) and localized microglia/macrophages (MM), respectively. Few RL and AFF were evident at baseline. Retinal infoldings were the earliest changes followed by subjacent punctate autofluorescent MM. The colocalization of IF and MM suggests a causal relationship. The incidence of these pathological features increased in all groups relative to baseline. OCT imaging revealed thinning of the outer nuclear layer (ONL) in all groups at 1 year relative to baseline. ONL thinning followed an exponential rate of change but the decay constant varied depending on intensity of illumination of the groups. Advanced age and top row illuminance conditions resulted in significant photoreceptor cell loss as judged by decreased thickness of the ONL. Photoreceptor loss was preceded by both retinal infoldings and the presence of autofluorescent inflammatory cells in the outer retina, suggesting that these changes are early indicators of light toxicity in the BALB/cJ mouse.
Keywords: BALB/c, Mice, Imaging, Retina, Degeneration, Infolding, Inflammation, Phototoxicity
1. Introduction
The BALB/c mouse has been used in the laboratory for over a century (JAX® Notes Issue 443, 1990). Initially referred to as “Bagg” mice, this strain became an inbred line in the early 1920's and is now one of the most popular breeds of laboratory mice used in medical research (Mouse Genome Informatics Web Site, 2013). This line is available from multiple vendors worldwide, each of which can be traced back to the original Bagg line (Potter, 1985). Numerous substrains have emerged including BALB/cBy, BALB/cGaJ, BALB/cGrRkJ, BALB/cWtEiJ, and BALB/cByJ, which can be obtained from The Jackson Laboratories; BALB/cAnNTac from Taconic Farms; BALB/cAnNHsd from Harlen Laboratories; and BALB/cN from the National Institutes of Health (NIH). The Jackson Laboratory lists BALB/cJ and BALB/cByJ substrains as two of their most popular JAX® Mice, which account for 10% (2/20) of inbred mice sold under this designation (JAX® Notes Issue 488, 2002; JAX® Mice, 2013).
The BALB/c mouse is also widely used in vision research. Studies employing this line have provided an understanding of the role of both environmental and genetics on some forms of retinal degeneration. Previous studies have demonstrated that BALB/c mice are susceptible to light damage in comparison to true albino mice (C57Bl/6J-c2J), which are resistant (Ginsberg, 1985; LaVail et al., 1987a, 1987b). One of the underlying reasons for this susceptibility pointed to a mutation in the RPE65 protein. RPE65 is the retinol isomerase that converts all-trans-retinol to the 11-cis configuration in the retinal pigmented epithelium and is required for normal visual cycle function (Danciger et al., 2000). The mutation involves a single base change (leucine to methionine) of codon 450 in the RPE65 protein (Danciger et al., 2000). The substitution has been shown to alter retinol isomerase activity and significantly interfere with the regeneration of rhodopsin in affected (BALB/c) vs. unaffected (C57Bl/6J-c2J) mice (Nusinowitz et al., 2003; Wenzel et al., 2001). Researchers use BALB/c mice to pursue studies investigating this phenomenon to better understand the biochemical and genetic processes involved with photon-induced retinal degeneration (Lyubarsky et al., 2005; Montalban-Soler et al., 2012; Narimatsu et al., 2013). More recently, the model has been employed for studies of human diseases like AMD (Cruz-Guilloty et al., 2013; Hollyfield et al., 2008), the protective effects of light preconditioning on oxidative stress (Chollangi et al., 2009; Kaldi et al., 2003; Ueki et al., 2008), and cytokine mediated inflammatory responses induced by phototoxicity (Narimatsu et al., 2013; Santos et al., 2010; Zhang et al., 2005).
Despite the extensive amount of research already conducted on BALB/c, there is still much to be discovered. Previously, histology has been the primary assay for defining retinal changes that occur in this mouse line. We have previously shown through live animal imaging that BALB/cJ and BALB/cAnNTac mice housed under normal vivarium illumination exhibited profound retinal abnormalities at very early ages (Bell et al., 2012). To further explore the influence of cyclic lighting illuminance levels on the retina during aging, a cohort of mice was followed with Confocal Scanning Laser Ophthalmoscopy (SLO), Spectral-Domain Optical Coherence Tomography (OCT) and conventional histology to define the dynamics of these retinal changes over time.
2. Materials and methods
2.1. Animal models and vivarium housing conditions
The Cleveland Clinic-Lerner College of Medicine Institutional Animal Care and Use Committee (IACUC) approved all experimental procedures and protocols. BALB/cJ mice were obtained from The Jackson Laboratory (Bar Harbor, ME). Each shipment of BALB/cJ mice underwent a routine quarantine period for approximately 3 days upon receipt. Afterwards, animals were relocated from the institutional quarantine vivarium to a low-illuminance vivarium. The low-illuminance vivarium was similar to the quarantine and standard vivarium but employed neutral density filtering (Bronze Acrylic 2370 Pexiglas, ePlastics, San Diego, CA) to attenuate room illuminance levels. For experiments, a portion of mice (controls) were kept in the low-illuminance vivarium while others (treatment groups) were moved to a standard vivarium for exposure to higher illuminance levels. The quarantine, standard and low-illuminance vivariums had mean ± standard deviation illuminance levels, measured 1 m above the floor from several (n = 9) locations, of 280 ± 44, 203 ± 133, and 22 ± 5 lux (lx), respectively.
The standard vivarium contained two recessed lighting fixtures, each housing two compact fluorescent bulbs (Type GEF32T8/SPX41/ECO, 32W, 4100k), covered by translucent polystyrene diffusers. For animal housing the room contained two positive air ventilation racks (Model #MD75JU14OETMVP, Allentown Caging Equipment Co, Allentown, NJ, USA). The overall height of the cage racks was 6′6″ which placed the top cages 18″ directly under and parallel to the fluorescent lighting fixtures. The top of the cage rack did not contain an opaque shield to prevent direct, overhead illumination of cages placed on the top row. In contrast, cages below the top rows are fully protected because of stainless steel support shelves.
Mice were housed in RaTemp 400 cages with Polysulfone water bottles, wire bar lids, and micro-barrier filter covers (Allentown Caging Equipment Co). All caging materials, with exception to the filter material and bar lids, were made of translucent, yellow tinted plastic. Chipped corncob and a single cotton square (6 cm2) were provided for cage floor covering and bedding enrichment, respectively. Mice were permitted access to huts that were either semi-translucent amber or translucent red and were randomly provided at each cage change. Room lighting in all vivariums was set to a light/dark cycle ratio of 14/10 h. Food and water were supplied ad libitum. Both the low-illuminance and standard vivariums contained lighted, laminar flow exhaust hoods for cage changes on a bimonthly interval. The standard and low-illuminance room hood illuminance levels were measured (n = 5) to be 801 ± 135 and 39 ± 7 lx respectively, at work level. The illuminance level for the hood in the low-illuminance vivarium was attenuated using permanently installed red film that permitted only long, red wavelengths from the visible spectrum to be transmitted. Only in-house bred progeny were used for experiments aimed at studying the dynamics of retinal pathology in BALB/cJ mice.
2.2. Equipment
2.2.1. Imaging equipment
Retinal imaging was performed using SLO, OCT and TEFI (topical endoscopic fundus imaging system, also known as conventional fundus imaging) systems. SLO (HRA2, Heidelberg Engineering) is capable of collecting both reflectance and fluorescence information from the posterior segment of the mouse (Seeliger et al., 2005). Equipped with a 55° wide-field objective lens, the system provides an estimated field of view of ~1.6 mm in mice (Kocaoglu et al., 2007). Infrared (“IR-SLO”, λ = 795 nm, Power = 45±4 µW) and autofluorescence (“AF-SLO”, λ = 488 nm, Power = 186 ± 12 µW) modes were used to image the fundus. Online algorithms within the HRA2 system software enabled automatic real-time tracking (ART) and mean averaging of sequentially collected images to further enhance signal-to-noise ratio, especially when using AFSLO mode. A manual, z-axis, focus adjustment knob on the system permitted linear, axial translation of the SLO confocal imaging plane (Paques et al., 2006). This feature enabled focal plane advancement through the retina, albeit with relatively low axial spatial resolution (Maass et al., 2007; Paques et al., 2006). Retinal pigmented epithelium/choroidal complex (RPE/CC) and vitreo-retinal (VRI) interfaces are easily identified and serve as reference points for notation of the anterior and posterior retina margins (Paques et al., 2006). The adjustable focus was used routinely for identifying and documenting retinal pathology observed using both infrared (IR-SLO) and autofluorescence (AF-SLO) imaging modes (Bell et al., 2012).
OCT is an instrument that provides volumetric, in-depth high-resolution images of retinal tissue morphology [25] and was first described in mice by Jiao et al., 2007 (Jiao et al., 2007). Briefly, the system (840HR SDOIS, Bioptigen) has a center operating wavelength of ~840 nm (Power = 503 ± 55 µW), spectral bandwidth of 65 nm and axial, in-depth resolution of 6–7 µm [26]. Images were collected with a 50° field of view objective which provides a lateral resolution of ~2.5 µm and fundus field of view of ~1.5 mm (Pennesi et al., 2012).
Conventional fundus images were collected using a custom fabricated apparatus that has been previously described (Paques et al., 2007), but was modified to include a high-definition camera (Model Image 1 HD H3-Z, Karl Storz, Inc., El Segundo, CA) with pixel dimensions of 1920 × 1080.
2.2.2. Optical measurement equipment
Light intensity was measured using a calibrated Nova optical power/energy readout unit (Ophir-Spiricon LLC, N. Logan, UT) with 2 different photodiode sensor heads specifically designed to measure either optical power (PD300-3W) or illuminance (PD300-CIE). Vivarium room illuminance (lx) levels were measured using the PD300-CIE. The laser and superluminescent light emitting diode sources, located in the SLO and OCT systems respectively, were measured using the PD300-3W. All power measurements, collected at the system output after the imaging objective, were made in multiplicity (n = 9) and averaged over an acquisition period of 30 s.
2.3. Experimental design
2.3.1. Experiments to characterize and identify of BALB/c retinal pathology
Several mice (n = 6♂) were used to demonstrate imaging techniques for detecting and revealing retinal lesions and auto-fluorescent foci by IR-SLO, AF-SLO and OCT imaging modalities.
2.3.2. Experiment to compare purchased vs. in-house reared BALB/c mice
JAX® labs purchased (n = 19♀) vs. in-house reared BALB/cJ mice (n = 19; 10♂, 9♀) were imaged using SLO and OCT at 9 weeks (±1 wk) of age to quantify RL, AFF and outer nuclear layer (ONL) thickness. Results from only one eye (OD) were used to compare and contrast the status of retinal condition at this young adult age in these two groups of mice.
2.3.3. Experiment to elucidate the dynamics of BALB/c retinal pathology
Baseline imaging was performed in all in-house, low-illuminance vivarium reared mice (n = 58 total) at 9 weeks (±1 wk) of age. Mice were then subdivided into three groups (A, B, & C) and housed in the low-illuminance (Group A) or standard vivarium (Groups B & C). In the standard vivarium, Groups B & C were placed on the bottom or top row of the cage rack assembly, respectively. Mice from Group A (n = 37; 13♂ & 24♀) were imaged only once post-baseline at one of the following time points: 1, 2, 3, 4, 6, 8, 10, 15, 20, 25, 40, & 94 weeks. Groups B (n = 8; 4♂ & 4♀) & C (n = 13 ♂) were imaged multiple times post-baseline at 1, 2, 3, 4, 6, 8, 10, 12, 15, 20, 25, 35, & 48 weeks. Extra and intracage illuminance parameters for each treatment group were measured and are shown in Table 1.
Table 1.
Experimental study details including treatment group and intra- and extracage vivarium illuminance levels.
| Treatment group |
Vivarium | Cage location | Illuminance measurement location |
Samples (#) | Illuminance (lx) (mean ± sd) |
Minimum (lx) | Percentile (lx) |
Maximum (lx) | |
|---|---|---|---|---|---|---|---|---|---|
| 25% | 75% | ||||||||
| A | Low-illuminance | Sub top row | Extracagea | 30 | 13 ± 4 | 7 | 10 | 15 | 24 |
| Intracage | 60 | 1.2 ± 1.7 | 0.2 | 0.3 | 1.5 | 7.4 | |||
| B | Standard | Bottom row | Extracagea | 30 | 88 ± 20 | 51 | 70 | 100 | 130 |
| Intracage | 72 | 7 ± 7 | 0.3 | 3 | 11 | 25 | |||
| C | Standard | Top row | Extracageb | 38 | 1406 ± 343 | 157 | 1174 | 1638 | 1895 |
| Intracage | 96 | 151 ± 79 | 22 | 90 | 195 | 355 | |||
Measured from exposed cage outward facing side.
Measured from directly above exposed cage top.
2.4. Animal preparation and imaging procedures
Animal preparation and imaging procedures have been previously reported (Bell et al., 2014, 2012). Briefly, pupil dilation was induced prior to anesthesia using 0.5% (0.5 µl) Mydrin®-P Tropicamide/Phenylephrine combination drops (Santen Pharmaceutical Co., Ltd, Japan). Nembutal® Sodium Pentobarbital (65–68 mg/kg) was administered IP for general anesthesia. BSS and Systane Ultra fluids were employed in conjunction with custom designed protective eye shields to maintain corneal hydration and minimize media opacities (Bell et al., 2014; Ridder et al., 2002). SLO imaging was performed first followed immediately by OCT. Fundus images were obtained only once to compare and contrast with images obtained by SLO. Images were acquired primarily with the optic disk centrally located within the field of view. OCT images acquired included radial (1000 A-scans/B-scan @ 0 & 90°) and volumetric (250 B-scans/volume × 250 A-scans/B-scan) scans with the optic nerve centrally positioned. After imaging, both eyes received Bacitracin Zinc and Polymyxin B Sulfate ophthalmic ointment (Bausch & Lomb, Inc., Tampa, FL) and were placed in a bottom-warmed (33–36 °C), oxygenated (21–60%) chamber (V711801, Surgivet, Inc. Dublin, OH) for recovery.
2.5. Image analysis
Temporal changes to retinal pathology documented by SLO and OCT images were analyzed using ImageJ v1.47b (Rasband, 1997–2012). Retinal lesions (RL), both hyporeflective and hyper-reflective in appearance, and autofluorescent foci (AFF) were manually counted from SLO images to obtain a mean number for each eye. Outer nuclear layer (ONL) thicknesses were measured from one location on opposite sides of the optic nerve, approximately half-way between the nerve head and image frame limit. RL, AFF, & ONL data were averaged to obtain group means and standard deviations (Mean ± SD) for each imaging time point. Graphpad Prism version 6.0a (Graphpad Software, La Jolla, CA, USA) was used for plotting the data (Mean ± 95% CI) and regression lines (polynomial or exponential) were applied to display the dynamic trends in findings.
Co-registration of RL and AFF in SLO images was accomplished by importing TIFF images into ImageJ, subtracting the background with a rolling ball radius of “100”, followed by an automatic brightness and contrast adjustment. The two channels were then merged to produce a red-green color composite image of colocalized RL and AFF.
2.6. Statistical methods
No statistical analysis was performed on animals used to demonstrate SLO and OCT imaging techniques for revealing RL and AFF. For the purchased vs. in-house reared BALB/c mouse experiment, RL and AFF counts obtained by IR- and AF-SLO were analyzed using an unpaired t test to obtain two-tailed p values. OCT measures of retinal quadrants between purchased and reared mice were analyzed using a multiple t test and statistical significance determined using the Holm-Sidak method to correct for multiple comparisons (alpha = 5%). Graphpad Prism was used for both displaying/plotting data and statistical analysis with p values of <0.05 considered significant.
Data from the long-term dynamic experiment was analyzed (SAS version 9.3, SAS Institute Inc., Cary, NC, USA) using repeated measures mixed model regression analysis to adjust for the repeated measures (i.e. two eyes per mouse) within test animals. Pairwise comparisons of response means were made between Groups A, B, and C eye measurements at specific time points (BL, 1, 2, 3, 4, 6, 8, 10. 15, 20, 25 weeks). Pairwise comparisons of response means were also made between Groups A & B, in absence of Group C, data at specific time points (BL,1, 2, 3, 4, 6, 8,10.15, 20, 25 weeks). Bonferroni corrections were made for multiple pairwise means comparisons. Pairwise comparisons of means with p < 0.05 were considered statistically significant.
2.7. Immunohistochemistry
Eyes were collected at 15 (n = 18) weeks post-baseline to evaluate for the presence of inflammatory monocytes with immunostaining (Xu et al., 2008, 2007). Enucleated eyes were fixed briefly (~30 min) in 4% Paraformaldehyde. Retina was separated from RPE and choroid and stored in blocking buffer (PBS+ 1% BSA+0.1% TX100). Samples were then incubated in anti-IBA1 (ionized calcium-binding adapter molecule 1) in the same blocking buffer and Phalloidin-TRITC to reveal microglia/macrophages and RPE cells, respectively. Whole flatmounts were prepared on glass slides and imaging was performed using epifluorescence microscopy (Carl Zeiss Axio Imager Z1) and/or confocal imaging (Leica TCS SP2).
2.8. Histology
Eyes were collected at 15 (n = 18), 17 (n = 10), 20 (n = 9), 36 (n = 4), and 56 (n = 4) weeks post-baseline for evaluation of retinal morphology. Histological processing has been previously described (Hollyfield et al., 2008). Briefly, eyes were enucleated, fixed in 2%-glutaraldehyde/2.5%-formaldehyde, EPON embedded, sections cut (~1 µm thick), transferred to glass slides and stained with Toluidine Blue O. Tissue sections were viewed with light microscopy (Carl Zeiss Axio Imager Z1).
2.9. PCR screening and genotyping
Genotyping for rd-8 utilized the following primers: mCrb1 mF1 – GTGAAGACAGCTACAGTTCTGATC, mCrb1 mF2 -GCCCCTGTTTGCATGGAGGAAACTTGGAAGACAGCTACAGTTCTTCTG and mCrb1 mR – GCCCCATTTGCACACTGATGAC. PCR reactions were performed using a GeneAmp PCR System 9700 (PE Applied Biosystems) under the following conditions: denaturation at 94° for 5 min, amplification for 35 cycles at (94 °C–30 s, 65 °C–30 s, 72 °C–30 s) and a final extension at 72 °C for 7 min. PCR products were separated by electrophoresis in a 4% agarose gel. A molecular ladder (Bio-rad) was added to each gel for product size estimation. EZ Vision One, (Amresco) both a DNA dye and loading buffer, 6x, was added to final PCR products. The WT allele size produced a 220bp band, visualized under UV light using a Syngene G:Box (Synoptics).
PCR for rd-7 genotyping included these 4 primers: rd7n-F1 – GTAGCCTCTCCTGCTCTGGCAG; rd7n-R2 – TCCCACTGTCACTGCCCTAAC rd7m-F1 – GCACTGGGCGTGGATACT and rd7m-R1 – GGTAAGGGGGACTTTTGGT. PCR conditions were as follows: denature at 97 °C–3 min; amplify for 5 cycles at (97 °C for 20 s and 60 °C for 30 s); amplify a second time for 40 cycles at (95 °C, −10 s, 50 °C–30 s and 72 °C for 30 s); final extension at 72 °C for 3 min and then cool at 11 °C. Gel electrophoresis was carried out in 2% agarose gels and visualized as described above. WT reaction (rd7n) bands migrated to 540bp.
PCR for rd-6 genotyping were run with 2 primers: Exon3-4F – CTGGCATGGTAAGCCCC and Exon3-4R – GGGATCAGAGGTCAGAGGTC.
Conditions included: denature at 98 °C –30 s, amplify for 35 cycles at (98 °C–5 s, 63 °C–15 s, 72 °C–30 s); final extension at 72 °C–7 min. Digestion with DrdI follows precipitation of the PCR product and resuspension in the reaction mix. The WT reaction, visualized as described above, yields both 513bp and 118bp bands.
Primers for the membrane-type frizzled related protein (MFRP) include: #1 AAGCCCACTGTGTCCTCCCTACAGCCCAGCGCCTCC and #2 GCCCTGCAACTCTGGAGGCTAGGTATAGAGG. PCR conditions were as follows: denature at 94C–3 min, Amplify for 35 cycles at (94C–30 s, 60C–30 s, 72C–90 s); final extension at 72C for 10 min. The reaction products are then digested with BgII and visualized as above with WT 249bp bands.
Genotyping for the retinal pigment epithelial protein RPE65 polymorphism utilized the following primer pair: up, 5′ –CTG ACA AGC TCT GTA AG-3; and down, 5′- CAT TAC CAT CAT CTT CTT CCA-3′ . Amplification included 35 cycles at (94 °C- 30 s, 52 °C- 60 s, 72 °C- 60 s). PCR products were then digested with AluI, which, in BALB/c mice, produced 3 products of 109, 9 and 8bp. Electrophoresis was carried out on digested and undigested PCR products on an 8% polyacrylamide gel.
3. Results
3.1. Characterization and identification of BALB/c retinal pathology
In our initial analysis of retinal lesions in BALB/c mice we observed two primary types of retinal changes (Bell et al., 2012). One type observed with SLO was represented by circular, “blisterlike” spots at the level of the outer nuclear layer in multiple foci throughout the fundus. In histological sections, these spots consisted of focal elevations of the outer nuclear layer with associated photoreceptor inner and outer segments lifted away from the RPE. The second lesion type also evident with SLO consisted of bright focal autofluorescent spots in the fundus. Histological analysis of these spots revealed the presence of single cells at the level of the RPE, which were either microglia or macrophage. Two SLO imaging techniques were applied for optimal visualization of these lesion types. Fig. 1A demonstrates the approach used to visualize outer retinal elevations, which involves using different focal adjustments to produce a dioptric shift in the instrument focus plane. The HRA2 focus is a linear, calibrated adjustment that is reported as optical focusing power (diopters). In a cohort of mice (n = 13), we obtained a mean difference of 48 ± 6 Diopters (Mean ± SD) between the vitreoretinal interface and the RPE-choroid complex using IR-SLO. OCT imaging of these mice revealed that the distance separating these same anatomical landmarks was 192 ± 6 µm (Mean ± SD), which represents the approximate thickness of the retina. From this data we determined the SLO focus translation distance per unit Diopter (D) was ~4 µm/D (192 µm/48 D). At 9 weeks of age, during baseline imaging, the mean focus setting (Mean ± SD) for collecting IR “focused” and IR “defocused” images was 18.6 ± 3.8 vs. 31 ± 4.2 D, respectively (n = 35). Thus, the dioptric shift between “focused” and “defocused” conditions required for optimal visualization of RL was ~12.5 D. This shift equates to a change in focal plane distance of ~50 µm in the retina. As illustrated in Fig. 1A, the direction of this shift was towards the inner retina and more specifically, the external limiting membrane.
Fig. 1.
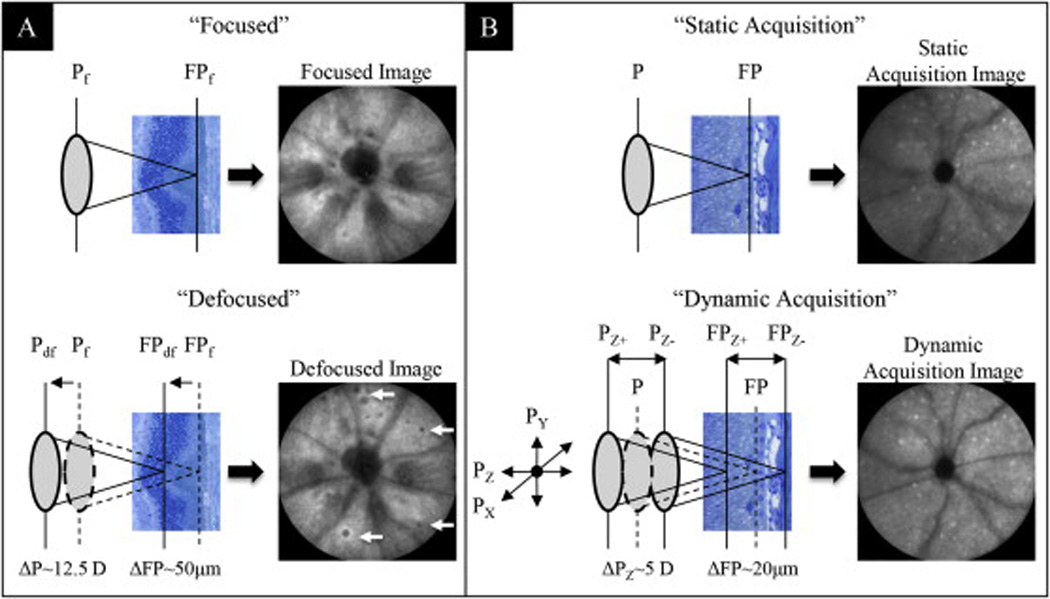
Image enhancement techniques for optimal visualization of RL (A) and AFF (B) in BALB/cJ mice. Two manual adjustment methods applied to the SLO Z-axis focus knob were used for optimization of image acquisition. Both methods enhanced the ability to detect abnormalities in the outer retina. In IR mode, focal setting adjustments from “Focused” to “Defocused” repositioned the confocal image plane from the RPE/Choroid complex to a more proximal location in the photoreceptor layer. This adjustment enhanced the ability to visualize RL (arrows). In AF mode, axial focus manipulation involved manually rocking the Z-axis (Pz) focus knob back and forth while acquiring the image with the automated realtime tracking and averaging (25 frames) function activated. This method enhanced the ability to capture an image of uniform intensity as well as improve the ability to visualize AFF (white punctate foci) in the outer retina.
The technique used for visualizing the autofluorescent cells in the outer retina is shown in Fig. 1b. It required performing a “dynamic image acquisition” as opposed to a “static image acquisition”. Under a typical SLO image acquisition, the instrument is aligned to the mouse eye using the IR-SLO mode. IR-SLO mode has appreciable signal-to-noise and image contrast whereas AF-SLO is an extremely weak signal and requires image frame integration for retina autofluorescence detail. Due to the inherent difference in signal collection efficiency, IR-SLO is performed first followed immediately by AF-SLO. After collecting the IR-SLO image, the instrument is then quickly switched (e.g. via toggle lever on the SLO scan head) to AF-SLO to collect that image as well. The problem with this approach is that the SLO, optimized for collection of the IR-SLO image, may not necessarily be optimally aligned for collection of the AF-SLO image. Variations in optical pathway and focus location between the two modes can exist due to chromatic and/or spherical aberrations (Paques et al., 2006). To compensate for these variations we employed the “dynamic acquisition” technique when collecting the AF-SLO image (Fig.1B). This technique employs small, “back and forth” adjustments of the SLO X, Y and Z alignment positions (i.e. Px, Py, & Pz) to improve image quality. With the instrument operating in AF-SLO mode and ART activated, lateral (via the scan head carriage) and vertical (via the joy stick elevation control on the carriage) adjustments on the instrument are tweaked simultaneously using small side-to-side (x-axis) and updown (y-axis) adjustments. As one performs this biaxial adjustment the averaged image frame “fills in” and becomes more uniform. Once the image is optimized, the last step is to perform an axial, Z-axis adjustment with the SLO focus adjustment. This involves manually “rocking” the focus knob in clockwise and counterclockwise directions, which moves the focal plane back and forth from distal to proximal retinal depths. This technique allows one to discern and quantify AFF over the full SLO imaging field of view. The mean focus setting used at baseline for collecting AFF images was 16.7 ± 5.2 D (n = 35). The dynamic focusing region was empirically found to be a displacement of approximately ±2.5 D units, which corresponded to a change in focal integration distance of ±10 µm (±2.5 D units × 4 µm/D).
IR and AF SLO modes revealed the presence of focal outer retinal elevations (retinal lesions) and autofluorescent cells (autofluorescent foci), respectively, in the outer retinas of virtually every BALB/c mouse imaged to varying degree, depending on the light exposure history and/or cage location (i.e. elevation) on the cage rack system. Fig. 1A–C shows IR (Fig. 1A) and AF (Fig. 1B) SLO imaging findings from a BALB/cJ mouse housed for 20 weeks on the top row under standard vivarium lighting conditions (Table 1). Fig. 2A and Fig. 2B reveal the presence of numerous RL (~325) and AFF (~300), respectively. In contrast, conventional fundus imaging (Fig. 2C) does not reveal the outer retinal elevations or the inflammatory cells in these mice because BALB/c lacks RPE and choroidal pigment, providing no background contrast against which these retinal changes might be detected.
Fig. 2.
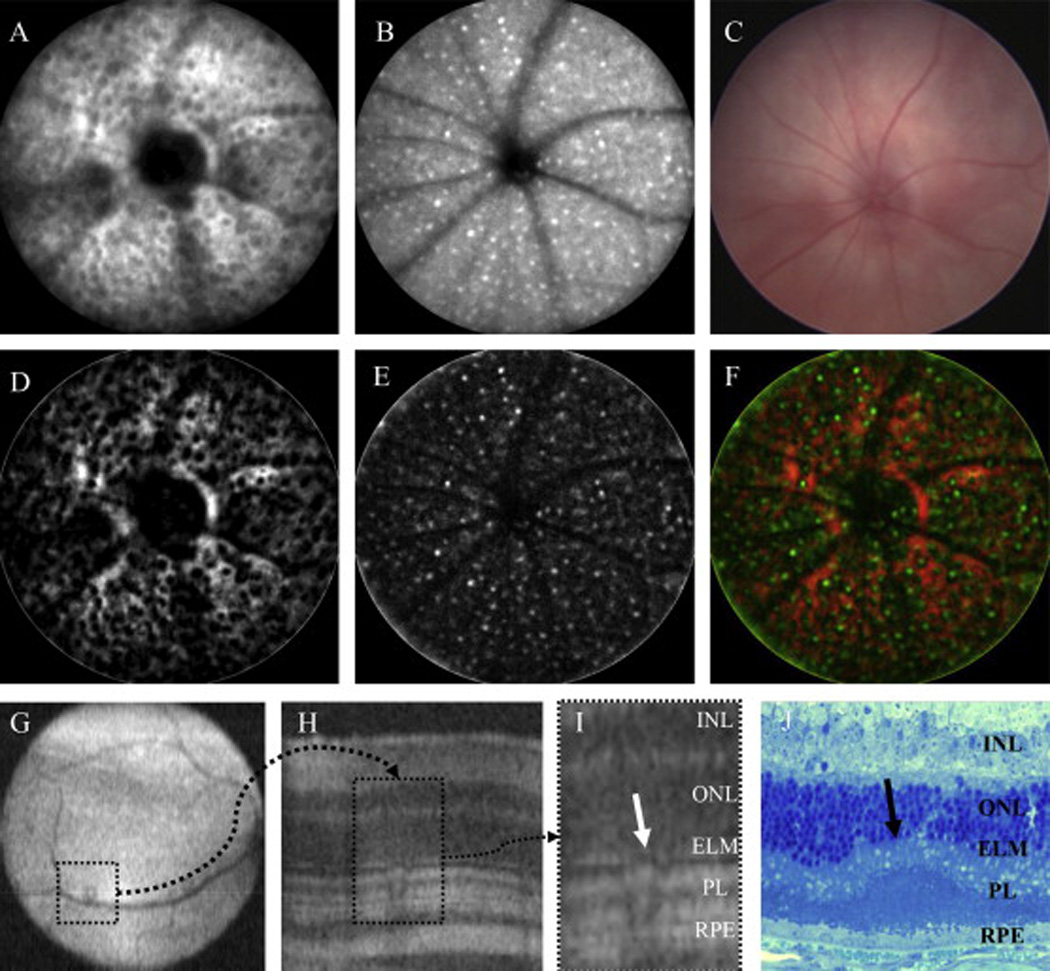
Multimodal imaging and processing to identify retinal pathology in the BALB/cJ mouse. Fig. 2A–C is a comparison between IR-SLO (A) and AF-SLO (B) and visible light fundus (C) images after 20 weeks of exposure to 150 lx cyclic-light conditions. SLO is highly sensitive at detecting widespread changes that occur in the outer retina as a result of light stress induced by ambient vivarium lighting conditions. Visible light fundus techniques are incapable of detecting these changes due a lack of contrast between the respective abnormalities and background caused by the lack of melanopigment in the RPE-choroid complex. Fig. 2C–F demonstrates coregistration of RL and AFF abnormalities, respectively, to show that they are interrelated (F). For this comparison Fig. 2A and B were processed in ImageJ to accentuate RL (D; dark regions on a red background) and AFF (E; bright pseudocolored green foci), respectively. An image merge (F) shows the amount of overlap observed between these two abnormalities detected by different SLO imaging modes. Fig. 2G–J demonstrates detection and confirmation of RL abnormalities by non-invasive OCT imaging and histomorphology techniques. Under optimal conditions, OCT imaging is also capable of visualizing SLO identified RL lesions (G; dotted square in OCT en face image) which show altered architecture (H; dotted rectangle in OCT B-scan) of the photoreceptor layer (I; ROI). Histomicrophotograph (J) from a different mouse shows a single photoreceptor infolding (arrow). As a result of these observations from multiple assessment techniques we are confident that RL observed using SLO are retinal photoreceptor infoldings. Infoldings appear to interfere with SLO image acquisition by disrupting the light signal collection efficiency that is returned from outer retina lamina, RPE and choroidal structures. (Fig. 2I, J abbrev: INL-inner nuclear layer, ONL-outer nuclear layer, ELM-external limiting membrane, PL-photoreceptor layer, RPE-retinal pigmented epithelium).
Our observations from SLO images suggest that RL and AFF are interrelated changes. An assessment used to confirm these observations is demonstrated in Fig. 2D–F using images from Fig. 2A and B. Fig. 2D and E shows RL and AFF from Fig. 2A and B respectively, after performing a background subtraction and auto-brightness/contrast adjustment. The enhanced images (Fig. 2D and E) are then pseudocolored and merged to show coregistration between RL (black circular spaces on red background) and AFF (green foci overlapping with black spaces) findings in Fig. 2F. In this example only small percentage of RL are observed to be free of AFF, which results in a high (>90%) colocalization ratio.
OCT imaging was employed to further characterize the findings identified by SLO. Fig. 2G–I shows an example of an RL observed by OCT imaging. Fig. 2G is an en face fundus image from a mouse kept in low-light conditions with one isolated RL in the inferior-nasal region. Fig. 2H is a B-scan bisecting the RL, which reveals the anomaly in the photoreceptor layer architecture relative to adjacent, normal retina. The anomaly, shown as a region of interest in Fig. 2I, impacts all layers of the photoreceptor including outer (OS) and inner (IS) segments and some displacement of the external limiting membrane (ELM). RL were typically easy to spot by OCT when population densities were low but were difficult, if not impossible, to discern when numerous in number. Similar to RL, we attempted to verify AF-SLO findings also using OCT but were unable to visualize AFF with this imaging technique.
3.2. Purchased versus in-house bred mice
BALB/cJ mice received directly from the vendor had significantly (RL/AFF: p = .0001) more abnormalities than mice (n = 19) reared in the low-illuminance vivarium at 9 weeks of age (Fig. 3A). RL and AFF counted were 12- and 22-fold higher respectively, in purchased (RL: 33.7 ± 12.5, AFF: 38.5 ± 16.8) vs. low-illuminance vivarium reared (RL: 2.8 ± 1.4, AFF: 1.7 ± 1.4) mice. At baseline with OCT imaging, newly purchased mice did not show significant differences in ONL thicknesses relative to low-illuminance vivarium reared mice for the four primary retinal regions (superior, inferior, temporal, nasal) imaged and analyzed (Fig. 3B).
Fig. 3.
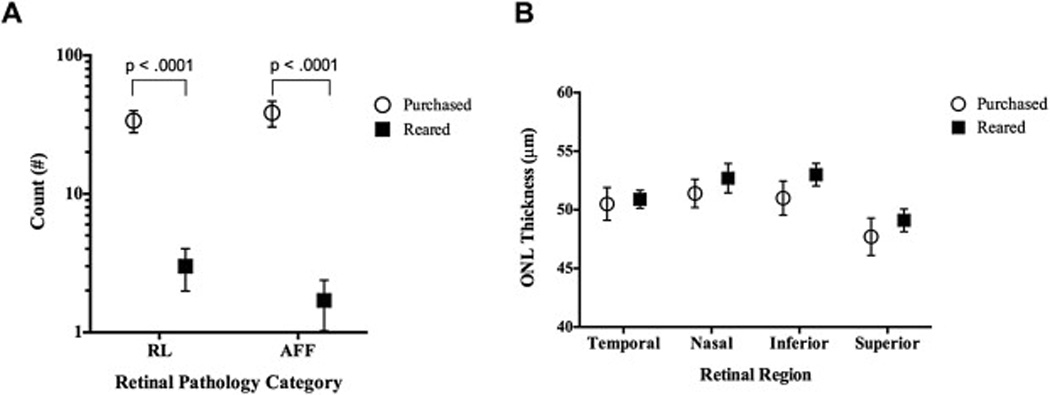
SLO and OCT results from BALB/cJ mice (Age: 9 ± 1 week) obtained from a reputable vendor compared to those reared in-house. Fig. 3A shows that mice from the vendor, which also went through an unregulated (i.e. light level >> 30 lx) quarantine period upon arrival, are compromised relative to animals that are born and reared in-house under low-light level (<30 lx) conditions. Purchased mice had significantly elevated levels of both RL and AFF relative to animals bred/reared in-house. OCT results (B) showed no significant differences in ONL thickness between the purchased vs. in-house reared mice.
3.3. Dynamics of retinal pathology
Non-invasive imaging methods permitted the ability to document changes in retinal pathology as a function of time. Representative SLO & OCT images from animals enrolled in this aging study are shown in Supplemental Figs. 1–5, respectively. RL detected at early observation times persisted for long periods in all treatment groups. In general, RL appear first as hyporeflective retinal lesions by defocused IR-SLO (see Suppl. Fig. 1). In Grps A & B hyporeflective retinal lesions appear, increase is size and persist with some variability. They can become larger or remain the same size, as well as persist for many weeks or disappear between imaging sessions (see Suppl. Fig. 2A–F). In Grp C, hyporeflective retinal lesions rapidly appear after a week or two of light exposure and are more uniform in size (see Suppl. Fig. 3 IR-SLO “defocused” Group C) relative to Grps A & B. Over an extended period of time (i.e. 20 weeks or more of exposure), hyporeflective retinal lesions in Grp C eventually transform into hyper-reflective retinal lesions as the blister-like lesions undergo regression. Hyporeflective retinal lesions are followed soon (Grp C), or late thereafter (Grp A & B), by AFF depending on treatment group. AFF appear to become brighter (see Suppl. Fig. 3 AF-SLO “focused” Group C & Suppl. Fig. 2B′–F′) over time as observed by AF-SLO but this change was not analyzed.
Supplementary video related to this article can be found at http://dx.doi.org/10.1016/j.exer.2015.04.009.
Qualitative retinal changes were quantified to show the time-dependent trends in retinal pathology progression (Fig. 4). Fig. 4A–C shows the results obtained for treatment Grps A, B, & C in regards to retinal pathology findings of RL, AFF, and photoreceptor degeneration. Fig. 4A shows the change in the mean number of RL in Grps B and C mice relative to Grp A. Trends are shown with nonlinear 3rd (Grps A & B) and 4th (Grp C) order polynomial regression curves. Grp C animals exhibited a steep initial increase (i.e. progression), followed by a decrease (i.e. regression), in RL count from 1 to 20 and 20–48 wks, respectively. Between baseline and 20 weeks, the number of lesions increased at a rate of 0.3, 1.5 and 22 per week for Grps A, B, & C, respectively. Grp C became significant at 3 weeks (p = .0003) and remained this way (p < .0001) relative to Grp A through 25 weeks. Mean trends in RL count for Grp B were not significantly different than GrpA. However, Grp B is significantly different from Grp A if we exclude Grp C data from the statistical analysis with its extreme scatter (i.e. large standard deviation). With Grp C excluded, RL from Grp B are significant relative to Grp A at 8 (p = .04), 15 (p = .0004), 20 (p < .0001) & 25 (p < .0001) weeks.
Fig. 4.
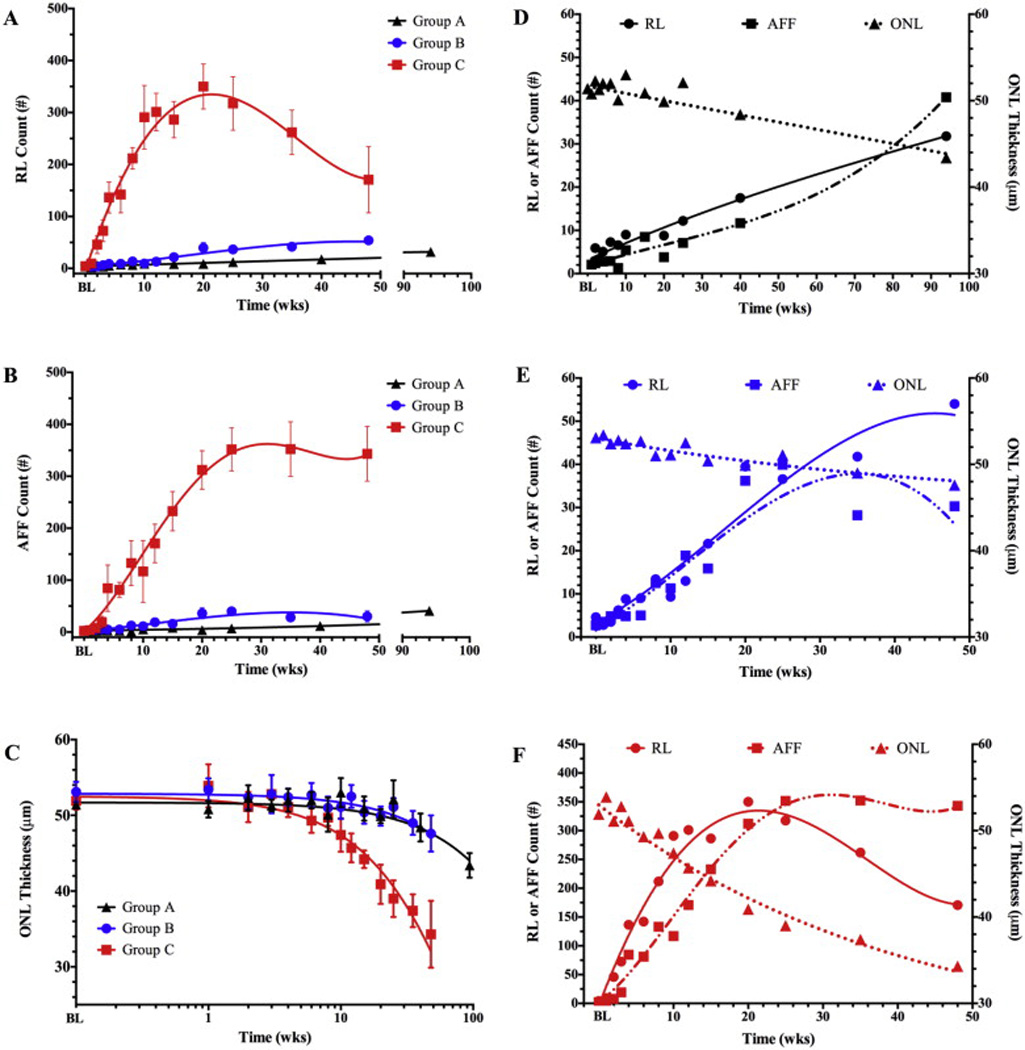
Time-dependent changes (top) in retinal pathology extracted from SLO (A, B) and OCT (C) images of BALB/cJ mice from treatment Grps A, B, & C. No significant differences in RL, AFF count or ONL thickness were observed at baseline (BL). Grp C has significant increases in RL (A) at 3 (p = .0003), 4, 6, 8, 10, 15, 20, & 25 weeks (4–25 wks; p < .0001), AFF number (B) at 4, 6, 8, 10, 15, 20, & 25 weeks (4–25 wks; p < .0001), and ONL degeneration (C) at 2 (p = .0044), 10, 15, 20, & 25 weeks (10–25 wks; p < .0001). Dynamic comparisons between RL, AFF, and ONL degeneration are individually shown for Grps A (D), B (E), & C (F). Fig. 4F shows the relationship between these three retinal observations in Grp C mice and reveals that RL count precedes AFF count and ONL degeneration by 1 and 9 weeks, respectively.
Fig. 4B shows a dynamic change in the mean number of AFF in Grps B and C mice relative to Grp A. Trends are shown with nonlinear 3rd (Grps A & B) and 4th (Grp C) order polynomial regression curves. Grp C animals exhibited an increase in AFF number between 1 and 25 weeks, followed by stagnation between 25 and 48 wks. Between baseline and 25 weeks, the number of AFF increased at a rate of 0.2, 1.5 and 15 per week for Grps A, B, & C, respectively. Grp C became significant at 4 weeks (p < .0001) and remained this way (p < .0001) relative to Grp A through week 25. Mean AFF counts for Grp B were not significantly different than Grp A. However, like that observed with RL, Grp B is significantly different from Grp A if we exclude Grp C data with its extreme scatter (i.e. large standard deviation). With Grp C excluded, AFF from Grp B are significant relative to Grp A at 8 (p < .0001), 10 (p = .02) 15 (p < .0001), 20 (p < .0001) & 25 (p < .0001) weeks.
Fig. 4C shows a dynamic change in mean ONL thickness for Grp B and C mice relative to Grp A. Data trends are shown in a semi-LOG plot fitted with exponential decay nonlinear regression curves. Grp C animals exhibited a single time point of ONL thickening (p = 0.0044) at 1 week post-baseline followed by a steady decrease in ONL thickness that became significant (p < .0001) at 10 weeks, and remained that way (p < .0001) through 25 weeks, relative to Grp A. The ONL in Groups A, B, and C degenerated at a nonlinear, exponential rate with negative decay constants of .0017, .0022, and .013, respectively. Thus, Grp C decayed at a rate ~6–7 times faster than Grps A & B. Unlike that found with RF and AFF, ONL thickness for Grp B was not significantly different than Grp A when Grp C was either included or excluded from the statistical analysis.
Fig. 4D–F shows the pathology dynamics for individual treatment Grps A (Fig. 4D), B (Fig. 5E), and C (Fig. 5F). Each figure reveals the relationship between observations made from SLO (RL & AFF) and OCT (ONL degeneration) imaging. Grp A (Fig. 4D) mice housed in the low-illuminance vivarium (<10 lx) reveal that RL and AFF findings increase linearly (R2: RL-0.974/AFF-0.937) at similar, but significantly different (p = 0.0125) rates (Slope: RL-0.3/AFF -0.39). No significant ONL degeneration is observed between baseline and 25 weeks. ONL degeneration was significant (P < .0001) at both 40 (48.4 µm) and 94 (43.4 µm) weeks post-baseline relative to initial level (51.4 µm).
Fig. 5.
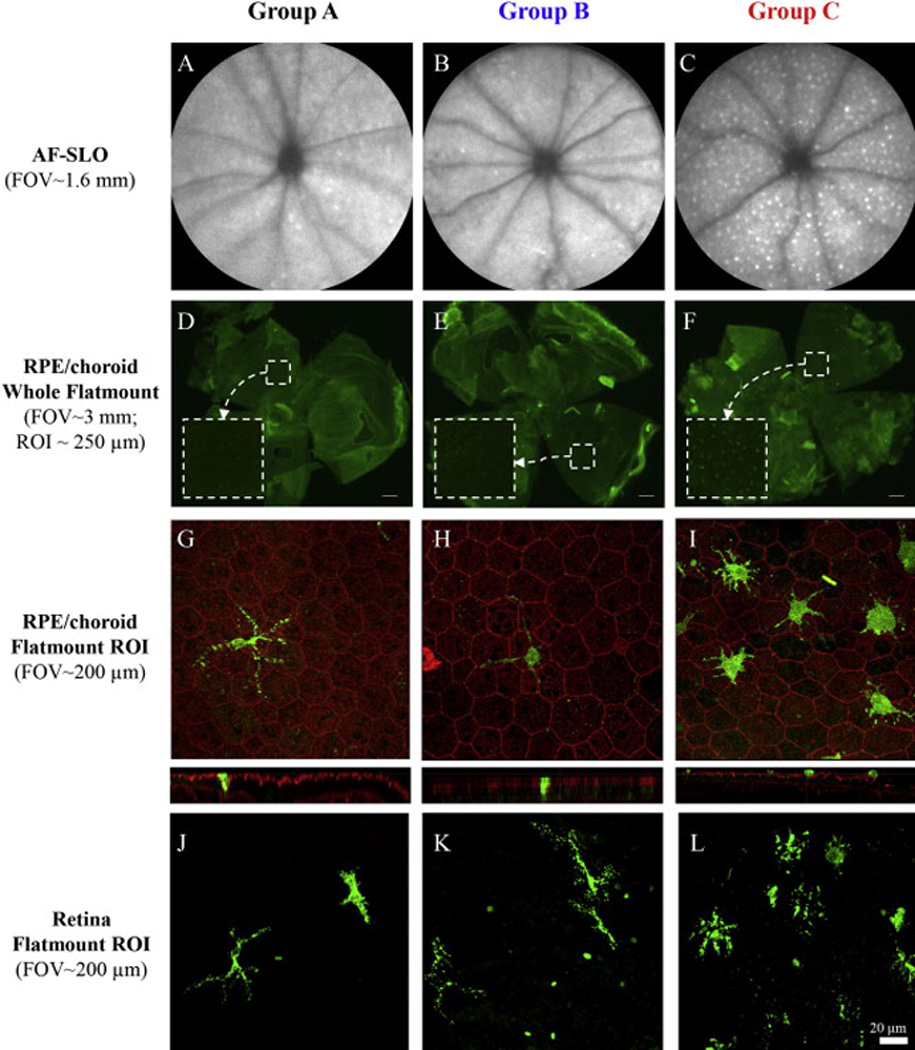
Representative AF-SLO images (A–C) and fluorescence microscopy of retinal flatmounts (D–F) from the 3 BALB/cJ mice study groups. Flatmount immunohistochemistry results using IBA1 antibody confirm observations made from SLO imaging which showed that AFF are more prevalent in Grp C than Grps A & B. IBA1+ cells (green) could be activated resident microglia or infiltrating macrophages and are shown against RPE background with Phalloidan labeling (red). After separation of retina from the RPE/choroid, laser scanning confocal microscopy of both retina (G–I) and RPE/choroid (J–K) flatmount components indicate IBA1+ cells. Z-stack images from these preparations indicated that the IBA1+ cells are located in close proximity to the apical surface of the RPE and within the photoreceptor layer outer segments. LSCM imaging of the retinal component also revealed IBA1+ cells with dendritic processes extending into the photoreceptor layer (J–K). Immunophenotypic morphology of IBA1+ cells are different in Group C relative to Groups A & B. Positive cells in Group C have larger, swollen cell bodies with shorter dendritic processes as compared to those present in Groups A & B. IBA1+ cellular density is much higher in Group C. (Scale bars: D-F = 200 µm, G-L = 20 µm). (For interpretation of the references to color in this figure legend, the reader is referred to the web version of this article.)
Fig. 4E shows the results from Grp B that was housed in the standard vivarium under low illuminance (<10 lx) conditions and imaged multiple times to monitor for temporal changes in pathology findings. In this group RL and AFF increased linearly (R2: RL-0.894/AFF-0.924) over time with similar, but insignificantly different rate of change (slope: RL-1.478/AFF-1.538). Beyond 25 weeks, some discontinuity is observed as both trends enter a secondary phase with diverging count rates. RL continues to increase linearly but does so at a rate ~2.5 times slower (1.5 vs. 0.57). AFF counts abruptly changes from an increasing, to slightly decreasing rate (Slope 1.5 vs. −0.32). The differences in slope between RL and AFF count were statistically significant (p = 0.033) from 25 to 48 weeks. No significant ONL degeneration is observed between baseline and 12 weeks. Beyond 12 weeks ONL degeneration was significant at 15 (p = 0.0012), 20 (p= 0.0029), 35 (p = 0.00015), 48 (p < 0.0001) weeks.
Fig. 4F shows the results from Grp C that was housed in the standard vivarium, experienced elevated illuminance (150 lx) conditions, and was imaged multiple times to monitor for temporal changes in pathology findings. In this group RL and AFF increased linearly (R2: RL-0.921/AFF-0.947) over time at significantly (p = 0.017) different rates (slope: RL-22.4/AFF-15.3) up to 20 weeks. At 20–25 weeks, the rates abruptly change with RL decreasing and AFF leveling off to a horizontal asymptote. From 20 to 48 weeks, RL count decreases linearly (R2: RL-0.997) at a slower, negative rate (−6.3). AFF counts abruptly change from increasing, to a near steady state (0.75). The differences in slope between RL and AFF count were statistically significant (p = 0.0019) beyond 20 weeks. No significant ONL degeneration is observed between baseline and 4 weeks. Beyond 4 weeks ONL degeneration was significant at 6 (p = 0.006), 10 (p = 0.0057), 12 through 48 (p < 0.0001) weeks.
3.4. Immunohistochemistry and histomorphology
Retinal flatmounts were collected at 15 weeks post-baseline show the relative differences in IM between groups. Fig. 5A–C shows representative AF-SLO images from each of the group that reveal substantially more visible AFF in Grp C (Fig. 5C) than Grps A (Fig. 5A) & B (Fig. 5B). Fluorescence images of whole flatmounts (Fig. 5D–F) from the same mice show similar results and support observations made by in vivo AF-SLO imaging. Confocal imaging of a small region of interest (Fig. 5G–I) in the flatmounts show IBA-1+ cells that are located both in close proximity to the RPE (Fig. 5G–I) and in the outer retina (Fig. 5J–L). Representative confocal images qualitatively reveal that IBA-1+ cell populations are different in Grp C than Grps A & B. In addition, Grp C cells appear to have shortened dendritic processes and are more engorged than Grps A & B, suggesting they are in a state of active phagocytosis. We initially tried to image these cells in flat mounts without IBA-1 staining, but the endogenous autofluorescence in these cells quickly faded requiring the use of IBA-1 staining for stable imaging with confocal microscopy.
Fig. 6 shows representative results from histology performed on mice in Grps A, B & C at 8,15, 20, 36, and 56 weeks. At 8 weeks, Grps A & B have normal retinal morphology compared to Grp C which shows a single retinal infoldings and subretinal inflammatory monocytes within the photoreceptor layer that has shortened outer segments. There is also evidence of subretinal space thickening and/or vacuoles within this layer. At 15 weeks a representative section from a Grp C animal shows additional evidence of multiple infoldings, along with another example of a subretinal inflammatory monocytes and disorganized outer segments. At 20 weeks, infoldings are still present and have expanded to impact the ELM and ONL. Much disorganization is observed and delineating the inner and outer segments if challenging. Nuclei in the RPE are pyknotic and the subretinal space/interphotoreceptor matrix or OS appear to be compromised which has become detached during fixation and processing. At 36 weeks photoreceptor degeneration is clearly evident in Grp C vs. both Grp A & B animals. Infoldings have regressed leaving a much disorganized photoreceptor layer with locations of attenuated outer segments and evidence of inflammatory monocytes. At 56 weeks, photoreceptor degeneration is observed with two regressed infoldings. At 36 and 56 weeks, Group B shows evidence of long term light stress from either the multiple imaging sessions or vivarium lighting conditions. As shown from the SLO imaging data, infoldings and inflammatory monocytes are still observed in both Grp A & B mice, which occur spontaneously even when housed under low light level conditions.
Fig. 6.
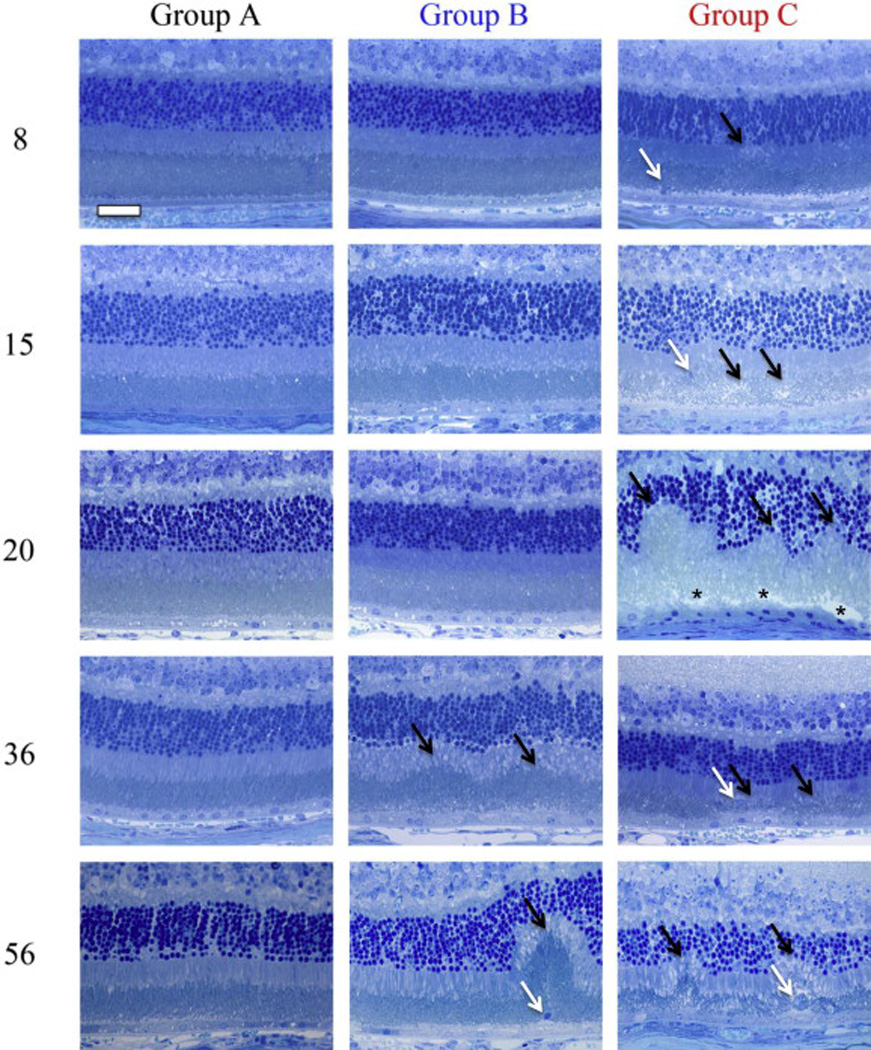
Representative photomicrographs (64x) of retinas from experimental treatment groups at time points of 8, 15, 20, 36, & 56 weeks. Grp A shows typical histomorphology for a BALB/cJ mouse that has been protected from extended light stress by being reared and housed in 1 lx conditions. Grp B demonstrates changes that occur as a result of being housed in 7 lx conditions which causes an increase in the spontaneous formation of IF and infiltration by IM. Profound changes (i.e. complete remodeling of photoreceptor layer) can be observed in the outer retina of mice that receive long-term exposure to 150 lx (Group C) compared to 7 lx (Group B) and 1 lx-controls (Group A). Between 8 and 20 weeks the IF (black arrows) grow until finally impacting the IS, OS, ELM and ONL layers in mice from treatment Grp C. Compromised IPM (black asterisk) and pyknotic RPE (below asterisk) are observed at 20 weeks. After ~20 weeks the IF begin to collapse and regress (black arrows) leaving attenuated and disorganized photoreceptor outer segments as well as engorged IM (white arrows). IM located within the photoreceptor layer and adjacent to the RPE can be observed in all groups as indicated by white arrows. Scale Bar (upper left) = 20 µm.
3.5. PCR and genotyping results
Retinal infoldings, similar in appearance to the infoldings we observed, have been reported in some mouse models of retinal degeneration. As a result of this observation we felt it prudent to screen a random cohort of BALB/cJ animals for any evidence of rd-6 (n = 21) (Hawes et al., 2000), rd-7 (n = 12) (Akhmedov et al., 2000), rd-8 (n = 21) (Mattapallil et al., 2012), MFRP (n = 12) (Fogerty and Besharse, 2014) and RPE65 (n = 15) (Wenzel et al., 2001) mutations. All tests for these mutations were negative.
3.6. Predictive model of retinal lesion accumulation in BALB/c mice
The experimental data from Fig. 4A was used to develop a predictive model using Graphpad Prism to show: (1) how many RL are anticipated to develop each week as a function of intracage light exposure intensity (Fig. 7A) and (2) to estimate the accumulation of RL as a function of intracage exposure intensity and duration (Fig. 7B). In Fig. 7A, experimental data from Grps A (~1 lx), B (7 lx) and C (150 lx) were employed to obtain a linear growth rate trend (y = 0.1233x + 0.4042, where x = mean light exposure level in lux, R2 = 0.9996) for RL as a function of light exposure intensity. Exposure level values between 7 and 150 lx (i.e. interpolated) and above 150 lx (i.e. extrapolated) were obtained using Graphpad Prism and are displayed in Fig. 7A. It is important to note, especially for the extrapolative values, that we are assuming that RL continue to develop and occur in a linear manner.
Fig. 7.
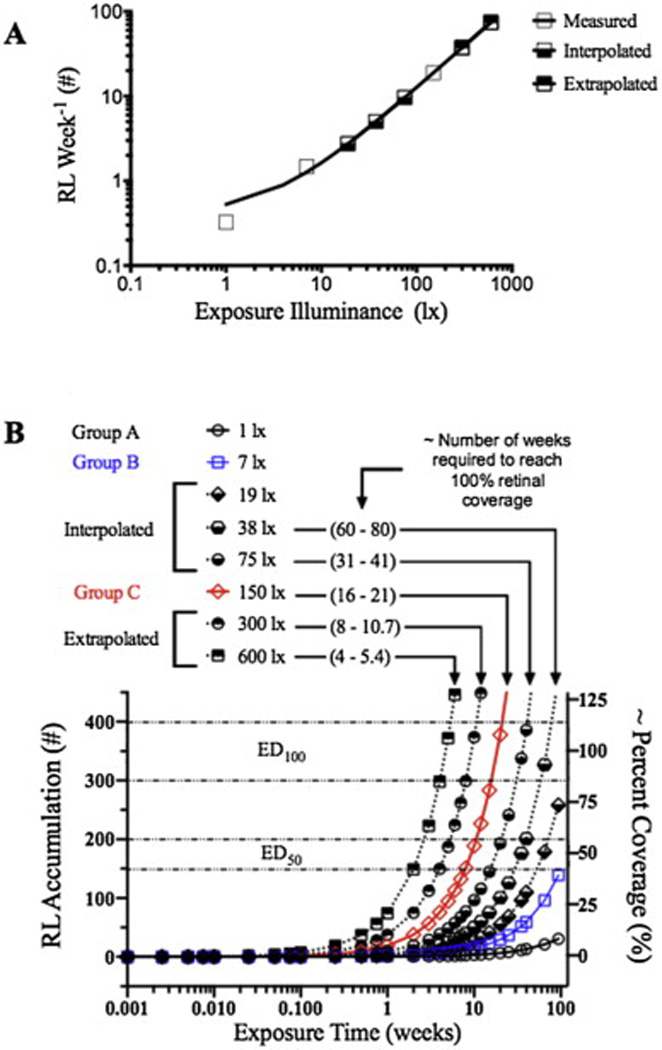
A model of RL development in the BALB/cJ mouse. Fig. 7A shows experimentally obtained (open boxes), as well as interpolated (bottom-filled boxes) and extrapolated (top-filled boxes) values, for the weekly count of RL that are anticipated to appear in an SLO image (with optic disk centrally located in the image frame) as a function of mean intracage light exposure level between the range of 1–600 lx. Fig. 7B transposes the data shown in Fig. 7A into a dosimetry diagram. The diagram reveals the relationship between RL accumulation, intracage light exposure intensity and exposure duration. This diagram anticipates when BALB/c mice will reach the point where the retina will have 50% (ED50) and 100% (ED100) coverage of retinal infoldings. Both of these model diagrams assume that RL growth proceeds at a linear rate between 1 and 600 lx until 100% coverage (i.e. maximum) is reached. Beyond maximum coverage the rate will plateau and/or decrease as shown in Fig. 4A-Group C. The range for ED100 was determined to be ~300–400 which is where Grp C mice in Fig. 4A reached a maximum RL count. ED50 was estimated to be 1/2 of ED100.
Fig. 7B takes the information obtained in Fig. 7A and estimates how many RL will accumulate over time for intracage exposure levels ranging from 1 to 600 lx. Also shown are the approximate time periods in weeks at which there will be approximately 50 or 100% coverage (i.e. ED50 & ED100) of RL on the BALB/c mouse retina.
4. Discussion
SLO and OCT was capable of non-invasively documenting retinal abnormalities in the BALB/c mouse over extended periods of time from individual animals. Both imaging techniques were sensitive to changes occurring in the outer retina as a result of long-term light stress. Using a combination of imaging modalities, we have shown that there are previously unknown events materializing in BALB/c mice that can link genetic variation (Danciger et al., 2000; Ginsberg, 1985; LaVail et al., 1987b; Wenzel et al., 2001) and visual cycle dysfunction (Danciger et al., 2000) to retinal dystrophy, a hallmark characteristic of this model (LaVail et al., 1987b). In past studies, data on retinal dystrophy has typically been performed via histology and light microscopy ((LaVail et al., 1987b; Santos et al., 2010; Knott et al., 2011). This study demonstrates that this information can also be obtained by employing complementary imaging tools to provide immediate feedback on retinal status and integrity from study subjects in vivo.
Early changes associated with light sensitivity were most easily detected by SLO when operating in IR and AF imaging modes. In IR mode, retinal lesions were visualized as a result of employing small adjustments to the SLO focus which served to accentuate lesion contrast against the RPE and choroidal background. Retinal lesions were found to be retinal infoldings, invaginations and/or deviations as previously reported by histology in other mouse models of retinal degeneration (Akhmedov et al., 2000; Hawes et al., 2000; LaVail et al., 1987a; Fogerty and Besharse, 2014)) and in BALB/c mice (Santos et al., 2010). In our experience infoldings are quite difficult to find and capture by histology. This is likely due to small sample sizes (~1 dozen plastic sections @ 1 µm thickness/sections through the vertical meridian) employed to obtain representative histomorphology from an individual eye. Retinal lesions and infoldings have been previously documented in BALB/c mice by SLO imaging (Huber et al., 2009) and histology (Santos et al., 2010) respectively, but were not described or followed over time to reveal dynamic changes. When formed, infoldings appear to be disruptive to the wave guiding properties (i.e. Stiles-Crawford effect) of the photoreceptor inner and outer segments. A slight deviation in alignment and/or elevation of photoreceptor outer segments causes a loss in illumination and/or reflectance efficiency from the pigmented epithelium and choroid complex. As a result, newly formed infoldings appear as dark circular lesions against a bright background by IR-SLO. These changes were not visible by conventional fundus imaging, even when using a high-definition camera, which may explain why this pathology finding has not been previously reported in this particular mouse strain. As we have shown in this study, retinal lesions populate at different rates depending on light exposure conditions. Animals in low lux levels develop infoldings at a slower rate than ones housed in elevated lighting conditions (Grp A < Grp B, Grp A << Grp C, Grp B << Grp C).
Elevated intracage light levels experienced by Group C were no brighter than standard office conditions recommended by OSHA (OSHA, 2014) which ranges from ~100 to 325 lx. Our standard and quarantine vivarium light levels ranged from 200 to 300 lx measured at 1 m above the floor. Interestingly, the Guide for the Care and Use of Laboratory Animals published by the Office of Laboratory Animal Welfare (OLAW) states, “For animals that have been shown to be susceptible to phototoxic retinopathy, light should be between 130 and 325 lux in the room at cage level” (National Research Council (U.S.). Committee for the Update of the Guide for the Care and Use of Laboratory Animals. et al., 2011). Both our quarantine and standard vivarium are well within this specified range, however, appreciable damage was noted in our animals when housed under these conditions. Our extracage vs. intracage measurements revealed that intensities within cages are on average approximately 10-fold less than those taken outside the cage (Table 1). Extrapolating this to the OLAW guidelines results in recommended intracage levels of ~10–30 lx, which is nominally and substantially above our standard (~7 lx) and low-illuminance (~1 lx) vivarium light levels, respectively.
Further investigations revealed that room lighting and cage rack design is primarily responsible for the anomalies observed in these animals. First, cage rack systems do not always have light shields over the top shelf and/or animal cages and thus, mice housed in this location may receive significantly (20–80-fold) more light exposure from overhead lighting than animals placed just one or more shelves below (National Research Council (U.S.). Committee for the Update of the Guide for the Care and Use of Laboratory Animals. et al., 2011). This is a well-identified problem with rodent vivariums and is only likely to be of concern to those individuals involved with vision research. Moreover, animals in these environments were also unable to keep from developing retinal lesions even though they had opaque or light attenuating enrichment huts. This underscores the fact that animals housed for long periods will develop some lesions, even at light levels that many of us would consider relatively benign (30 lx) if housed for extended periods of time under these conditions. Vivarium illuminance levels can vary widely throughout a room depending on location both in regards to elevation and lateral placement on the cage rack assembly. To minimize this problem some investigators work with their animal resources center husbandry staff to implement a cage rotation procedure (S. Nusinowitz - personal communication). Rotating cages at some interval, during cage changes for example, can help to ensure light exposure randomization. However, in the case of BALB/c mice, this would not be sufficient to eliminate the occurrence of infoldings as even 30 lx of exposure over the length of a half-, to one-year duration may equate to a substantial (50–100% coverage) amount of infolding production (Fig. 7). We did not implement a cage rotation system in our facility as we did not experience any further problems with retinal lesion development once switching to rearing mice in the low-illuminance versus the standard vivarium.
Daily husbandry and employee habits can also influence the formation of infoldings. Placement of cage changing stations and their extended use within the vivarium can have a negative impact. A cage changing station equipped with visible fluorescent lighting located opposite a cage rack can expose mice for hours, especially if left on continuously by staff. We observed BALB/c mice spontaneously developing an appreciable amount of retinal lesions while in close proximity to cage changing stations. This results in uneven cage illumination, with the side facing outward toward the light source being more brightly illuminated than the inward facing side.
Our results demonstrate that mice housed under 150, 8 and 1 lx conditions on average will accumulate ~350, 40 and 10 retinal lesions respectively, within the central retina field of view after 20 weeks. In the elevated light exposed animals, the lesions are essentially “shoulder-to-shoulder” and reach full panretinal coverage (i.e. ED100) at this exposure time. It is likely that we are underestimating the total number of lesions that appear since some were observed to resolve between imaging sessions and therefore are not counted once resolved. We do not know what initiates the initial infolding or what leads to their regression. The cause of this phenomenon would be interesting to determine in future studies. Regardless of whether the lesions regress or not, once present, retinal infoldings continue to compound over time and alter outer panretinal morphology. As shown, the rate of change is dependent on light dosimetry (i.e. light intensity and exposure duration). Moreover, other variables like transportation from vendors, quarantine periods, laboratory environments, individual animal behavior, cage changing stations, and imaging procedures can influence the rate at which lesions occur. When using BALB/c mice we found it best to breed our own animals in a specially modified, low-illuminance vivarium so that the lighting conditions can be carefully controlled. It is also advantageous to characterize every animal by imaging prior to conducting any experimental studies so that baseline levels are established (Bell et al., 2012). Without these precautions and rigorous attention to appropriate controls, the BALB/c mouse should not the model of choice to study experimentally generated retinal lesions.
Presence of inflammatory monocytes, such as macrophages or microglia, in the outer retina and subretinal space in the BALB/c line has been shown previously by both imaging (Bell et al., 2012) and histology assessment (Santos et al., 2010). As we have shown by coregistration of IR and AF-SLO images, inflammatory monocytes seem to settle directly within retinal infoldings following their formation. This suggests that infoldings occur first with inflammatory monocyte movement into these areas secondary. The new imaging results shown here have demonstrated that AFF, more specifically inflammatory monocytes, respond directly to retinal infoldings and are recruited to the sub-retinal space as a result of light stress. Furthermore, RL and AFF pathology is developing, materializing, and subsiding (for RL only) while photoreceptor degeneration is progressing at an exponential rate (i.e. decay). This study has been unique in that it has shown the kinetics of these 3 different pathologies in the BALB/c mouse and most importantly, that these pathologies contribute to substantial disruption, reorganization and remodeling of the outer retina over time. Those using or planning to use BALB/c mice for extended periods must be cognizant of these changes and that they may influence study outcomes if not addressed prior to initiating experimental protocol. We expect that the techniques revealed by this work will be beneficial to those that study chronic and/or acute light stress, protective effects of light preconditioning, retinal inflammatory response and visual cycle dysfunction. However, at this time, additional experiments with this model are warranted as it is currently unknown whether RL continue to develop at a linear rate, or at all, with illuminance exposure intensities exceeding 150 lx.
5. Conclusions
Researchers should be extremely cautious when employing albino rodents for their experimental studies. Based on our experience, the lesions documented herein are not unique to BALB/c mice from one particular vendor. We have observed their presence in animals from both The Jackson Laboratories and Taconic Farms. Furthermore, it is apparent in SLO images from Huber et al., 2009, that BALB/c mice from Charles River Laboratories develop these lesions as well. Thus, it should be assumed that these lesions will occur in BALB/c mice purchased from any vendor.
These lesions described in this study are difficult to detect using conventional histological analysis, visible light fundus imaging and OCT. We found SLO imaging to be the most appropriate and efficient technique for detecting and screening animals for retinal infolding and inflammatory monocyte development. OCT was complimentary in that it was useful for the monitoring retinal degeneration as it progressed secondarily to the SLO observed pathology.
Animals obtained from reputable vendors should be thoroughly screened prior to use since one can never be certain of animal light history during rearing, transportation after procurement and institutional quarantine periods. Lighting in any standard rodent vivarium must be modified to house albino animals so as to minimize the risk of causing retinal lesions and subsequent photoreceptor degeneration. This requires purchase of a quality lux meter for measuring illuminance levels from the various locations both within the vivarium and rodent cages. Ideal vivarium lighting should provide ~30 lux about 1 m above floor level. This intensity provides enough light for laboratory, veterinarian and husbandry staff to perform their respective duties. This illuminance level should translate into external and internal cage illumination intensities of ~10–15 and ~0.5–1.5 lx, respectively.
Staff should also evaluate the vivarium, laboratory and experimental environment and/or conditions for extraneous light scenarios that would overexpose animals (e.g. avoid the “top shelf effect”, watch for doors being propped open, lights in cage change hoods being left on for extended periods or that are not attenuated to reduce illuminance levels, cages not being covered during transport, cages exposed in the lab throughout the day and/or next to a window, exposure to bright visible light for fundus imaging or ERG testing). Finally, with a model that is so sensitive to light damage, it is imperative that both treatment and control groups experience identical lighting conditions throughout the full course of the experiments.
Supplementary Material
Highlights.
Novel imaging techniques reveal retinal pathology in BALB/c mice.
BALB/c mice exhibit profound changes in outer retina morphology as a result of relatively low cyclic light exposure levels ranging from 1 to 150 lux.
BALB/c mice obtained from reputable vendors can have pre-existing retinal pathology due to prior light exposure levels.
In vivo imaging by SLO and OCT proved helpful in elucidating the dynamics of changes induced by chronic light stress.
Acknowledgments
The study was supported in part by National Institutes of Health Grant EY14240, an unrestricted grant from Research to Prevent Blindness, a Foundation Fighting Blindness Research Center Grant, The Wolf Family Foundation, the Llura and Gordon Gund Foundation, and the Cleveland Clinic.
Abbreviations
- AFF
autofluorescent foci
- Grp(s)
group(s)
- RL
retinal lesions
Footnotes
Appendix A Supplementary data
Supplementary data related to this article can be found at http://dx.doi.org/10.1016/j.exer.2015.04.009.
References
- Akhmedov NB, Piriev NI, Chang B, Rapoport AL, Hawes NL, Nishina PM, Nusinowitz S, Heckenlively JR, Roderick TH, Kozak CA, Danciger M, Davisson MT, Farber DB. A deletion in a photoreceptor-specific nuclear receptor mRNA causes retinal degeneration in the rd7 mouse. Proc. Natl. Acad. Sci. U. S.A. 2000;97:5551–5556. doi: 10.1073/pnas.97.10.5551. [DOI] [PMC free article] [PubMed] [Google Scholar]
- Bell BA, Kaul C, Rayborn ME, Hollyfield JG. Baseline imaging reveals preexisting retinal abnormalities in mice. Adv. Exp. Med. Biol. 2012;723:459–469. doi: 10.1007/978-1-4614-0631-0_58. [DOI] [PubMed] [Google Scholar]
- Bell BA, Kaul C, Hollyfield JG. A protective eye shield for prevention of media opacities during small animal ocular imaging. Exp. Eye Res. 2014;127:280–287. doi: 10.1016/j.exer.2014.01.001. [DOI] [PMC free article] [PubMed] [Google Scholar]
- Chollangi S, Wang J, Martin A, Quinn J, Ash JD. Preconditioning-induced protection from oxidative injury is mediated by leukemia inhibitory factor receptor (LIFR) and its ligands in the retina. Neurobiol. Dis. 2009;34:535–544. doi: 10.1016/j.nbd.2009.03.012. [DOI] [PMC free article] [PubMed] [Google Scholar]
- Cruz-Guilloty F, Saeed AM, Echegaray JJ, Duffort S, Ballmick A, Tan Y, Betancourt M, Viteri E, Ramkhellawan GC, Ewald E, Feuer W, Huang D, Wen R, Hong L, Wang H, Laird JM, Sene A, Apte RS, Salomon RG, Hollyfield JG, Perez VL. Infiltration of proinflammatory m1 macrophages into the outer retina precedes damage in a mouse model of age-related macular degeneration. Int. J. Inflam. 2013;2013:503725. doi: 10.1155/2013/503725. [DOI] [PMC free article] [PubMed] [Google Scholar]
- Danciger M, Matthes MT, Yasamura D, Akhmedov NB, Rickabaugh T, Gentleman S, Redmond TM, La Vail MM, Farber DB. A QTL on distal chromosome 3 that influences the severity of light-induced damage to mouse photoreceptors. Mamm. Genome. 2000;11:422–427. doi: 10.1007/s003350010081. [DOI] [PubMed] [Google Scholar]
- Fogerty J, Besharse JC. Subretinal infiltration of monocyte derived cells and complement misregulation in mice with AMD-like pathology. Adv. Exp. Med. Biol. 2014;801:355–363. doi: 10.1007/978-1-4614-3209-8_45. [DOI] [PMC free article] [PubMed] [Google Scholar]
- Ginsberg HMALMM. Light-induced retinal degeneration in the mouse: analysis of pigmentation mutants. In: LaVail MM, Hollyfield JG, Anderson RE, editors. Retinal Degeneration: Experimental and Clinical Studies. New York: Alan R. Liss, Inc; 1985. pp. 449–469. [Google Scholar]
- Hawes NL, Chang B, Hageman GS, Nusinowitz S, Nishina PM, Schneider BS, Smith RS, Roderick TH, Davisson MT, Heckenlively JR. Retinal degeneration 6 (rd6): a new mouse model for human retinitis punctata albescens. Invest Ophthalmol. Vis. Sci. 2000;41:3149–3157. [PubMed] [Google Scholar]
- Hollyfield JG, Bonilha VL, Rayborn ME, Yang X, Shadrach KG, Lu L, Ufret RL, Salomon RG, Perez VL. Oxidative damage-induced inflammation initiates age-related macular degeneration. Nat. Med. 2008;14:194–198. doi: 10.1038/nm1709. [DOI] [PMC free article] [PubMed] [Google Scholar]
- Huber G, Beck SC, Grimm C, Sahaboglu-Tekgoz A, Paquet-Durand F, Wenzel A, Humphries P, Redmond TM, Seeliger MW, Fischer MD. Spectral domain optical coherence tomography in mouse models of retinal degeneration. Invest Ophthalmol. Vis. Sci. 2009;50:5888–5895. doi: 10.1167/iovs.09-3724. [DOI] [PMC free article] [PubMed] [Google Scholar]
- JAX® Mice. Our Most Popular (Inbred Mice) Strains. 2013 http://jaxmice.jax.org/findmice/index.html. [Google Scholar]
- JAX®Notes Issue 443. A Brief History of the Two Substrains of BALB/c, BALB/cJ, and BALB/cByJ. 1990 Available from: Animal Resources. http://jaxmice.jax.org/jaxnotes/archive/443a.html. [Google Scholar]
- JAX® Notes Issue 488. Colony Expansions Completed for JAX® Mice Strains C57BL/6J and BALB/cJ. 2002 http://jaxmice.jax.org/jaxnotes/archive/488c.html. [Google Scholar]
- Jiao S, Ruggeri M, Wehbe H, Gregory G, Jockovich ME, Hackam A, Puliafito CA. Imaging of eye tumor in the mouse model of retinoblastoma with spectral-domain optical coherence tomography – art. no. 64260D. Ophthalmic Technol. XVII. 2007;6426:D4260–D4260. [Google Scholar]
- Kaldi I, Martin RE, Huang H, Brush RS, Morrison KA, Anderson RE. Bright cyclic rearing protects albino mouse retina against acute light-induced apoptosis. Mol. Vis. 2003;9:337–344. [PubMed] [Google Scholar]
- Knott EJ, Sheets KG, Zhou Y, Gordon WC, Bazan NG. Spatial correlation of mouse photoreceptor-RPE thickness between SD-OCT and histology. Exp. Eye Res. 2011;92:155–160. doi: 10.1016/j.exer.2010.10.009. [DOI] [PMC free article] [PubMed] [Google Scholar]
- Kocaoglu OP, Uhlhorn SR, Hernandez E, Juarez RA, Will R, Parel JM, Manns F. Simultaneous fundus imaging and optical coherence tomography of the mouse retina. Invest. Ophthalmol. Vis. Sci. 2007;48:1283–1289. doi: 10.1167/iovs.06-0732. [DOI] [PubMed] [Google Scholar]
- LaVail MM, Gorrin GM, Repaci MA. Strain differences in sensitivity to light-induced photoreceptor degeneration in albino mice. Curr. Eye Res. 1987a;6:825–834. doi: 10.3109/02713688709034850. [DOI] [PubMed] [Google Scholar]
- LaVail MM, Gorrin GM, Repaci MA, Thomas LA, Ginsberg HM. Genetic regulation of light damage to photoreceptors. Invest Ophthalmol. Vis. Sci. 1987b;28:1043–1048. [PubMed] [Google Scholar]
- Lyubarsky AL, Savchenko AB, Morocco SB, Daniele LL, Redmond TM, Pugh EN., Jr Mole quantity of RPE65 and its productivity in the generation of 11-cis-retinal from retinyl esters in the living mouse eye. Biochemistry. 2005;44:9880–9888. doi: 10.1021/bi0505363. [DOI] [PubMed] [Google Scholar]
- Maass A, von Leithner PL, Luong V, Guo L, Salt TE, Fitzke FW, Cordeiro MF. Assessment of rat and mouse RGC apoptosis imaging in vivo with different scanning laser ophthalmoscopes. Curr. Eye Res. 2007;32:851–861. doi: 10.1080/02713680701585872. [DOI] [PMC free article] [PubMed] [Google Scholar]
- Mattapallil MJ, Wawrousek EF, Chan CC, Zhao H, Roychoudhury J, Ferguson TA, Caspi RR. The Rd8 mutation of the Crb1 gene is present in vendor lines of C57BL/6N mice and embryonic stem cells, and confounds ocular induced mutant phenotypes. Invest Ophthalmol. Vis. Sci. 2012;53:2921–2927. doi: 10.1167/iovs.12-9662. [DOI] [PMC free article] [PubMed] [Google Scholar]
- Montalban-Soler L, Alarcon-Martinez L, Jimenez-Lopez M, Salinas-Navarro M, Galindo-Romero C, Bezerr de Sa F, Garcia-Ayuso D, Aviles-Trigueros M, Vidal-Sanz M, Agudo-Barriuso M, Villegas-Perez MP. Retinal compensatory changes after light damage in albino mice. Mol. Vis. 2012;18:675–693. [PMC free article] [PubMed] [Google Scholar]
- Mouse Genome Informatics Web Site. Inbred Strains of Mice: BALB. 2013 http://www.informatics.jax.org/external/festing/mouse/docs/BALB.shtml. [Google Scholar]
- Narimatsu T, Ozawa Y, Miyake S, Kubota S, Hirasawa M, Nagai N, Shimmura S, Tsubota K. Disruption of cell-cell junctions and induction of pathological cytokines in the retinal pigment epithelium of light-exposed mice. Investig. Ophthalmol. Vis. Sci. 2013;54:4555–4562. doi: 10.1167/iovs.12-11572. [DOI] [PubMed] [Google Scholar]
- National Research Council U.S. Committee for the Update of the Guide for the Care and Use of Laboratory Animals. Washington, DC: Institute for Laboratory Animal Research (U.S.), National Academies Press (U.S.), eighth ed. Guide for the Care and Use of Laboratory Animals National Academies Press; 2011. [Google Scholar]
- Nusinowitz S, Nguyen L, Radu R, Kashani Z, Farber D, Danciger M. Electroretinographic evidence for altered phototransduction gain and slowed recovery from photobleaches in albino mice with a MET450 variant in RPE65. Exp. Eye Res. 2003;77:627–638. doi: 10.1016/s0014-4835(03)00217-3. [DOI] [PubMed] [Google Scholar]
- Administration, O.S.H., editor. OSHA. Safety and Health Regulations for Construction: Illumination. Washington, DC: US Dept of Labor; 2014. p. 1926.56. [Google Scholar]
- Paques M, Simonutti M, Roux MJ, Picaud S, Levavasseur E, Bellman C, Sahel JA. High resolution fundus imaging by confocal scanning laser ophthalmoscopy in the mouse. Vis. Res. 2006;46:1336–1345. doi: 10.1016/j.visres.2005.09.037. [DOI] [PubMed] [Google Scholar]
- Paques M, Guyomard JL, Simonutti M, Roux MJ, Picaud S, Legargasson JF, Sahel JA. Panretinal, high-resolution color photography of the mouse fundus. Investig. Ophthalmol. Vis. Sci. 2007;48:2769–2774. doi: 10.1167/iovs.06-1099. [DOI] [PubMed] [Google Scholar]
- Pennesi ME, Michaels KV, Magee SS, Maricle A, Davin SP, Garg AK, Gale MJ, Tu DC, Wen Y, Erker LR, Francis PJ. Long-term characterization of retinal degeneration in rd1 and rd10 mice using spectral domain optical coherence tomography. Investig. Ophthalmol. Vis. Sci. 2012;53:4644–4656. doi: 10.1167/iovs.12-9611. [DOI] [PMC free article] [PubMed] [Google Scholar]
- Potter M. The Balb/C mouse – genetics and immunology – preface. Curr. Top. Microbiol. Immunol. 1985;122:R5–R7. [PubMed] [Google Scholar]
- Rasband WS. ImageJ. U.S. National Institutes of Health. 1997–2012 [Google Scholar]
- Ridder W, III, Nusinowitz S, Heckenlively JR. Causes of cataract development in anesthetized mice. Exp. Eye Res. 2002;75:365–370. doi: 10.1006/exer.2002.2007. [DOI] [PubMed] [Google Scholar]
- Santos AM, Martin-Oliva D, Ferrer-Martin RM, Tassi M, Calvente R, Sierra A, Carrasco MC, Marin-Teva JL, Navascues J, Cuadros MA. Microglial response to light-induced photoreceptor degeneration in the mouse retina. J. Comp. Neurol. 2010;518:477–492. doi: 10.1002/cne.22227. [DOI] [PubMed] [Google Scholar]
- Seeliger MW, Beck SC, Pereyra-Munoz N, Dangel S, Tsai JY, Luhmann UF, van de Pavert SA, Wijnholds J, Samardzija M, Wenzel A, Zrenner E, Narfstrom K, Fahl E, Tanimoto N, Acar N, Tonagel F. In vivo confocal imaging of the retina in animal models using scanning laser ophthalmoscopy. Vis. Res. 2005;45:3512–3519. doi: 10.1016/j.visres.2005.08.014. [DOI] [PubMed] [Google Scholar]
- Ueki Y, Wang J, Chollangi S, Ash JD. STAT3 activation in photoreceptors by leukemia inhibitory factor is associated with protection from light damage. J. Neurochem. 2008;105:784–796. doi: 10.1111/j.1471-4159.2007.05180.x. [DOI] [PubMed] [Google Scholar]
- Wenzel A, Reme CE, Williams TP, Hafezi F, Grimm C. The Rpe65 Leu450Met variation increases retinal resistance against light-induced degeneration by slowing rhodopsin regeneration. J. Neurosci. 2001;21:53–58. doi: 10.1523/JNEUROSCI.21-01-00053.2001. [DOI] [PMC free article] [PubMed] [Google Scholar]
- Xu H, Chen M, Mayer EJ, Forrester JV, Dick AD. Turnover of resident retinal microglia in the normal adult mouse. Glia. 2007;55:1189–1198. doi: 10.1002/glia.20535. [DOI] [PubMed] [Google Scholar]
- Xu H, Chen M, Manivannan A, Lois N, Forrester JV. Age-dependent accumulation of lipofuscin in perivascular and subretinal microglia in experimental mice. Aging Cell. 2008;7:58–68. doi: 10.1111/j.1474-9726.2007.00351.x. [DOI] [PubMed] [Google Scholar]
- Zhang C, Shen JK, Lam TT, Zeng HY, Chiang SK, Yang F, Tso MO. Activation of microglia and chemokines in light-induced retinal degeneration. Mol. Vis. 2005;11:887–895. [PubMed] [Google Scholar]
Associated Data
This section collects any data citations, data availability statements, or supplementary materials included in this article.