Abstract
Current PET/MR systems employ segmentation of MR images and subsequent assignment of empirical attenuation coefficients for quantitative PET reconstruction. In this study we examine the differences in the quantification of 18F-FDG uptake in the carotid arteries between PET/MR and PET/CT scanners. Five comparisons were performed to asses differences in PET quantification: i) PET/MR MR-based AC (MRAC) versus PET/MR CTAC, ii) PET/MR MRAC versus PET/CT, iii) PET/MR MRAC with carotid coil versus PET/MR MRAC without coil, iv) PET/MR MRAC scan 2 versus PET/MR MRAC scan 1, and v) PET/MR CTAC versus PET/CT. Standardized uptakes values (SUV) mean and SUV maximum were calculated for six regions-of-interests: left and right carotid arteries, left and right lungs, spine and muscle. Pearson’s Correlation and Bland-Altman plots were used to compare SUV mean and maximum within each ROI of each patient. PET/MR emission data reconstructed with MRAC versus PET/MR emission data reconstructed with CTAC had percent differences of SUV mean ranging from -2.0% (Absolute Difference, -0.02) to 7.4% (absolute difference, 0.06). Percent differences within the carotid arteries proved to correlate well with differences of SUV mean of 5.4% (Absolute Difference, 0.07) in the left carotid and 2.7% (Absolute Difference, 0.03) in the right carotid. Pearson’s correlation and Bland-Altman of PET/MR with MRAC versus PET/MR with CTAC showed high correlation between SUV mean (R2=0.80, mean difference 0.03 ± 0.18 SUV, p=0.3382), demonstrating excellent correlation within ROIs analyzed. The results of this study support the use of 18F-FDG PET/MR for quantitative measure of inflammation in the carotid arteries.
Keywords: PET/MR, attenuation correction, PET/CT, carotid arteries, cardiovascular
Introduction
Recently, 18F-Fluorodeoxyglocuse (FDG) positron emission tomography (PET) has shown promise in characterizing and quantifying metabolic activity of inflammation [1]. It is believed that with better characterization of plaque inflammation, detection of atherosclerosis may be improved [2]. With the recent rise of combined PET/MR systems, MR image acquisition still allows for high spatial resolution anatomical images with the added benefit of providing superior soft tissue characterization of atherosclerotic plaques over PET/CT images [3-6]. However, technical hurdles in MR-based attenuation correction (MRAC) methods may still provide challenges to accurate quantitative PET images of the carotid arteries in a clinical setting [7-10].
Current PET/MR systems employ segmentation of MR images and subsequent assignment of empirical attenuation coefficients for quantitative PET reconstruction [4,5]. Due to the difficulty of imaging and segmenting bone with MR-based attenuation correction sequences, all commercially available PET/MR systems at this time ignore bone in the attenuation maps for whole-body attenuation correction. Since bone is the highest attenuating tissue in the body, it is believed that ignoring bone will lead to severe underestimation of PET radiotracer standardized uptake values (SUV) in and immediately adjacent to bone structures [11]. In carotid plaque PET/MR imaging, specific localized MR coils are used to increase signal reception when performing dedicated high resolution MR imaging for determination of plaque composition. Attenuation maps of coils can be included in the system standard PET reconstruction of emission data to account for their position within the PET FOV [12-14].
In this current study, we examine quantitative differences between carotid artery imaging protocols using PET/MR emission data reconstructed with both MRAC and CTAC maps. In keeping with previous studies [6,15-21], we also include a comparison of PET/CT and PET/MR acquisitions, albeit, controlling for circulation time. In addition, we performed a second PET/MR acquisition rather than a subsequent PET/CT in a small cohort of patients to provide a preliminary estimate of the quantitative reproducibility of PET/MR acquisitions. Finally, we compared PET/MR acquisitions both without and with a dedicated carotid coil in the FOV during PET acquisitions to determine if the manufacturer provided carotid coil attenuation correction produced accurate quantification. This study provides a comparison of several major aspects influencing quantification of inflammation in combined PET/MR imaging of the carotid arteries.
Materials and methods
Five sets of quantitative PET images were generated from a total of four PET/MR and PET/CT acquisitions (Figure 1). All imaging protocols were approved by the Icahn School of Medicine at Mount Sinai Institutional Review Board. All subjects provided informed consent to participate in the described imaging protocol.
Figure 1.
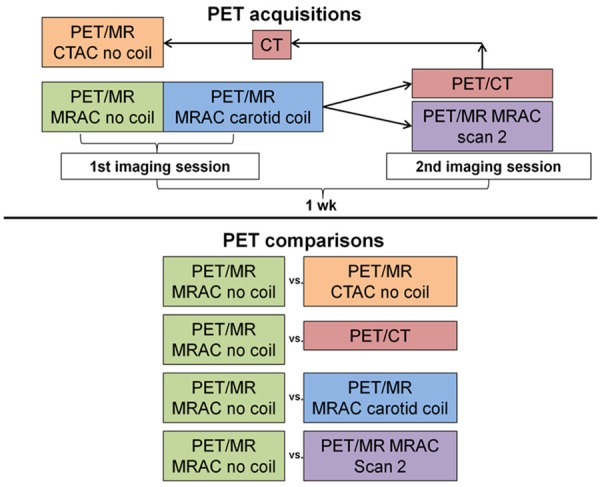
Diagram of PET acquisitions that were performed to qualitatively and quantitatively compare PET images from PET/MR and PET/CT acquisitions.
PET/MR acquisition protocol
Eleven subjects (mean weight 76 ± 18 kg) with risk factors for heart disease were recruited for combined PET/MR imaging of the carotid arteries. The eleven subjects were injected with 18F-FDG (500 ± 71 MBq) and after a circulation time of 90 minutes (mean 88 ± 14 min), were scanned on the Philips sequential PET/MR scanner (Philips Ingenuity TF, Cleveland, OH, USA). The MRAC method implemented on the Philips PET/MR was performed by acquiring a T1-weighted 3D gradient echo attenuation correction MR (atMR) sequence with flip angle of 10 degrees, TE 2.30 ms, TR 4.03 ms, 576 mm transverse FOV with 3D slab thickness of 252 mm, voxel size of 2×2×3 mm, and scan duration of 35 s [22]. The MRAC map was provided by segmentation of the atMR acquisition into 3 tissue classifications, air (0.0000 cm-1), lung (0.0221 cm-1) and soft tissue (0.0960 cm-1), with lungs being segmented from the atMR image by following a human-like a priori model [22]. Segmentation errors (lack of segmentation of the trachea) in the MRAC maps were manually corrected and re-reconstructed in the system standard PET reconstruction software to avoid errors in quantification [23,24]. The PET acquisition was performed immediately (~1 min) after the atMR acquisition in 3D mode, using time of flight (TOF) information standard on the PET/MR system. The PET acquisition consisted of 2 bed positions, for 8 minutes each, centered on the carotid bifurcation. Images were reconstructed into a 144×144×90 matrix with 4×4×4 mm3 voxel size, using a 3D row action maximization likelihood algorithm [25] with 3 iterations and 33 subsets and corrections for normalization, dead time, decay, scatter, randoms, and attenuation. No dedicated MR coil was present during the initial PET acquisition. Signal reception for the atMR acquisition was performed using the quadrature body coil. An attenuation template of the patient table was included in the final attenuation map for PET reconstruction as is standard on the system.
PET/MR carotid coil acquisition
Immediately subsequent to the PET/MR no coil acquisition, we performed a carotid coil PET/MR acquisition with an 8-channel carotid artery coil (Shanghai Chenguang Medical Technologies Co., LTD, Shanghai, China) in place and repeated the identical carotid PET/MR protocol described above. The dedicated carotid coil is designed to be placed in the same location on the patient table for each acquisition. A pre-computed attenuation map for the carotid coil was included by the manufacturer in the system standard PET reconstruction, similar to previous rigid PET/MR coils [12]. Mean difference between PET/MR acquisitions without and with the carotid coil was 28.6 minutes. Decay correction was applied to correct for the time delay between acquisitions.
PET/MR reproducibility
For a preliminary estimate of reproducibility of quantitative PET acquisitions on the PET/MR scanner, four of the eleven subjects (mean weight of 74 ± 20 kg) that were initially imaged with PET/MR returned one week (mean 8.5 ± 2.6 d) after their first scan and were again injected with 18F-FDG (467 ± 98 MBq) with a circulation time of 90 minutes (mean 85 ± 13 min) and imaged with the identical carotid PET/MR no coil acquisition described above.
PET/CT acquisition protocol
The remaining seven of the initial eleven subjects, mean weight of 77 ± 18 kg, were imaged again one week (mean 7.0 ± 1.9 d) after initial PET/MR acquisition with PET/CT to control for equal circulation time in both acquisitions. Subjects were injected with 18F-FDG (486 ± 81 MBq) and imaged using a PET/CT (16 slice mutlidetector CT) scanner (GE Discovery STE, Waukesha, WI, USA) after a circulation time of 90 minutes (94 ± 11 min). PET images were acquired in 2D without TOF capability and with 2 bed positions for 8 minutes each centered on the carotid bifurcation to match the PET/MR acquisition duration. PET images from the PET/CT acquisition were reconstructed using the system standard OSEM method [26] with 28 subsets and 2 iterations and corrections for normalization, dead time, decay, scatter, randoms, and attenuation. The final matrix size of the PET image was 128×128×83 voxels with 3.9×3.9×3.27 mm3 voxel size. Attenuation correction was performed using a non-contrast low-dose CT image that was converted to an attenuation map at 511 keV, as is standard on the PET/CT system [27]. Patient supports used in the PET/MR acquisition (i.e., head holders) were also used during the PET/CT acquisition to facilitate accurate coregisteration of PET/MR and PET/CT images.
CT-based attenuation correction of PET/MR emission data
To directly compare the effects of CT-based attenuation correction (CTAC) on the PET/MR emission data versus that of the system standard PET/MR MRAC, the low-dose CT image from the PET/CT acquisition was co-registered to the atMR image of the PET/MR acquisition. Automatic rigid co-registration was performed in SPM8 (SPM, University College London, London, UK) using normalized mutual information estimation [28]. Spatial accuracy of co-registration was measured by calculating distances between 7 points (5 spine and 1 in each carotid) visible in both MR and CT images for 5 axial slices in each patient then averaged for each patient and all patients combined. The resulting CT images after co-registration were smoothed with a 4 mm Gaussian to match the PET resolution then re-sliced into the PET space of the PET/MR acquisition. The re-sliced CT images were then transformed to 511 keV attenuation coefficients using a standard bilinear model [27,29] with an in-house program in MATLAB (Mathworks, Natick, MA). These final CTAC maps were then reinserted into the system standard PET/MR reconstruction algorithm in the place of the system standard MRAC map to obtain CTAC of PET/MR emission data, similar to previous studies [23,24,30].
Image analysis
All images were co-registered into the PET/MR image space using the atMR acquisition with no dedicated MR coil as the target image space. PET images were quantified using the body weight standardized uptake value.
Region-based analyses were performed using an in-house program in MATLAB and Osirix (Osirix Imaging software, Pixmeo, Geneva, Switzerland) to determine differences in SUV within specific tissue regions. Six regions-of-interest (ROIs) were defined: left and right carotid arteries, left and right lungs, spine and soft tissue (muscle). ROIs were traced manually in the axial view of the atMR images for each body part (Figure 2). These ROIs were then superimposed on all PET images after co-registration to the initial PET/MR acquisition. SUV mean and maximum were calculated for each ROI. Pearson’s Correlation and Bland-Altman plots were used to compare SUV mean and maximum within each ROI of each patient.
Figure 2.
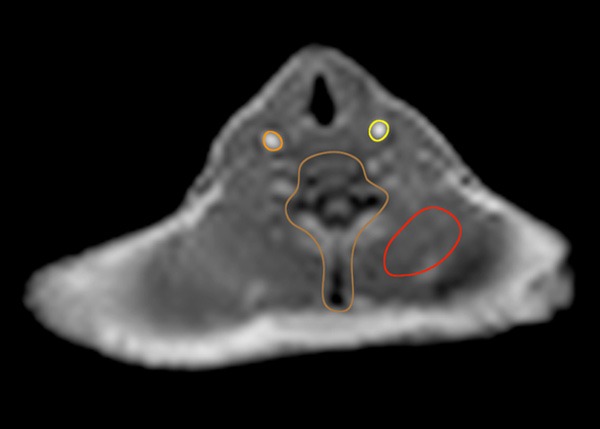
Example of four of the six regions-of-interest traced in the axial view of the atMR MR acquisition. Left and Right carotid, spine and back muscle (soft tissue) are visible in this axial slice. The left and right lung are outside the axial view displayed here but were traced along the outer contour in the axial view in a similar matter.
Statistical analyses to compare the results of each method were performed using SPSS software (SPSS, Chicago, IL). Pearson’s correlation and paired t-test were evaluated to identify correlation and significant differences for each comparison. Statistical significance was considered for p < 0.05.
Results
Accuracy of co-registration of the CT acquisition from the PET/CT scan to the atMR sequence in the PET/MR acquisition was on average for all patients 4.3 mm in the axial plane (Table 1) (Figure 3). Qualitative inspection of representative patient attenuation maps showed clear differences, such as a lack of bone and fat in MRAC maps versus CTAC maps (Figure 4). Qualitative inspection of PET images reconstructed with each respective attenuation map, however, showed minimal differences when PET/MR emission data was reconstructed with either MRAC or CTAC maps (Figure 4). Qualitative differences were seen when comparing PET/MR emission data to PET/CT (Figure 4). Quantitatively, very low percent differences were seen in the neck, where the carotids were present, between the CTAC and MRAC maps (Figure 5 top) and their respective reconstructed PET images (Figure 5 bottom).
Table 1.
Co-registration errors between 7 points (averaged over 5 spine and 1 in each carotid) visible in both MR and CT images for 5 axial slices in each patient then averaged for each patient and all patients combined
| Co-registration Errors | |
|---|---|
|
| |
| Patient | Distance |
| p1 | 3.3 mm |
| p2 | 5.8 mm |
| p3 | 3.3 mm |
| p4 | 5.1 mm |
| p5 | 5.7 mm |
| p6 | 2.7 mm |
| p7 | 4.1 mm |
| All patients | 4.3 mm |
Figure 3.
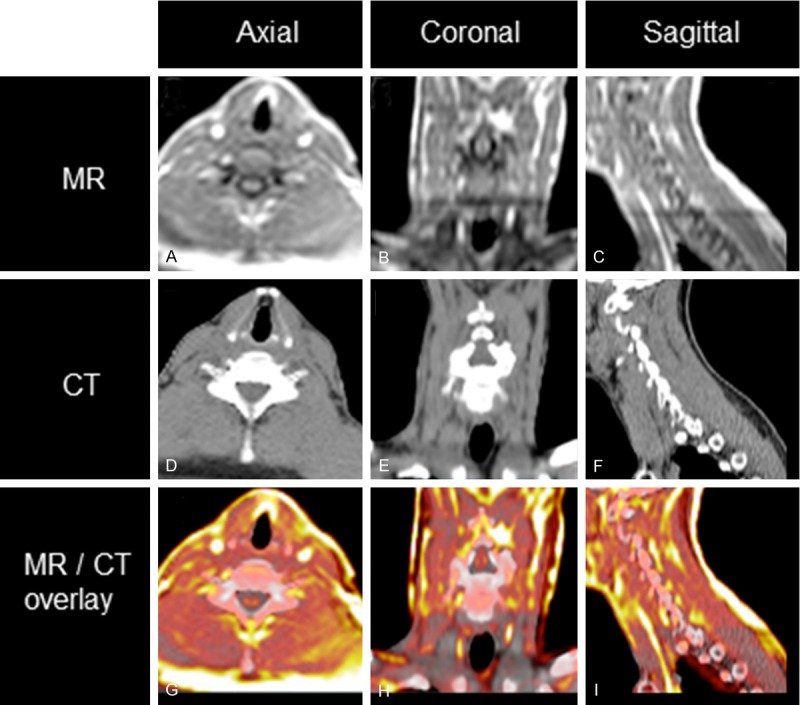
Demonstration co-registration accuracy (A-C) MR (D-F) CT (G-I) overlay of MR (color scale) and CT (grayscale).
Figure 4.
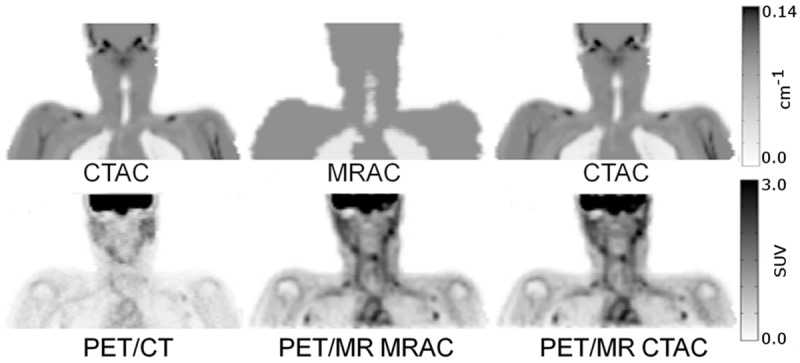
Coronal comparisons of CT- and MR-based attenuation maps and their respective PET reconstructions on PET/CT and PET/MR.
Figure 5.
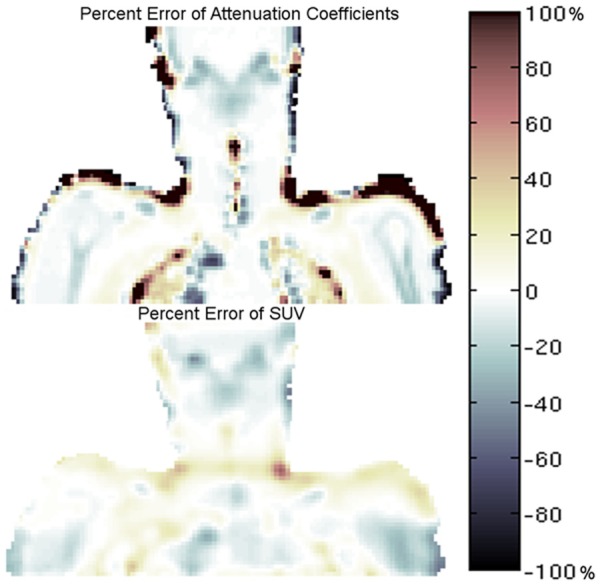
Percent difference error map between CTAC and assigned MRAC attenuation coefficients (top) and percent difference error map showing regional differences in SUV between PET/MR emission data reconstructed with the respective MRAC and CTAC maps (bottom).
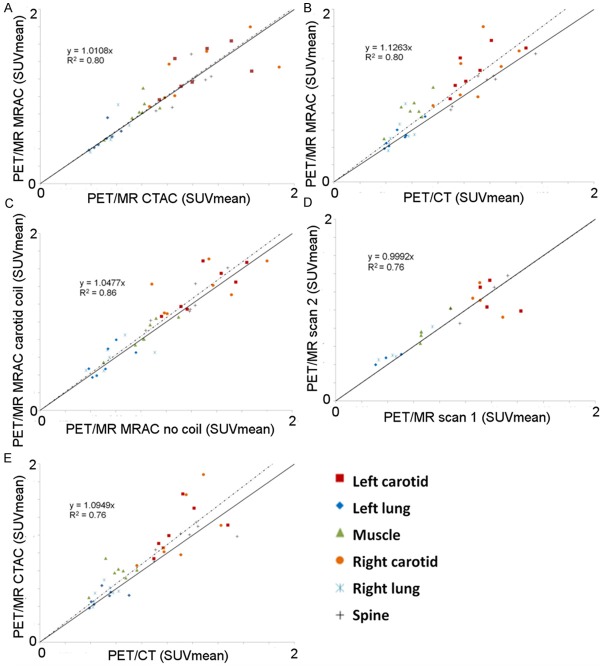
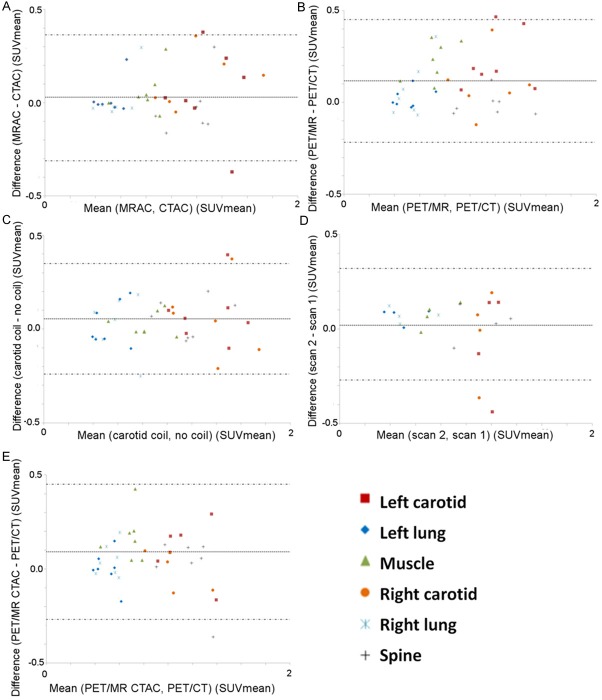
Compared to the CTAC maps, the system standard MRAC map attenuation values within all ROIs were underestimated (Table 2). PET/MR emission data reconstructed with the MRAC map versus PET/MR emission data reconstructed with the CTAC map demonstrated excellent correlation for ROIs analyzed (R2=0.80, mean difference 0.03 ± 0.18 SUV, p=0.34) (Tables 3, 4 and 5) (Figures 6A, 7A). PET/MR emission data reconstructed with the MRAC map versus PET/CT typically overestimated the carotids and muscle but underestimated the right and left lung and spine (R2=0.80, mean difference 0.11 ± 0.17 SUV, p=0.0001) (Tables 3, 4 and 5) (Figures 6B, 7B). PET/MR emission data with the carotid coil in the FOV versus PET/MR emission data with no coil in the FOV overestimated all ROIs (R2=0.86, mean difference 0.05 ± 0.15 SUV, p=0.02) (Tables 3, 4 and 5) (Figures 6C, 7C). PET/MR MRAC reproducibility scan 2 emission data versus PET/MR MRAC reproducibility scan 1 emission data demonstrated good correlation in the carotids while the muscle, spine, and left and right lungs were overestimated (R2=0.76, mean difference 0.02±0.15 SUV, p=0.01) (Tables 3, 4 and 5) (Figures 6D, 7D). PET/MR CTAC emission data versus system standard PET/CT acquisition overestimated SUV mean and max in all ROIs, except in the spine and left and right lung where SUV max was underestimated (R2=0.76, mean difference 0.09 ± 0.18 SUV, p=0.002) (Tables 3, 4 and 5) (Figures 6E, 7E). Similar trends were seen for SUV max in all respective comparisons (Tables 3, 4 and 5).
Table 2.
Summary of the mean, minimum, maximum and standard deviation of attenuation coefficients (cm-1) within each ROI analyzed and comparison of percent and absolute differences to the empirically assigned soft tissue and lung values of the system standard MRAC map. Mean attenuation coefficient (cm-1) ± SD (min, max). P-values for comparison of MRAC and CTAC attenuation coefficients for each ROI
| ROI | Attenuation Coefficients of CTAC map | Attenuation Coefficients of MRAC fixed map | Percent Difference; MRAC fixed versus CTAC | Absolute Difference; MRAC fixed versus CTAC | p |
|---|---|---|---|---|---|
| Left Carotid | 0.0976 ± 0.0021 (0.0946, 0.1004) | 0.0960 | -1.7 | -0.0016 | 0.0014 |
| Right Carotid | 0.0966 ± 0.0019 (0.0937, 0.0993) | 0.0960 | -0.6 | -0.0006 | 0.0675 |
| Muscle | 0.0982 ± 0.0024 (0.0931, 0.1058) | 0.0960 | -2.2 | -0.0022 | < 0.0001 |
| Spine | 0.1095 ± 0.0080 (0.0930, 0.1282) | 0.0960 | -12.3 | -0.0135 | <0.0001 |
| Left Lung | 0.0315 ± 0.0105 (0.0207, 0.0769) | 0.0221 | -29.8 | -0.0094 | < 0.0001 |
| Right Lung | 0.0342 ± 0.0127 (0.0212, 0.0816) | 0.0221 | -35.4 | -0.0121 | < 0.0001 |
Table 3.
Summary of the mean, minimum, maximum and standard deviation of SUV within each ROI analyzed for each of the five comparisons. SUV mean ± SD (SUV min, SUV max)
| ROI | PET/CT | PET/MR MRAC no coil map | PET/MR CTAC map | PET/MR MRAC carotid coil | PET/MR MRAC scan 1 | PET/MR MRAC scan 2 |
|---|---|---|---|---|---|---|
| Left Carotid | 1.08 ± 0.24 (0.78, 1.46) | 1.28 ± 0.18 (1.04, 1.55) | 1.21 ± 0.16 (1.00, 1.45) | 1.36 ± 0.24 (1.03, 1.74) | 1.21 ± 0.20 (0.93, 1.51) | 1.16 ± 0.15 (0.87, 1.48) |
| Right Carotid | 1.10 ± 0.23 (0.79, 1.46) | 1.24 ± 0.18 (1.02, 1.52) | 1.21 ± 0.18 (0.98, 1.50) | 1.35 ± 0.25 (1.02, 1.74) | 1.13 ± 0.21 (0.84, 1.50) | 1.12 ± 0.18 (0.90, 1.42) |
| Muscle | 0.59 ± 0.13 (0.34, 0.96) | 0.80 ± 0.13 (0.58, 1.13) | 0.74 ± 0.15 (0.51, 1.12) | 0.82 ± 0.14 (0.55, 1.20) | 0.70 ± 0.08 (0.55, 0.88) | 0.77 ± 0.11 (0.54, 1.01) |
| Spine | 1.14 ± 0.35 (0.58, 2.31) | 1.13 ± 0.27 (0.73, 1.94) | 1.15 ± 0.28 (0.69, 1.94) | 1.18 ± 0.31 (0.72, 2.12) | 1.08 ± 0.28 (0.63, 1.89) | 1.10 ± 0.27 (0.68, 1.92) |
| Left Lung | 0.49 ± 0.13 (0.27, 1.01) | 0.52 ± 0.11 (0.34, 0.92) | 0.50 ± 0.11 (0.31, 0.91) | 0.56 ± 0.13 (0.33, 1.01) | 0.50 ± 0.12 (0.31, 0.90) | 0.55 ± 0.13 (0.34, 1.01) |
| Right Lung | 0.51 ± 0.14 (0.26, 1.05) | 0.57 ± 0.11 (0.36, 0.97) | 0.55 ± 0.12 (0.34, 0.99) | 0.58 ± 0.14 (0.34, 1.10) | 0.51 ± 0.09 (0.35, 0.83) | 0.57 ± 0.12 (0.38, 0.99) |
Table 4.
Summary of the percent differences in terms of SUV mean and SUV max, within each ROI analyzed, for each of the five comparisons
| ROI | Variable | Percent Differences | ||||
|---|---|---|---|---|---|---|
|
| ||||||
| PET/MR MRAC no coil versus PET/MR CTAC | PET/MR MRAC no coil versus PET/CT | PET/MR MRAC carotid coil versus PET/MR MRAC no coil | PET/MR MRAC scan 1 versus PET/MR MRAC scan 2 | PET/MR CTAC versus PET/CT | ||
|
| ||||||
| * | ** | *** | **** | ** | ||
| Left Carotid | SUV mean | 5.4 | 19.1 | 6.0 | -4.3 | 13.0 |
| SUV max | 6.6 | 6.3 | 10.3 | -2.0 | -0.3 | |
| Right Carotid | SUV mean | 2.7 | 13.0 | 8.8 | -0.4 | 10.0 |
| SUV max | 1.5 | 4.3 | 14.2 | -4.9 | 2.8 | |
| Muscle | SUV mean | 7.4 | 35.9 | 3.0 | 9.7 | 26.5 |
| SUV max | 1.3 | 18.2 | 6.0 | 15.1 | 16.7 | |
| Spine | SUV mean | -2.0 | -1.4 | 4.6 | 2.4 | 0.5 |
| SUV max | 0.1 | -15.9 | 9.3 | 1.7 | -16.0 | |
| Left Lung | SUV mean | 4.3 | 6.8 | 6.3 | 11.4 | 2.4 |
| SUV max | 0.6 | -8.9 | 10.1 | 11.8 | -9.4 | |
| Right Lung | SUV mean | 3.6 | 12.4 | 1.4 | 11.9 | 8.5 |
| SUV max | -2.7 | -8.1 | 13.7 | 19.3 | -5.6 | |
PET/MR with CTAC map as reference.
PET/CT as reference.
PET/MR with no coil as reference.
PET/MR scan-1 as reference.
Table 5.
Summary of the absolute differences in terms of SUV mean and SUV max, within each ROI analyzed, for each of the five comparisons
| ROI | Variable | Absolute Differences | ||||
|---|---|---|---|---|---|---|
|
| ||||||
| PET/MR MRAC no coil versus PET/MR CTAC | PET/MR MRAC no coil versus PET/CT | PET/MR MRAC carotid coil versus PET/MR MRAC no coil | PET/MR MRAC scan 1 versus PET/MR MRAC scan 2 | PET/MR CTAC versus PET/CT | ||
|
| ||||||
| * | ** | *** | **** | ** | ||
| Left Carotid | SUV mean | 0.07 | 0.21 | 0.08 | -0.05 | 0.14 |
| SUV max | 0.10 | 0.09 | 0.16 | -0.03 | 0.00 | |
| Right Carotid | SUV mean | 0.03 | 0.14 | 0.11 | 0.00 | 0.11 |
| SUV max | 0.02 | 0.06 | 0.22 | -0.07 | 0.04 | |
| Muscle | SUV mean | 0.06 | 0.21 | 0.02 | 0.07 | 0.16 |
| SUV max | 0.01 | 0.17 | 0.07 | 0.13 | 0.16 | |
| Spine | SUV mean | -0.02 | -0.01 | 0.05 | 0.03 | 0.01 |
| SUV max | 0.00 | -0.37 | 0.18 | 0.03 | -0.37 | |
| Left Lung | SUV mean | 0.02 | 0.03 | 0.03 | 0.06 | 0.01 |
| SUV max | 0.01 | -0.09 | 0.09 | 0.11 | -0.09 | |
| Right Lung | SUV mean | 0.02 | 0.06 | 0.01 | 0.06 | 0.04 |
| SUV max | -0.03 | -0.08 | 0.13 | 0.16 | -0.06 | |
PET/MR with CTAC map as reference.
PET/CT as reference.
PET/MR with no coil as reference.
PET/MR scan-1 as reference.
Figure 6.
Pearson’s correlation plots for all ROIs in all patients. PET/MR MRAC versus PET/MR CTAC (A) PET/MR MRAC versus PET/CT (B) PET/MR MRAC with carotid coil versus PET/MR MRAC without coil (C) PET/MR MRAC scan 2 versus PET/MR MRAC scan 1 (D) PET/MR CTAC versus PET/CT (E).
Figure 7.
Bland-Altman plots for all ROIs in all patients. PET/MR MRAC versus PET/MR CTAC (A) PET/MR MRAC versus PET/CT (B) PET/MR MRAC with carotid coil versus PET/MR MRAC without coil (C) PET/MR MRAC scan 2 versus PET/MR MRAC scan 1 (D) PET/MR CTAC versus PET/CT (E).
Discussion
The current study shows five comparisons of quantitative PET in carotid protocols using both PET/MR and PET/CT scanners (Figure 1). Our mean spatial registration error of 4.3 mm in the neck, around the resolution of the PET scanner, should not have a major effect on carotid PET quantification. We found that the left and right carotid artery attenuation coefficients were higher in the CTAC maps versus assigned MRAC values (Table 2), however, this did not translate to higher SUV when reconstructed with CTAC maps, suggesting that fat contents near the carotid and represented in CTAC maps resulted in decreased SUV as compared to MRAC. The spine CTAC map value (Table 2) reported here was slightly lower than previously reported CTAC map spine attenuation values gathered in two recent reviews [8,10]. This combined with MRAC soft tissue attenuation coefficients possibly overestimating lower attenuating fat along certain lines of response near the cervical spine may reflect the less drastic underestimation that MRAC provided versus CTAC for SUV values in the cervical spine. Spine SUV mean values in our report were underestimated, in concordance with previous studies; however, not to the same degree (-2% versus -5% [23] and -12% [24]) and such underestimation may only reflect noise variations in PET reconstructions. However, reported values were within the range of percent differences in SUV mean previously reported (-12-15% [23]). Very low percent differences were seen in the neck where the carotids were present between the CTAC and MRAC maps (Figure 5 top) and their respective reconstructed PET images (Figure 5 bottom) implying that while regional differences were present in attenuation maps (lungs and spine) and despite efforts, inexact repositioning of the patient between PET/MR and PET/CT scanners (shoulders and base of neck), the current PET/MR protocol was feasible for carotid quantification.
Previously reported PET/MR and PET/CT comparisons have compared quantitative PET images directly from each respective scanner, although these are not always entirely fair comparisons [6,15-21]. Our inclusion of the PET/MR CTAC versus PET/CT comparison lends further support to the hypothesis that even with the same attenuation map (CTAC) in both reconstructions, quantitative PET values differ drastically between the two scanners (0.5-26.5% overestimation for SUV mean) primarily from differences in PET detectors, reconstruction algorithms and acquisition parameters between scanners. Our comparison of PET/MR with MRAC map to PET/CT showed reasonably good correlation (Tables 3, 4 and 5, Figures 6B, 7B), however, when controlling for circulation time, it seems that these differences are primarily due to increased contrast-to-noise ratio in TOF PET/MR versus non-TOF PET/CT and increased sensitivity and SNR due to the 3D acquisition mode of the PET/MR scanner versus the 2D PET/CT acquisition mode (Figure 4) [31,32].
For this carotid coil, the receivers near the patient neck are non-rigid and may be in different locations for different patients in comparison to the pre-computed attenuation map [12-14,33-35]. The highest overestimation when correcting for the carotid coil was in SUV max for both the left and right carotid, suggesting non-rigid motion of the receiver pads was not entirely reproducible and mis-alignment of the attenuation map to the actual position of the coil receiver pads may artificially increase PET quantification and may warrant further coil attenuation correction development for this specific coil.
Reproducibility between PET/MR scans showed statistically significant differences for all ROIs analyzed, but were not statistically significant for the left (p=0.25) or right carotid (p=0.55) and despite the small cohort of patients is in agreement with larger cohort studies of carotid reproducibility [1,36].
Improved quantification in the carotid arteries through partial volume correction remains to be explored in further detail on combined PET/MR scanners [37].
Conclusion
Despite differences in attenuation coefficients in MRAC and CTAC maps and a lack of bone and/or fat attenuation coefficient segments included in the patient neck of the MRAC map, the PET/MR emission data reconstructed with both the CTAC map and the system standard MRAC map showed high correlation. The results of this preliminary study support the use of 18F-FDG PET/MR for quantitative measurements of metabolic activity (e.g., inflammation) in the carotid arteries.
Acknowledgements
The authors would like to thank Philips Healthcare for technical support. This work was supported in part by NIH/NHLBI ROI HL071021 (Z.A.F.) and an American Heart Association Student Scholarship in Cardiovascular Disease (J.B.).
References
- 1.Rudd JH, Myers KS, Bansilal S, Machac J, Pinto CA, Tong C, Rafique A, Hargeaves R, Farkouh M, Fuster V, Fayad ZA. Atherosclerosis inflammation imaging with 18F-FDG PET: carotid, iliac, and femoral uptake reproducibility, quantification methods, and recommendations. J Nucl Med. 2008;49:871–8. doi: 10.2967/jnumed.107.050294. [DOI] [PubMed] [Google Scholar]
- 2.Libby P, DiCarli M, Weissleder R. The vascular biology of atherosclerosis and imaging targets. J Nucl Med. 2010;51(Suppl 1):33S–37S. doi: 10.2967/jnumed.109.069633. [DOI] [PubMed] [Google Scholar]
- 3.Beyer T, Townsend DW, Blodgett T. Dual-modality PET/CT tomography for clinical oncology. Q J Nucl Med. 2002;46:24–34. [PubMed] [Google Scholar]
- 4.Zaidi H, Ojha N, Morich M, Griesmer J, Hu Z, Maniawski P, Ratib O, Izquierdo-Garcia D, Fayad ZA, Shao L. Design and performance evaluation of a whole-body Ingenuity TF PET-MRI system. Phys Med Biol. 2011;56:3091–106. doi: 10.1088/0031-9155/56/10/013. [DOI] [PMC free article] [PubMed] [Google Scholar]
- 5.Delso G, Fürst S, Jakoby B, Ladebeck R, Ganter C, Nekolla SG, Schwaiger M, Ziegler SI. Performance measurements of the Siemens mMR integrated whole-body PET/MR scanner. J Nucl Med. 2011;52:1914–22. doi: 10.2967/jnumed.111.092726. [DOI] [PubMed] [Google Scholar]
- 6.Ripa RS, Knudsen A, Hag AM, Lebech AM, Loft A, Keller SH, Hansen AE, von Benzon E, Højgaard L, Kjær A. Feasibility of simultaneous PET/MR of the carotid artery: first clinical experience and comparison to PET/CT. Am J Nucl Med Mol Imaging. 2013;3:361–71. [PMC free article] [PubMed] [Google Scholar]
- 7.Keereman V, Mollet P, Berker Y, Schulz V, Vandenberghe S. Challenges and current methods for attenuation correction in PET/MR. Magma. 2012;26:81–98. doi: 10.1007/s10334-012-0334-7. [DOI] [PubMed] [Google Scholar]
- 8.Bezrukov I, Mantlik F, Schmidt H, Schölkopf B, Pichler BJ. MR-Based PET Attenuation Correction for PET/MR Imaging. Semin Nucl Med. 2013;43:45–59. doi: 10.1053/j.semnuclmed.2012.08.002. [DOI] [PubMed] [Google Scholar]
- 9.Martinez-Möller A, Nekolla SG. Attenuation correction for PET/MR: Problems, novel approaches and practical solutions. Z Med Phys. 2012;22:299–310. doi: 10.1016/j.zemedi.2012.08.003. [DOI] [PubMed] [Google Scholar]
- 10.Wagenknecht G, Kaiser HJ, Mottaghy FM, Herzog H. MRI for attenuation correction in PET: methods and challenges. MAGMA. 2012;26:99–113. doi: 10.1007/s10334-012-0353-4. [DOI] [PMC free article] [PubMed] [Google Scholar]
- 11.Keereman V, Holen RV, Mollet P, Vandenberghe S. The effect of errors in segmented attenuation maps on PET quantification. Med Phys. 2011;38:6010–9. doi: 10.1118/1.3651640. [DOI] [PubMed] [Google Scholar]
- 12.Zhang B, Pal D, Hu Z, et al. Attenuation correction for MR table and coils for a sequential PET/MR system. IEEE NSS/MIC. 2009:3303–3306. [Google Scholar]
- 13.MacDonald LR, Kohlmyer S, Liu C, Lewellen TK, Kinahan PE. Effects of MR surface coils on PET quantification. Med Phys. 2011;38:2948. doi: 10.1118/1.3583697. [DOI] [PMC free article] [PubMed] [Google Scholar]
- 14.Paulus DH, Braun H, Aklan B, Quick HH. Simultaneous PET/MR imaging: MR-based attenuation correction of local radiofrequency surface coils. Med Phys. 2012;39:4306–15. doi: 10.1118/1.4729716. [DOI] [PubMed] [Google Scholar]
- 15.Varoquaux A, Rager O, Poncet A, Delattre BM, Ratib O, Becker CD, Dulguerov P, Dulguerov N, Zaidi H, Becker M. Detection and quantification of focal uptake in head and neck tumours: (18)F-FDG PET/MR versus PET/CT. Eur J Nucl Med Mol Imaging. 2014;41:462–75. doi: 10.1007/s00259-013-2580-y. [DOI] [PMC free article] [PubMed] [Google Scholar]
- 16.Heusch P, Buchbender C, Beiderwellen K, Nensa F, Hartung-Knemeyer V, Lauenstein TC, Bockisch A, Forsting M, Antoch G, Heusner TA. Standardized uptake values for [(18)F] FDG in normal organ tissues: Comparison of whole-body PET/CT and PET/MRI. Eur J Radiol. 2013;82:870–6. doi: 10.1016/j.ejrad.2013.01.008. [DOI] [PubMed] [Google Scholar]
- 17.Schwenzer NF, Schraml C, Müller M, Brendle C, Sauter A, Spengler W, Pfannenberg AC, Claussen CD, Schmidt H. Pulmonary lesion assessment: comparison of whole-body hybrid MR/PET and PET/CT imaging--pilot study. Radiology. 2012;264:551–558. doi: 10.1148/radiol.12111942. [DOI] [PubMed] [Google Scholar]
- 18.Drzezga A, Souvatzoglou M, Eiber M, Beer AJ, Fürst S, Martinez-Möller A, Nekolla SG, Ziegler S, Ganter C, Rummeny EJ, Schwaiger M. First clinical experience with integrated whole-body PET/MR: comparison to PET/CT in patients with oncologic diagnoses. J Nucl Med. 2012;3:845–55. doi: 10.2967/jnumed.111.098608. [DOI] [PubMed] [Google Scholar]
- 19.Pace L, Nicolai E, Luongo A, Aiello M, Catalano OA, Soricelli A, Salvatore M. Comparison of whole-body PET/CT and PET/MRI in breast cancer patients: Lesion detection and quantitation of 18F-deoxyglucose uptake in lesions and in normal organ tissues. Eur J Radiol. 2014;83:289–96. doi: 10.1016/j.ejrad.2013.11.002. [DOI] [PubMed] [Google Scholar]
- 20.Kohan AA, Kolthammer JA, Vercher-Conejero JL, Rubbert C, Partovi S, Jones R, Herrmann KA, Faulhaber P. N staging of lung cancer patients with PET/MRI using a three-segment model attenuation correction algorithm: initial experience. Eur J Radiol. 2013;23:3161–9. doi: 10.1007/s00330-013-2914-y. [DOI] [PubMed] [Google Scholar]
- 21.Wiesmüller M, Quick HH, Navalpakkam B, Lell MM, Uder M, Ritt P, Schmidt D, Beck M, Kuwert T, von Gall CC. Comparison of lesion detection and quantitation of tracer uptake between PET from a simultaneously acquiring whole-body PET/MR hybrid scanner and PET from PET/CT. Eur J Nucl Med Mol Imaging. 2013;40:12–21. doi: 10.1007/s00259-012-2249-y. [DOI] [PubMed] [Google Scholar]
- 22.Hu Z, Ojha N, Renisch S, Schulz V. MR-based attenuation correction for a whole-body sequential PET/MR system. IEEE NSS/MIC. 2009:3508–3512. [Google Scholar]
- 23.Schramm G, Langner J, Hofheinz F, Petr J, Beuthien-Baumann B, Platzek I, Steinbach J, Kotzerke J, van den Hoff J. Quantitative accuracy of attenuation correction in the Philips Ingenuity TF whole-body PET/MR system: a direct comparison with transmission-based attenuation correction. MAGMA. 2012;26:115–126. doi: 10.1007/s10334-012-0328-5. [DOI] [PMC free article] [PubMed] [Google Scholar]
- 24.Izquierdo-Garcia D, Sawiak SJ, Knesaurek K, Narula J, Fuster V, Machac J, Fayad ZA. Comparison of MR-based attenuation correction and CT-based attenuation correction of whole-body PET/MR imaging. Eur J Nucl Med Mol Imaging. 2014;41:1574–84. doi: 10.1007/s00259-014-2751-5. [DOI] [PMC free article] [PubMed] [Google Scholar]
- 25.Daube-Witherspoon M, Matej S, Karp JS, et al. Application of the Row Action Maximum Likelihood Algorithm with Spherical Basis Functions to Clinical PET Imaging. IEEE Trans Med Imag. 2001;48:24–30. [Google Scholar]
- 26.Hudson HM, Larkin RS. Ordered Subsets of Projection Data. IEEE Trans Med Imaging. 1994;13:601–609. doi: 10.1109/42.363108. [DOI] [PubMed] [Google Scholar]
- 27.Kinahan PE, Townsend DW, Beyer T, Sashin D. Attenuation correction for a combined 3D PET/CT scanner. Med Phys. 1998;25:2046–53. doi: 10.1118/1.598392. [DOI] [PubMed] [Google Scholar]
- 28.Studholme C, Hill DLG, Hawkes DJ. An overlap invariant entropy measure of 3D medical image alignment. Pattern Recognition. 1999;32:71–86. [Google Scholar]
- 29.Burger C, Goerres G, Schoenes S, Buck A, Lonn AH, Von Schulthess GK. PET attenuation coefficients from CT images: experimental evaluation of the transformation of CT into PET 511-keV attenuation coefficients. Eur J Nucl Med Mol Imaging. 2002;29:922–7. doi: 10.1007/s00259-002-0796-3. [DOI] [PubMed] [Google Scholar]
- 30.Bini J, Izquierdo-Garcia D, Mateo J, Machac J, Narula J, Fuster V, Fayad ZA. Preclinical Evaluation of MR Attenuation Correction Versus CT Attenuation Correction on a Sequential Whole-Body MR/PET Scanner. Invest Radiol. 2013;48:313–22. doi: 10.1097/RLI.0b013e31827a49ba. [DOI] [PMC free article] [PubMed] [Google Scholar]
- 31.Karp JS, Surti S, Daube-Witherspoon ME, Muehllehner G. Benefit of time-of-flight in PET: experimental and clinical results. J Nucl Med. 2008;49:462–70. doi: 10.2967/jnumed.107.044834. [DOI] [PMC free article] [PubMed] [Google Scholar]
- 32.Valk P. Positron Emission Tomography: Basic Science and Clinical Practice. 3rd edition. Springer; 2004. [Google Scholar]
- 33.Aklan B, Paulus DH, Wenkel E, Braun H, Navalpakkam BK, Ziegler S, Geppert C, Sigmund EE, Melsaether A, Quick HH. Toward simultaneous PET/MR breast imaging: systematic evaluation and integration of a radiofrequency breast coil. Med Phys. 2013;40:024301. doi: 10.1118/1.4788642. [DOI] [PubMed] [Google Scholar]
- 34.Kartmann R, Paulus DH, Braun H, Aklan B, Ziegler S, Navalpakkam BK, Lentschig M, Quick HH. Integrated PET/MR imaging: automatic attenuation correction of flexible RF coils. Med Phys. 2013;40:082301. doi: 10.1118/1.4812685. [DOI] [PubMed] [Google Scholar]
- 35.Eldib M, Bini J, Calcagno C, Robson PM, Mani V, Fayad ZA. Attenuation correction for flexible magnetic resonance coils in combined magnetic resonance/positron emission tomography imaging. Invest Radiol. 2014;49:63–9. doi: 10.1097/RLI.0b013e3182a530f8. [DOI] [PMC free article] [PubMed] [Google Scholar]
- 36.Rudd JH, Myers KS, Bansilal S, Machac J, Rafique A, Farkouh M, Fuster V, Fayad ZA. (18)Fluorodeoxyglucose positron emission tomography imaging of atherosclerotic plaque inflammation is highly reproducible: implications for atherosclerosis therapy trials. JACC. 2007;50:892–6. doi: 10.1016/j.jacc.2007.05.024. [DOI] [PubMed] [Google Scholar]
- 37.Izquierdo-Garcia D, Davies JR, Graves MJ, et al. Comparison of methods for magnetic resonance-guided [18-F] fluorodeoxyglucose positron emission tomography in human carotid arteries: reproducibility, partial volume correction, and correlation between methods. Stroke. 2009;40:86–93. doi: 10.1161/STROKEAHA.108.521393. [DOI] [PubMed] [Google Scholar]


