Figure 3.

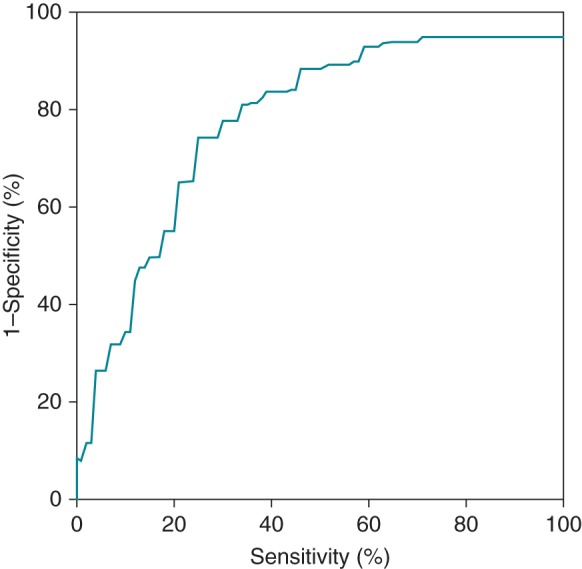
Receiving operator curve for ER/DC predictability. The mean CF had the best predictive value with an area under the curve of 0.80. The best compromise between the sensitivity and specificity was found at 5 g (Se: 71%; Sp: 81%; PPV: 14%).

Receiving operator curve for ER/DC predictability. The mean CF had the best predictive value with an area under the curve of 0.80. The best compromise between the sensitivity and specificity was found at 5 g (Se: 71%; Sp: 81%; PPV: 14%).