

Abstract
In bacteria, selective promoter recognition by RNA polymerase is achieved by its association with σ factors, accessory subunits able to direct RNA polymerase “core enzyme” (E) to different promoter sequences. Using Chromatin Immunoprecipitation-sequencing (ChIP-seq), we searched for promoters bound by the σS-associated RNA polymerase form (EσS) during transition from exponential to stationary phase. We identified 63 binding sites for EσS overlapping known or putative promoters, often located upstream of genes (encoding either ORFs or non-coding RNAs) showing at least some degree of dependence on the σS-encoding rpoS gene. EσS binding did not always correlate with an increase in transcription level, suggesting that, at some σS-dependent promoters, EσS might remain poised in a pre-initiation state upon binding. A large fraction of EσS-binding sites corresponded to promoters recognized by RNA polymerase associated with σ70 or other σ factors, suggesting a considerable overlap in promoter recognition between different forms of RNA polymerase. In particular, EσS appears to contribute significantly to transcription of genes encoding proteins involved in LPS biosynthesis and in cell surface composition. Finally, our results highlight a direct role of EσS in the regulation of non coding RNAs, such as OmrA/B, RyeA/B and SibC.
Bacteria are constantly exposed to changes and fluctuations in their environment, to which they can adapt by reprogramming their gene expression through various mechanisms, including use of alternative σ factors. σ factors are accessory subunits of bacterial RNA polymerase that associate, in a 1:1 stoichiometric ratio, to the core enzyme (E), i.e., the multi-subunit complex responsible for RNA polymerase catalytic activity. Binding to any of the different alternative σ factors creates different RNA polymerase holoenzymes (Eσ), proficient in specific promoter recognition and transcription initiation. After the process of transcription initiation has taken place, the σ factor dissociates from the holoenzyme, and the core enzyme carries out transcription elongation1. The number of σ factors varies considerably among bacteria: seven σ factors are known to be present in Escherichia coli, including σ70 (or σD), the “housekeeping” σ factor devoted to transcription of a large part of the genome and of most essential genes. In contrast, alternative σ factors are responsible for the transcription of smaller subsets of genes, fulfilling specific roles or belonging to defined functional groups2. One alternative σ factor, σS, strongly affects cell survival during stress conditions, such as starvation, oxidative stress, and exposure to either low or high pH, and controls expression of virulence factors in several pathogens3. For its important role in response to cellular stresses, σS is considered the master regulator of the so-called “general stress response” and, consistently, it is induced in response to any stressful event leading to reduction in specific growth rate4,5.
Interestingly, σS and σ70 appear to recognize very similar promoter sequences6. Consequently, several promoters are recognized with similar efficiency by both EσS and Eσ70 in vitro7, and their preferential recognition by either form of RNA polymerase in vivo is mediated by accessory regulatory proteins6. Selective promoter recognition by either σ70 or σS can be achieved by deviations from a common consensus sequence6,8 which confer specificity for either σ factor: for instance the presence of a C nucleotide (−13C) immediately upstream of the −10 promoter element is a known determinant for σS binding and it is a common feature in σS-dependent promoters9. In a previous work, we set out to determine which promoters are preferentially bound in vitro by either Eσ70 or EσS by run-off transcription microarray (ROMA); we confirmed the importance of sequence elements important for promoter recognition by σS, such as the presence of C residues at positions -13 and -12 C element, and suggested that an A/T-rich discriminator region would favour transcription initiation by EσS in vitro10.
In this work, we used Chromatin-Immunoprecipitation-sequencing (ChIP-seq) to identify promoters bound by EσS at early stationary phase, i.e., at a moment in which σS accumulates inside the bacterial cell. Our results led to identification of novel σS-dependent genes, and provided insight on regulation of non-coding RNAs by σS. We could also show that a significant subset of EσS-bound promoters controls genes whose expression is σS-independent, suggesting considerable overlap in promoter recognition by different σ factors.
Results
MG1655-rpoS His6 construction and σS -His6 immunoprecipitation
Since no anti-σS antibodies suitable for immunoprecipitation were available at the time of this study, we decided to utilize anti-6xHis-tag antibodies targeting a histidine-tagged σS protein (σS-His6). In order to study promoter binding by σS-His6 without perturbing σS physiological levels or rpoS gene expression, we constructed a strain carrying a chromosomal rpoSHis6 allele, i.e., an otherwise wild type rpoS allele with 6 codons for histidine at its 3` end, as described in Materials and Methods. We verified the effects of the rpoS allele replacement on specific growth rate (Fig. 1A) and checked the relative amounts of both the wild type and the σS -His6 proteins at the onset of stationary phase by Western blot, using an anti-σS antibody (Fig. 1A, inset). A Western blot with the anti-6xHis antibody confirmed that the MG1655-rpoSHis6 strain did indeed produce a 6xHis-tagged σS protein (data not shown). No differences were detected in either specific growth rate or intracellular σS amounts in the two strains (Fig. 1A). Western blot analysis clearly showed that, as expected, the amount of σS (or σS-His6) increased significantly at the end of the exponential phase, (compare points 1 and 2): at this point, bacterial cells were growing at a specific growth rate of 0.32 (±0.02) h−1. Cells were collected at the growth stage corresponding to point 2 in Fig. 1A in all subsequent experiments.
Figure 1. Characterization of the MG1655-rpoSHis6 mutant.

A. Growth curves in LB medium of MG1655 (circles) and MG1655-rpoSHis6 (diamonds) strains. Intracellular amount of σS (for MG1655) and σS-His6 (for MG1655-rpoSHis6) as determined by western blot at the onset of stationary phase (points 1 and 2 in the graph) are shown in the inset. B. HPII catalase specific activity in MG1655, MG1655-rpoSHis6 and in the MG1655ΔrpoS strains. Values from three independent experiments were analyzed by ANOVA; the letters indicate samples showing statistically significant differences. C. Determination of relative abundance of the dps promoter region in the Immunoprecipitated (IP) versus the Input sample by RT-PCR. Data are the average of two repeats with identical results.
To verify whether the C-terminal histidine tag might affect σS activity in vivo, we tested the activity of HPII catalase, encoded by the rpoS-dependent katE gene and a marker for rpoS functionality11. No statistically significant difference in HPII specific activity was detected between MG1655 and MG1655-rpoSHis6, while, in contrast, HPII catalase specific activity was almost totally abolished in an rpoS null mutant strain, as expected (Fig. 1B). These results indicate that introduction of the 6xHis-tag in the σS protein does not affect its abundance, physiological regulation and activity. Thus, we performed protein-DNA co-immunoprecipitation experiments in the MG1655-rpoSHis6 strain, using anti-6xHis antibodies. As a quality control of the co-immunoprecipitation experiment, we verified the enrichment of a known binding site for EσS in the immunoprecipitated samples compared to sonicated DNA (Input sample). To this purpose, we performed qRT-PCR experiments comparing the relative abundance of the promoter region of the σS-dependent dps gene (Pdps) to coding sequences within the rpoB and the yeeJ genes. Both the Pdps/rpoB and Pdps/yeeJ ratios approached 1 in the Input sample, while being 10-fold higher in the σS-His6 immunoprecipitation sample (σs-IP; Fig. 1C), thus suggesting strong enrichment in EσS binding sites by the immunoprecipitation procedure.
Chromatin immunoprecipitation-sequencing (ChIP-seq)
Two replicates of the Input sample (MG1655-rpoSHis6 chromosomal DNA) and of the σS-IP sample (σS-His6 immunoprecipitated DNA) were used to prepare sequencing libraries. The libraries were sequenced into 4 separate lanes of the same GAIIx run. We obtained more than 50 million mapping reads for both the input samples (corresponding to a sequencing depth of 543-fold the E. coli genome); for the first and the second IP samples, more than 26 and 32 million mapping reads were obtained, respectively. Identification of the DNA regions more represented in the σs-IP sample, corresponding to potential binding sites for EσS, was carried out using the CisGenome software12, which yielded 78 “peaks”, i.e., regions of the genome significantly enriched (pval ≤ 0.01) in the σs-IP sample as compared to the Input sample. Almost all peaks detected (72/78) corresponded to DNA regions ≤400 bp-long or slightly larger, consistent with the DNA fragment sizes obtained after DNA sonication (see Materials and Methods, “σS-His6 immunoprecipitation”). Three enriched regions were slightly larger in size (500-700 bp), while only three regions had sizes larger than 1kbp (1049, 1199 and 3149 bp, respectively). The last one encompassed a DNA region including five different ORFs and several non-coding and regulatory elements, making it impossible to identify a putative binding site for EσS; thus, this DNA fragment was excluded from further analysis and is listed, together with intragenic peaks, in Supplementary Table S2 (see below). On the contrary, the two peaks just over 1 kbp overlapped a single known promoter region, and were thus included in the EσS binding site analysis shown in Table 1. The visualization through Integrative Genome Viewer (IGV) of representative σS binding peaks obtained from the CisGenome analysis is shown in Fig. 2: significantly enriched genomic regions (i.e., peaks) are reported for the known rpoS-dependent genes osmB, dps, osmE and csrA (Fig. 2A) and for loci associated to the small RNAs sibC/ibsC, ryeA/ryeB, and omrA/omrB (Fig. 2B; see also section “Regulation of non-coding RNA by EσS”).
Table 1. Location of putative EσS binding sites attributable to a specific promoter region.
| peak start | peak end | downstream gene* | chromosome strand | experimentally validated TSS located inside peak | Gene function | References showing gene regulation by σS or by other alternative σ factors |
|---|---|---|---|---|---|---|
| 63400 | 63538 | hepA | - | RNA-polymerase associated ATPase | 13 (σH ) | |
| 106436 | 106616 | lpxC | + | 106530 | UDP-3-O-acyl-N-acetylglucosamine deacetylase (lipid A biosynthesis) | 18 |
| 262040 | 262202 | thrW | + | threonyl-tRNA | ||
| 392250 | 392349 | insEF-2 | - | IS-3 transposase | 17 | |
| 406100 | 406199 | yaiA | + | unknown, oxidative stress | 16 | |
| 437329 | 437469 | yajO | - | putative NAD(P)H-dependent xylose reductase | 16 | |
| 479920 | 480115 | tomB | - | antitoxin in tomB/hha T/A system | ||
| 574850 | 575099 | insH-2 | - | IS-5 transposase | ||
| 837550 | 837849 | ybiI | - | unknown | ||
| 848050 | 848349 | dps | - | 848173 | stationary phase nucleoid component/ferritin | 14,15,16 |
| 1215900 | 1216399 | ymgC | + | involved in biofilm formation | 15 | |
| 1219400 | 1219949 | ycgH | pseudogene- autotransporter | |||
| 1236420 | 1236526 | ycgB | - | 1236508 | unknown | 15,16 |
| 1341304 | 1341480 | osmB | - | 1341393 | osmotically inducible lipoprotein | 15,53,54 |
| 1430250 | 1430549 | tfaR | + | Rac prophage tail fiber assembly protein, induced in biofilms | ||
| 1509526 | 1509697 | ydcS | + | 1509623 | polyamine transporter | 15,16,55 |
| 1524000 | 1524199 | ansP | - | 1524035 / 1524044 | arginine transporter | 14,18 |
| 1608700 | 1608949 | uxaB | - | 1608744 | galacturonate degradation | |
| 1687744 | 1687907 | ydgA | + | 1687818 | unknown, involved in swarming motility | 16,18 |
| 1755350 | 1755499 | lpp | + | 1755407 | Braun lipoprotein | |
| 1756820 | 1756885 | ynhG | - | transpeptidase, associated to Lpp | 15,16 | |
| 1894663 | 1894896 | sdaA | + | 1894833 | serine deaminase | 13 (σH) |
| 1905547 | 1905784 | yobF | - | 1905641 | stress response protein | |
| 1920033 | 1920203 | yebW | + | unknown | ||
| 1921150 | 1921299 | ryeB | - | small RNA, antisense of small RNA ryeA | 10,29 | |
| 2026384 | 2026505 | yodC | - | unknown | 15,16 | |
| 2061261 | 2061484 | erfK | - | transpeptidase, associated to Lpp | 16 | |
| 2103850 | 2104199 | wbbI | - | β-1,6-galactofuranosyl-transferase, LPS O-antigen | ||
| 2104550 | 2105599 | wbbH | - | LPS O-antigen polymerase | ||
| 2190800 | 2190949 | yehE | - | unknown | ||
| 2225279 | 2225390 | yohF | - | predicted acetoin dehydrogenase | 16 | |
| 2468677 | 2468882 | tfaS | + | CPS-53 prophage tail protein | ||
| 2663364 | 2663501 | csiE | + | 2663423 | stationary phase inducible gene | 15,16,56 |
| 2734910 | 2735081 | raiA | + | ribosome inhibitor, stationary phase-dependent | 13 (σH); 19 | |
| 2753502 | 2753707 | ssrA | + | 2753608 | tmRNA | |
| 2758300 | 2758999 | yfjJ | + | CP4-57 prophage protein | 17 | |
| 2797100 | 2797249 | alaE | + | alanine exporter | ||
| 2817227 | 2817395 | csrA | - | 2817295 | RNA-binding protein, translational regulator | 18,57 |
| 2924252 | 2924370 | ygdH | + | unknown | 19 | |
| 2974153 | 2974278 | omrA | - | 2974211 | small regulatory RNA | 30 |
| 2991100 | 2992299 | ygeI | + | unknown | ||
| 3054792 | 3054952 | sibC | + | 3054873 | small regulatory RNA | |
| 3058600 | 3058749 | scpA | + | methyl-malonyl-CoA mutase | ||
| 3066050 | 3066149 | yggE | - | 3066148 | unknown, oxidative stress | 14,16 |
| 3235233 | 3235381 | ygjR | + | 3235304 | predicted dehydrogenase | |
| 3598950 | 3599099 | rpoH | - | alternative sigma factor (sigma32) | 35 | |
| 3637750 | 3637949 | uspB | - | 3637871 | universal stress protein B | 16,18,58 |
| 3706750 | 3706999 | proK | - | prolinyl-tRNA | ||
| 4361287 | 4361432 | yjdC | - | 4361353 | putative transcriptional regulator | 16 |
| 4437000 | 4437349 | ytfJ | - | 4437309 | unknown, periplasmic protein | 19; 59 (σE) |
*Genes for which regulation by σS has already been shown (see last column) are indicated in boldface type; genes with promoter DNA regions that were studied in vitro are underlined.
Figure 2. Visualization through IGV of the binding peaks obtained from CisGenome analysis.

The blue profiles show the IP and Input tag density profiles for the known rpoS-dependent genes osmB, dps, osmE and csrA (A) and for the loci associated to the non-coding RNAs sibC/ibsC, ryeA/ryeB, and omrA/omrB (B). The red profiles show the log2 signal to control enrichment estimates values obtained using spp (peaks) for the same genes and non-coding RNAs. Values on X axis are the genomic coordinates of the peaks; a representation of the corresponding gene/intergenic regions taken from Ecocyc (ecocyc.org) is shown.
The large majority (63 out of 78) of the σS-IP peaks was located immediately upstream of coding sequences or known regulatory RNAs, consistent with σS binding to promoter regions. Out of these 63 peaks, 61 were located in intergenic regions, while two peaks lie within the stfR and wbbH ORFs, but upstream, respectively, of the tfaS and wbbI genes, suggesting that they might define internal promoters within operons. The remaining peaks fell into intragenic regions at considerable distance from other ORFs (listed in Supplementary Table S2). Although it is possible that some of these peaks might define bona fide EσS binding sites (e.g., promoters for yet unknown antisense RNAs), they were not considered for further characterization within this study. However, even assuming that all the intragenic peaks are artefacts of ChIP-seq, the resulting percentage of false positives (19%) would still be lower than what reported for similar studies13.
50 out of the 63 peaks corresponding to known or putative promoter regions could unequivocally be attributed to one specific gene, based on the DNA sequence covered by the peak, the direction of transcription of the neighbouring genes, the distance to the nearest ORFs and, when available, the presence of an experimentally determined transcription start site within the boundaries of the peak. Of the 50 genes unequivocally identified, 27 had been shown to be at least partially rpoS-dependent in previous reports, as listed in Table 1. In contrast, 13 peaks, listed in Table 2, lie in intergenic regions between divergently transcribed genes or operons and could not be assigned to a specific gene. However, we often found that one of the two divergent genes (or even both, as for the dsrB-yodD intergenic region, Table 2) had previously been described as rpoS-dependent, thus suggesting that EσS binding was due the presence of an rpoS-dependent promoter within the intergenic region. As an example, we assigned the putative EσS binding site in the osmE-nadE intergenic region to osmE, since its promoter is σS-dependent14,15,16 (Fig. 2 and Table 2).
Table 2. Location of putative EσS binding sites in intergenic regions between divergent genes.
| peak start | peak end | nearest gene* (- strand) | Gene function | experimentally validated TSS inside the peak | nearest gene* (+ strand) | Gene function | References showing gene regulation by σS or by other alternative σ factors |
|---|---|---|---|---|---|---|---|
| 1257750 | 1258199 | pth | peptidyl-tRNA hydrolase | 1257765 (pth) 1257961 (ychH) | ychH | unknown, oxidative stress | 19 |
| 1288250 | 1288399 | ychJ | unknown | 1288400 (ychJ) 1288329(rssA) | rssA | unknown | 16 |
| 1438800 | 1439049 | ydbK | pyruvate flavodoxin oxidoreductase, involved in oxidative stress | 1439053 (ydbJ) | ydbJ | unknown | |
| 1488650 | 1488949 | (gapC_1) | glyceraldehyde 3-phosphate dehydrogenase (pseudogene) | cybB | cytochrome b561 | 18,19 | |
| 1820250 | 1820349 | osmE | osmotically inducible lipoprotein | 1820307(osmE) 1820326 (nadE) | nadE | NAD synthetase, NH3-dependent | 15,16 |
| 2022850 | 2023149 | dsrB | unknown | yodD | involved in oxidative and acid stress | 15,16,18 | |
| 2493450 | 2493549 | yfdY | biofilm-dependent membrane protein | lpxP | palmitoleoyl acyltransferase (LPS biosynthesis) | 60 (σE) | |
| 2627100 | 2627399 | yfgF | c-di-GMP phosphodiesterase | 2627275 (yfgG) | yfgG | unknown | |
| 2903350 | 2903649 | queE | conserved protein | ygcG | small protein involved in cell envelope stress | 17 | |
| 3851100 | 3851399 | istR-1/istR-2 | regulatory small RNA for tisB | 3851215-3851280 (istR) 3851360 (tisB) | tisB | toxic peptide | |
| 4124850 | 4125049 | priA | DNA replication restart factor | 4124931 (rpmE) | rpmE | L31 ribosomal protein | 13 (σH) |
| 4414650 | 4414899 | bsmA | biofilm-dependent protein involved in oxidative stress | yjfP | esterase | 10,19 | |
| 4434400 | 4434749 | cpdB | 2'3' cyclic nucleotide phosphodiesterase and nucleotidase | 4434652 (cpdB) | cysQ | adenosine 3'-5' bisphosphate (PAP) nucleotidase | 19 |
*Genes for which regulation by σS has already been shown (see last column) are indicated in boldface type; genes with promoter DNA regions that were studied in vitro are underlined.
Altogether, the peaks identified in the ChIP-seq experiment overlapped with the promoters of 36 genes that had been shown to be at least partially rpoS-dependent (highlighted in Tables 1 and 2). Stress-related genes defined the most represented functional category in our ChIP-seq analysis (see Tables 1, 2, ), in agreement with the role of σS as master regulator of the general stress response. Interestingly, binding sites for EσS were also found upstream of several genes involved in cell envelope structure (erfK, lpp, ynhG) and lipopolysaccharide (LPS) biogenesis (lpxC, wbbH, wbbI), suggesting that EσS might be important for the expression of cell surface-related genes in response to growth cessation.
The majority of the intergenic regions not linked to rpoS-dependent genes included known or putative promoters recognized by Eσ70, in agreement with previous results indicating extensive cross-recognition between EσS and Eσ70 regulons7,9. Interestingly, however, several promoters are also recognized by other alternative σ factors, namely σE (ytfJ and lpxP) and σH (hepA, sdaA, raiA and rpmE) (Tables 1, 2, ).
In vivo expression of genes identified by ChIP-seq analysis
The results of our ChIP-seq experiments seem to indicate that a large percentage of EσS-binding sites are associated with promoters directing transcription of rpoS-independent genes. Alternatively, regulation of these genes by σS might have been overlooked in previous investigations of the rpoS regulon, mostly carried out as whole genome transcription analysis comparing an rpoS mutant to its parental strain14,15,16,17,18,19. In order to elucidate the functional role of the EσS-binding sites, we measured relative expression of 10 genes whose promoters, according to our ChIP-seq results, are recognized by EσS, by performing qRT-PCR experiments comparing E. coli MG1655 to its otherwise isogenic rpoS mutant. As control genes in the qRT-PCR experiment, we chose 4 genes previously proposed to be rpoS-dependent: dps, ycgB, rssA and bsmA15,16,20. The remaining 6 genes, never previously shown to be rpoS-dependent, were selected based either on their function or on promoter features: lpp encodes Braun lipoprotein, which bridges the outer membrane to peptidoglycan and is extremely abundant in E. coli21; ssrA is a transfer-messenger RNA (tmRNA)-encoding gene; uxaB is involved in galacturonate metabolism; ybiI is a gene of unknown function whose promoter had been indicated as putative EσS-dependent through bioinformatics prediction22; ydbK is an oxidative stress-related gene23; ygjR, like ybiI, is an unknown function gene with a known transcription start site24, whose putative −10 region shows some features typical of EσS-dependent promoters, such as the −13C.
Results of the qRT-PCR experiments (Fig. 3) could demonstrate rpoS-dependent gene expression for dps, ycgB, ybiI and ydbK, suggesting that the latter two are yet unidentified members of the rpoS regulon. In contrast, the expression of the remaining genes was not affected by the lack of a functional rpoS gene, at least in the conditions tested. To further investigate whether these genes showed any kind of dependence on σS, we tested their expression levels in a rpoS-overexpressing strain (MG1655/pBADrpoS) grown to early stationary phase in LB medium supplemented with 0.1% arabinose. Although intracellular σS amounts were almost 10-fold higher in the pBADrpoS-bearing strains compared to MG1655, no significant changes in relative expression levels were detected for any of the genes tested (data not shown).
Figure 3. RT-PCR analysis.
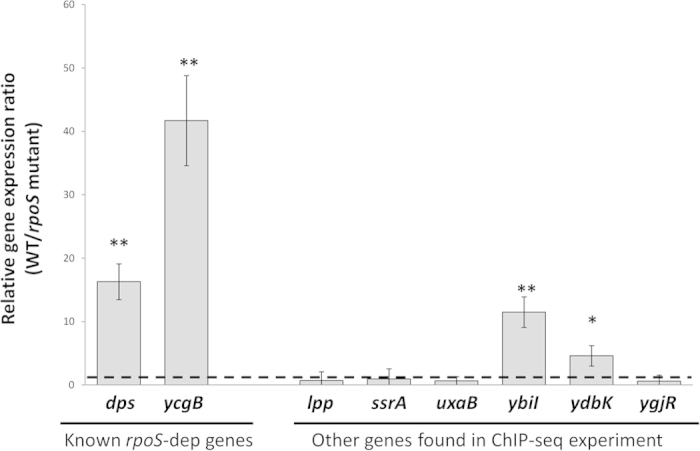
The Relative expression ratio between WT and rpoS mutant indicated in the graph are the average of at least four experiments (two repeats, each performed on duplicate samples, from two independent RNA extractions), and standard deviations are shown. The asterisks denote significant differences (*=p < 0.05; **= p < 0.01 Tukey multigroup analysis). The dashed line indicates a WT/rpoS mutant expression ratio=1.
In vitro EσS-promoter interactions
Results of the ChIP-seq and qRT-PCR experiments failed to show strong correlation between EσS promoter binding and EσS-dependent transcription, even for genes previously described as rpoS-dependent, such as rssA and bsmA (Fig. 3). In order to confirm ChIP-seq results, we studied EσS-promoter interactions in vitro, by comparing EσS and Eσ70 for their ability to bind and to promote open complex formation at a subset of the promoters studied in qRT-PCR experiments. We selected the promoter regions of the two newly identified rpoS-dependent genes, ybiI and ydbK, together with the promoters of the known rpoS-dependent dps and bsmA genes, which, however, showed different behaviour in our qRT-PCR experiments. Firstly, we performed GMSA with either EσS or Eσ70, in the presence of heparin to select for open complexes, on regulatory DNA fragments (extending from 250 bp upstream to 30 bp downstream of the start codon). EσS was clearly more efficient than Eσ70 in promoting open complex formation at the ybiI, ydbK and bsmA promoters (compare amounts of unbound DNA probes, Fig. 4A), while both forms of RNA polymerase showed similar proficiency in open complex formation at the dps promoter, despite its strong EσS-dependence in vivo (Fig. 3; 8,16). As a negative control for binding by EσS, we performed GMSA experiments on the strictly Eσ70-dependent crl promoter, which clearly showed preferential binding by Eσ70 (Supplementary Fig. S1).
Figure 4. EσS-promoter interactions in vitro.

A. Gel retardation assays performed in K-glutamate buffer with heparin challenge. B. KMnO4 reactivity assays: both EσS and Eσ70 forms of RNA polymerase were tested at 50 nM. For each panel, the first lane is a molecular weight marker obtained as a G+A sequencing reaction of the DNA fragment. C. Sequence of the newly identified bsmA, ybiI and ydbK promoters. Sequences are given from position −17 to +10 according to the transcription start site (TSS) labelled “+1” and indicated in bold. The −10 promoter element is underlined. KMnO4-reactive thymidine residues in the template strand (labelled with 32P) reactive in the KMnO4 assays are indicated in bold.
To further investigate promoter DNA-RNA polymerase interaction, and to map the exact location of the -10 promoter elements for ybiI, ydbK and bsmA, we performed KMnO4 reactivity assays (Fig. 4B). Treatment with permanganate oxidizes thymidine residues in single-stranded DNA, allowing us to identify precisely the location of open complexes. As expected, no open complex formation by EσS was detected at the Eσ70-dependent crl promoter (Supplementary Fig. 1). In contrast, open complex formation at the bsmA promoter was only observed in the presence of EσS, consistent with GMSA results and confirming specific recognition by EσS at this promoter . Similarly, at the ybiI promoter, binding by EσS resulted in much stronger reactivity than Eσ70, indicating more efficient open complex formation. A more complex picture emerged from KMnO4 experiments at the ydbK promoter, which showed that both EσS and Eσ70 can recognize a promoter located, in agreement with bioinformatics predictions22, at ca. 70 nucleotides upstream of the ydbK ORF. However, subtle changes can be observed in the pattern of KMnO4 reactivity induced by the two RNA polymerase-promoter complexes, with binding by EσS resulting in higher reactivity in the T residues at positions −4 to −2 (marked by an arrow in Fig. 4B). Taken together with GMSA results, this observation suggests that, at the ydbK promoter, EσS might trigger formation of an open complex more resistant to heparin challenge and possibly more proficient in transcription initiation. Finally, at the dps promoter, both EσS and Eσ70 induced open complex formation with equal efficiency, indicating lack of preferential recognition by either form of RNA polymerase in vitro.
Regulation of non-coding RNAs by EσS
Results of ChIP-seq analysis indicate that three EσS binding sites are positioned in the proximity of genes encoding regulatory RNAs. A putative EσS binding site was identified upstream of the 88 nt-long regulatory RNA omrA, which controls expression of genes involved in flagellar motility, iron uptake, adhesion factors and various outer membrane proteins25. The omrA gene lies next to omrB, which codes for a highly similar small RNA and also regulates some of the targets for omrA25,26. The other two EσS binding sites were found in proximity of two complex loci: the ryeA/ryeB locus, which includes two small RNAs overlapping in antisense directions27, and the sibC/ibsC locus, in which a non coding RNA (sibC) overlaps a small ORF, ibsC, reading in the opposite direction, and encoding a toxic peptide28. The location and extension of the three ChIP-seq peaks suggest that EσS might bind the promoter regions of omrA (but not omrB), and of ryeB and sibC, rather than ryeA and ibsC (Fig. 2B), consistent with recent observations that omrA and ryeB are rpoS-dependent in Salmonella enterica29,30. To confirm this result, we performed northern blots comparing small RNA levels in the wild type versus the rpoS mutant strain of E. coli (Fig. 5). In addition to standard growth conditions (LB medium at 37 °C), we also carried out northern blot experiments at 28 °C, since low growth temperature favors σS accumulation and positively affects stability of some small RNA31. Due to difficulties in obtaining a clean result with a probe for RyeB, we measured the relative amounts of RyeA, which upon pairing with RyeB, is degraded in an RNaseIII-dependent fashion and shows therefore transcript levels inversely proportional to ryeB27,29. Inactivation of the rpoS gene almost abolished omrA transcription, while strongly increasing RyeA transcript levels (Fig. 5A), consistent with rpoS-dependence of transcription of the omrA and ryeB genes. Interestingly, the OmrA and RyeA transcripts also displayed opposite temperature-dependence, with OmrA being more expressed at 28 °C and RyeA at 37 °C. As further confirmation that rpoS-dependent regulation specifically targets omrA, but not omrB, we performed gfp reporter assays. Reporter genes experiments clearly showed very different effects of rpoS inactivation on transcription of the two genes, with omrA showing almost complete rpoS-dependence, while omrB expression was actually slightly increased in the rpoS mutant background (Fig. 5B). Interestingly, the first nucleotide of the −10 region of omrA is a −12C (Supplementary Table S3), a feature favouring specific promoter opening by EσS but not by Eσ70 32, while at the omrB promoter, such a selective determinant is replaced by a canonical −12T for Eσ70 and might explain lack of preferential binding by EσS. Substitution of the −12C nucleotide by a −12T in the omrA −10 promoter element increases promoter strength by more than 10-fold and almost completely overcomes its dependence on rpoS (Fig. 5C), suggesting that the −12C act as a determinant for EσS specificity in the omrA promoter. A more complex picture emerged from analysis of the SibC transcript, which, like RyeA, showed increased expression at 37 °C than at 28 °C. At the latter temperature, SibC was transcribed in an rpoS-dependent manner; however, the effect of the rpoS mutation was reversed at 37 °C, possibly suggesting additional regulatory mechanism affecting SibC expression at this temperature (Fig. 5A). The complexity of SibC regulation is also suggested by the presence of two transcripts, either due to the presence of multiple promoters or to RNA processing as already described28.
Figure 5. Regulation of small non-coding RNAs by σS.

A. Northern blot hybridization. RNA were extracted at the onset of stationary phase (OD600nm of 3) from bacteria grown in LB at either 28 °C or 37 °C and probed for SibC, OmrA, and RyeA transcript levels (left to right). Numbers on the right side of each panel indicate the size of the respective ncRNA. The gels were probed for the genes of interest, then the probe was removed by washing and the gels were re-probed for 5S RNA, which was used as internal control. B. Relative fluorescence of transcriptional fusions of the omrA and omrB promoters to the GFP reporter gene. The promoter activity (solid line) is expressed as ratio between the fluorescence and the absorbance of the culture (dashed line) after background correction (RFU/OD600 nm). C. Effects of the substitution of the −12C to a T nucleotide in the omrA promoter region. Data were taken from overnight cultures and are the average of four independent experiments.
Sequence analysis of σS-bound promoters
In order to assess the importance of σS-specific promoter determinants for binding by σS, we analyzed the sequences of the experimentally determined promoters controlling genes identified in the ChIP-seq experiments (30 promoters, listed in Supplementary Table S3). The promoters were divided in two subsets: the ones directing transcription of genes reported to show some level of dependence on σS (21 promoters) and those controlling genes whose expression is not affected by lack of a functional rpoS gene (9 promoters). In good agreement with the previously proposed consensus for σS 4,8,10,16, −10 region alignment of σS-dependent genes (from −20 to +1, Fig. 6) suggests that their consensus sequence in the −17 to −6 region would be TNTGCYAAACTT, where N is any nucleotide and Y is a pyrimidine and W is either A or T (Fig. 6); in addition, promoters of σS-dependent genes are characterized by an A/T-rich discriminator region. Promoters of σS-independent genes lack conservation of the C residues at positions −13, −12, and −8, reduced frequency of a T at position −6, and display a discriminator region richer in G/C (Fig. 6). Alignment of the −35 regions of σS-bound promoters (listed in Supplementary Table S4) highlighted some conservation of the σ70 consensus sequence, TTGACA, in the promoters of genes whose expression is independent of σS ; in contrast, in the promoters of σS-dependent genes, the −35 region showed a weakly conserved sequence, GCTGACAAA, with some resemblance to the −35 promoter element for σ70 (Supplementary Fig. S2). It remains to be understood whether this sequence might play any role in σS –promoter interactions.
Figure 6. Promoter sequence alignment.
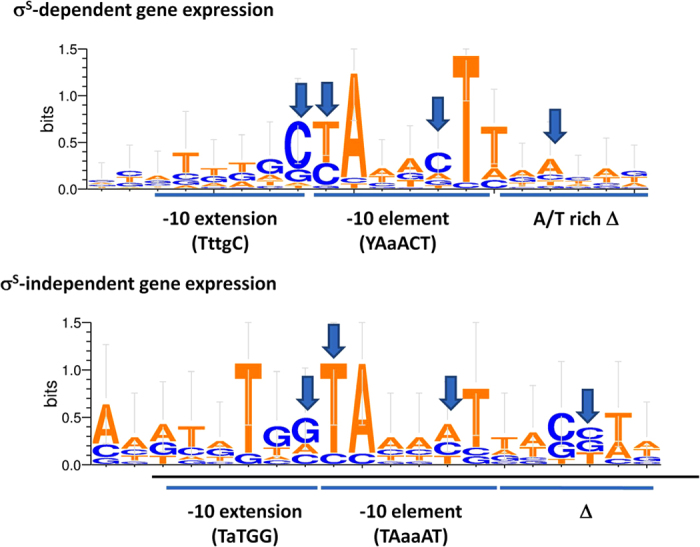
Weblogo 3 (http://weblogo.threeplusone.com/) representation of the sequence alignments for experimentally identified promoters located within EσS binding sites. −10 regions of either σS-dependent (top panel) or σS-independent genes (bottom panel) were aligned setting the first nucleotide of the −10 hexamer as −12 position. Promoter sequences are reported in Table S3.
Discussion
In this work, we used a ChIP-seq approach in order to identify promoters bound by EσS during the early stationary phase, in which σS concentrations surge in the bacterial cell (Fig. 1A). The experimental conditions used in this work were chosen in order to identify genes directly regulated by σS that are induced in response to transition into stationary-phase. Indeed, we only detected 63 promoter regions bound by EσS (Tables 1, 2, ); this number only represents a fraction of the σS-bound promoters previously identified either by microarray or by ChIP-on-chip analysis14,19,33, which, however, were performed under a variety of different growth conditions and include genes subject to complex regulation and only indirectly regulated by σS. Out of the 63 promoters identified in our study, 38 (60%) control transcription of genes regulated by the σS-encoding rpoS gene (Tables 1, 2, and references within). Two of these, ybiI and ydbK, had not yet been identified as part of the rpoS regulon, and we confirmed their preferential recognition by EσS via in vitro binding and open complex formation experiments (Fig. 4). However, a large percentage of σS-bound promoters control genes whose expression is not affected by the presence of this factor (see Tables 1, 2, , Fig. 3), suggesting that these promoters are recognized with similar efficiency by σS and other σ factors, mostly σ70. This result is consistent with the notion that σS does not only serve to promote expression of its own regulon, but it can also contribute to transcription of constitutively expressed genes. Promoter sequence comparison between bona fide σS-dependent genes and those not showing altered expression in an rpoS mutant highlighted the importance of the promoter elements associated with selective recognition by σS (Fig. 6). At least some σS-specific determinants might be more important for preventing recognition by σ70 in vivo rather than increasing binding affinity or promoter opening by σS, such as the presence of a C rather than a T as first nucleotide of the −10 hexamer, as is the case at the omrA promoter (Fig. 5C). Although the mechanisms of regulation by σS appear to be well conserved in Enterobacteria, some of the σS-independent genes found in our ChIP-seq analysis (e.g., tomB, sdaA, bsmA) appear to be rpoS-dependent in Salmonella Typhimurium30, possibly suggesting more efficient promoter recognition by EσS in this bacterium.
Promoter cross-recognition with σS also seems to extend to the alternative factors σE and σH (Tables 1, 2, ), in line with previous results showing similar functions of the rpoE and rpoS regulons and some promoter overlap between the two σ factors in vitro10,34. Indeed, our results confirm a strong interplay between σS and σH, as the rpoH promoter is directly recognized by EσS (Table 1), in agreement with its rpoS-dependent expression35. Our results would be consistent with recent reports showing co-regulation of the rpoE, rpoH and rpoS regulons in response to osmotic stress in enteropathogenic E. coli O157:H736, and an extensive analysis of the σ factor network in E. coli, showing extensive overlap in promoter recognition by alternative σ’s33.
At least 10 of the rpoS-dependent genes identified in the ChIP-seq experiments encode small proteins involved in resistance to oxidative stress (bsmA, dps, uspB, yaiA, ychH, ydbK, ygcG, yggE, yobF and yodD: Tables 1, 2, ), while two more are linked to osmotic stress (osmB and osmE). Our results would support the notion that, rather than being part of an adaptive response triggered by exposure to specific environmental stresses, the rpoS gene activates, in response to reduction in growth rate, a variety of stress-related genes, thus allowing the bacterial cells to “brace themselves” for any stressful conditions that might arise. However, promoter binding by EσS does not necessarily translate in increased transcription levels for EσS-dependent genes, suggesting that, upon binding, EσS might be unable to initiate transcription efficiently at some promoters. For the bsmA promoter, this hypothesis would fit with the results of in vitro promoter interaction studies (Fig. 4) and with our previous results, showing EσS-dependent transcription of the bsmA gene in vitro10, but not in the bacterial cell. Since bsmA is induced in biofilm growth37, it is possible that its transcription is repressed in planktonic cells, and triggered during biofilm growth. Thus, our results suggest that EσS might be poised at various promoters waiting for additional signals (e.g., leading to removal of a repressor protein) in order to form a complex proficient in transcription initiation.
While stress responses are well known examples of gene functions associated with the rpoS regulon, our results suggest direct involvement of σS in the expression of genes involved in biogenesis and structure of the LPS and outer membrane proteins (Tables 1, 2, ). Indeed, changes in cell surface structure and composition are known to take place in stationary phase38. According to our ChIP-seq results, in addition to LPS genes, EσS also binds to the promoter of lpp, encoding Lpp or Braun lipoprotein, which links the outer membrane to peptidoglycan and is the most abundant outer membrane-associated lipoprotein in E. coli21. Although lpp gene expression does not depend on the rpoS gene (Fig. 3), a connection of the rpoS gene with the function of Braun lipoprotein is further suggested by the identification of two more binding sites for EσS upstream of the erfK and ynhG genes, encoding two of the four alternative transpeptidases that crosslink Lpp to peptidoglycan. Both the erfK and ynhG genes had already been described as rpoS-dependent15,16. Thus, it appears that, upon entry in the stationary phase of growth, rpoS might be required for maintenance of Lpp-transpeptidase activity in the periplasmic space.
Finally, our results point to a direct role of EσS in the finely tuned regulation of non-coding RNAs: for instance, EσS promotes transcription of omrA, but not of the flanking gene, omrB (Fig. 5). Both genes encode very similar non-coding RNAs which target the same genes. It appears possible that different dependence on EσS by the two promoters might have evolved so to allow differential expression of the OmrA and OmrB non-coding RNAs in response to different signals, with OmrA induced as part of the rpoS regulon. The results of mutagenesis at the -12 position of the omrA promoter strongly reinforce the notion that the -12C nucleotide can favourably bias transcription initiation by EσS at several promoters39. Since both the OmrA and OmrB RNAs affect translation of several outer membrane proteins and extracellular structures such as curli and flagella40, their selective regulation might mediate the impact of EσS on these structures, contributing to a general reorganization of the bacterial cell surface in response to stationary phase.
Methods
Strain construction
The E. coli MG1655 His6::rpoS strain (from now on MG1655-rpoSHis6), carrying an rpoS gene in which a 6-histidine tag is added to an otherwise wild type allele, was constructed following the genetic procedures described for allele replacement41,42. Linear DNA fragments containing a kanamycin resistance gene and the ccdB gene under the control of a rhamnose inducible promoter were amplified by PCR from the pKD45 plasmid. The first 45 nucleotides of either primer used for amplification (primers rpoS_OF and rpoS_OR, Supplementary Table S1) correspond to the DNA regions immediately upstream and downstream of rpoS, targeting the gene for mutagenesis. After PCR amplification, the resulting DNA fragment including the kanR-ccdB cassette was used to transform the DY330 strain42; the rpoS knockout was then P1-transduced into MG1655, selecting for kanamycin resistance. The ΔrpoS::kanR-ccdB cassette was then replaced by an otherwise wild type rpoS sequence to which an additional sequence coding for a 6-histidine tag (6xHis-tag) had been added by PCR amplification, using the rpoS_IF and rpoS_IR primers (Supplementary Table S1). To this aim, DY330 cells carrying the rpoS knockout were transformed by electroporation with a linear DNA fragment encoding for the rpoSHis6 gene, carrying the His-tag at the 3` end. Transformant selection was performed on M9 minimal medium agar plates containing 0.2% rhamnose and 0.01% biotin: due to the toxicity of the ccdB gene in the presence of rhamnose, only the cells in which an allele replacement has taken place are able to grow on this medium. The rpoSHis6 allele was P1-transduced into MG1655 carrying the rpoS::kan-ccdB knockout, again selecting for loss of the ccdB gene by plating on M9 minimal medium agar plates containing 0.2% rhamnose and 0.01% biotin. The stability and functionality of the RpoS protein was verified by Western blot and measurement of HPII catalase activity.
σs -His6 immunoprecipitation
For immunoprecipitation of the σS protein carrying a 6xHis-tag at its C-terminal end (σS-His6), the MG1655-rpoSHis6 strain was grown in 50 ml LB medium at 37 °C with vigorous shaking to an OD600 = 3.0. In order to enrich the amount of RNA polymerase bound to promoters, cells were treated with rifampicin, which inhibits transcription initiation blocking RNA polymerase at the transcription start site, following the protocol described43. To obtain protein-DNA crosslinking, formaldehyde was added at a final concentration of 1% for 5 minutes at room temperature. The crosslinking reaction was stopped by addition of 0.25 M glycine followed by 20 minute incubation at 4 °C with gentle shaking. The cells were washed, resuspended and treated with 100 μg/ml lysozyme for 30 minutes at 37 °C. The lysate was sonicated in order to fragment chromosomal DNA to a size between 100-400bp, and treated with RNaseI (100 μg/ml) for 15 minutes at 37 °C. Cells debris was removed by centrifugation (10 minutes at 10000Xg). A 250 μl-fraction of the sample was treated with 100 μg/ml Proteinase K and 5 mM CaCl2 for two hours at 42 °C, and then at 65 °C overnight, to remove proteins non specifically bound to DNA. DNA was recovered by phenol-chloroform extraction and analyzed on a 2% agarose gel to verify DNA fragmentation. The sample was mixed at a 5:1 (vol:vol) ratio with protein A/G agarose slurry and incubated for 2 h at 4 °C on a rotating wheel to clear the sample and reduce unspecific binding. Subsequently, the agarose beads were separated from the lysate by centrifugation at 10000Xg. The cleared lysate was then incubated at 4 °C overnight on a rotating wheel with 5 μl of antibody (rabbit polyclonal to 6XHis-tag, ChIP grade, #9108, Abcam, Cambridge, UK). The rest of the procedure was carried out as previously described44.
DNA from untreated MG1655-rpoSHis6 was sonicated and 200 μl were taken to be used as a control in sequencing reactions (Input=non-immunoprecipitated DNA). The Input and immunoprecipitated DNA samples were analyzed with the Agilent Bioanalyzer using the High Sensitivity DNA kit (Agilent Technologies). Five IP samples were pooled on the same DNA purification column (minElute, QIAGEN) to reach 5 ng of total DNA, which is the minimum amount for sequencing library preparation. Two pools of IP DNAs were produced. Prior to sequencing libraries construction, quantitative Real Time reverse transcriptase-PCR (qRT-PCR) was carried out to assess the enrichment of the promoter region of the rpoS-dependent dps gene in the immunoprecipitated samples in comparison to the Input sample. The sequences of the primers used for qRT-PCR are listed in Supplementary Table S1.
Library preparation and sequencing procedure
Illumina libraries were prepared either from 5 ng of each of the two pools of immunoprecipitated-DNA (RpoS-IP) or from 5 ng of the two control DNA (Input) following the Illumina TruSeq ChIP-seq DNA sample preparation kit; then each library was sequenced in a lane of a single strand 51 bp Illumina run on a GAIIx sequencer. Raw data are publicly available at Sequence Reads Archive under accession number BioProject SRP041323; BioSample SRS595203; Experiment SRX523029; Run1 SRR1265068; Run2 SRR1271103.
Statistical and bioinformatic data analysis
Raw reads were mapped against the Escherichia coli MG1655 genome using Bowtie45 with zero mismatches. The resulting BAM files were processed using SAMtools46 and BEDTools47. The quality of each sequenced sample was checked using cross-correlation analysis implemented in spp R package48. ChIP-seq peak calling was performed using CisGenome12 by imposing default parameters. Input data (control DNA) was used to model the background noise.
Determination of rpoS-dependent gene expression in vivo
For all gene expression experiments, bacterial strains were grown in LB medium to OD600nm = 3.0. For qRT-PCR, RNA was extracted and experiments performed as previously described49, using 16S RNA as reference. Primers used in qRT-PCR experiments are listed in Supplementary Table S1. For northern blots, total RNA was extracted using a hot-phenol procedure, so to maintain small RNA molecules. 5 to 20 μg of RNA were separated onto a 6% denaturing acrylamide gel prior to their electro-transfer onto a nylon membrane. As gene specific probes, 5`-Biotinylated oligomers (Supplementary Table S1) were used at 1 nM in combination with 20 pM of the 5S RNA probe as internal control. Saturation and hybridization were performed with the ULTRAhyb®-Oligo buffer (Ambion) at 45 °C and signals were detected using a Chemi nucleic acid detect wmodule (Thermo Scientific Pierce). GFP reporter assays were performed as previously described50.
RNA polymerase in vitro assays
RNA polymerase reconstitution, gel mobility shift and KMnO4 reactivity assays were performed as previously described32. 32P-labeled DNA was produced by PCR after 5`-phosphorylation of the primer complementary to the coding strand (see Supplementary Table S1) in order to generate linear DNA pieces of about 250 bp, typically encompassing the first 10 codons of the gene and 220 bp of the upstream DNA, including the promoter region. For gel mobility shift assays (GMSA), complexes between reconstituted RNA polymerase (18 to 150 nM) and DNA (1 nM) were allowed to form for 15 min at 37 °C in K- glu100 buffer (40 mM HEPES, pH 8.0, 10 mM magnesium chloride, 100 mM potassium glutamate, 4 mM dithiothreitol (DTT), and 500 μg/ml bovine serum albumin), in a final reaction volume of 10 μl. The reaction mixture was loaded onto a 5% native polyacrylamide gel after addition of 2.5 μl of heparin-supplemented loading buffer32 and gel electrophoresis was carried out in 0.5xTBE buffer at 120 V. Experiments were performed at least twice and gave very similar results.
For KMnO4 reactivity assays, 50 nM of either form of RNA polymerase (EσS and Eσ70) were incubated with about 3 nM of labeled promoter DNA for 20 min at 37 °C in K-glu100 buffer without DTT for complex formation. KMnO4 was added to a final concentration of 10 mM and the reaction was stopped after 30 seconds by adding 2 mM DTT. Samples were phenol-extracted and precipitated, treated with 1 mM piperidine, resuspended in pure formamide blue before being loaded onto a 7% polyacrylamide denaturing gel. A DNA ladder was generated for each labeled DNA fragment by partial G/A sequencing using formic acid and piperidine.
Other methods
Determination of HPII catalase activity and Western blot experiments were carried out as previously described51,52. Mutagenesis of the omrA promoter was carried out by generation of PCR products with mutagenic primers carried the desired substitutions, as previously described32.
Additional Information
How to cite this article: Peano, C. et al. Characterization of the Escherichia coli σS core regulon by Chromatin Immunoprecipitation-sequencing (ChIP-seq) analysis.. Sci. Rep. 5, 10469; doi: 10.1038/srep10469 (2015).
Supplementary Material
Acknowledgments
We thank Elise Arnoux for her technical help with northern blots. This work was supported by Swiss National Fund for Scientific Research (Project 3100A0-109433 to T.E. and P.L.). S.L. and J.G. wish to acknowledge the support to their work by the French National Agency of Research (ANR).
Footnotes
The authors declare no competing financial interests.
Author Contributions The experiments were conceived and designed by C. P., T. E., G. D. B., S. L., P. L. and performed by C. P., J. W., J. D., E. R. and S. L. Data analysis was carried out by E. R., L. P. and J. G. The paper was written by P. L. with contributions from C. P., T. E. and S. L. All authors reviewed the manuscript.
References
- Lloyd G., Landini P. & Busby S. Activation and repression of transcription initiation in bacteria. Essays Biochem 37, 17–31 (2001). [DOI] [PubMed] [Google Scholar]
- Gourse R. L., Ross W. & Rutherford S. T. General pathway for turning on promoters transcribed by RNA polymerases containing alternative sigma factors. J Bacteriol 188, 4589–4591 (2006). [DOI] [PMC free article] [PubMed] [Google Scholar]
- Battesti A., Majdalani N. & Gottesman S. The RpoS-mediated general stress response in Escherichia coli. Annu Rev Microbiol 65, 189–213. [DOI] [PMC free article] [PubMed] [Google Scholar]
- Hengge-Aronis R. in Bacterial Stress Responses 161–178 (ASM Press, Washington, DC; 2000). [Google Scholar]
- Landini P., Egli T., Wolf J. & Lacour S. sigmaS, a major player in the response to environmental stresses in Escherichia coli: role, regulation and mechanisms of promoter recognition. Environ Microbiol Rep 6, 1–13 (2014). [DOI] [PubMed] [Google Scholar]
- Typas A., Becker G. & Hengge R. The molecular basis of selective promoter activation by the sigmaS subunit of RNA polymerase. Mol Microbiol 63, 1296–1306 (2007). [DOI] [PubMed] [Google Scholar]
- Tanaka K., Takayanagi Y., Fujita N., Ishihama A. & Takahashi H. Heterogeneity of the principal sigma factor in Escherichia coli: the rpoS gene product, sigma 38, is a second principal sigma factor of RNA polymerase in stationary-phase Escherichia coli. Proc Natl Acad Sci U S A 90, 8303 (1993). [DOI] [PMC free article] [PubMed] [Google Scholar]
- Gaal T. et al. Promoter recognition and discrimination by EsigmaS RNA polymerase. Mol Microbiol 42, 939–954 (2001). [DOI] [PubMed] [Google Scholar]
- Becker G. & Hengge-Aronis R. What makes an Escherichia coli promoter sigma(S) dependent? Role of the -13/-14 nucleotide promoter positions and region 2.5 of sigma(S). Mol Microbiol 39, 1153–1165 (2001). [DOI] [PubMed] [Google Scholar]
- Maciag A. et al. In vitro transcription profiling of the sigmaS subunit of bacterial RNA polymerase: re-definition of the sigmaS regulon and identification of sigmaS-specific promoter sequence elements. Nucleic Acids Res 39, 5338–5355 (2011). [DOI] [PMC free article] [PubMed] [Google Scholar]
- Tanaka K., Handel K., Loewen P. C. & Takahashi H. Identification and analysis of the rpoS-dependent promoter of katE, encoding catalase HPII in Escherichia coli. Biochim Biophys Acta 1352, 161–166 (1997). [DOI] [PubMed] [Google Scholar]
- Ji H. et al. An integrated software system for analyzing ChIP-chip and ChIP-seq data. Nat Biotechnol 26, 1293–1300 (2008). [DOI] [PMC free article] [PubMed] [Google Scholar]
- Wade J. T. et al. Extensive functional overlap between sigma factors in Escherichia coli. Nat Struct Mol Biol 13, 806–814 (2006). [DOI] [PubMed] [Google Scholar]
- Lacour S. & Landini P. SigmaS-dependent gene expression at the onset of stationary phase in Escherichia coli: function of sigmaS-dependent genes and identification of their promoter sequences. J Bacteriol 186, 7186–7195 (2004). [DOI] [PMC free article] [PubMed] [Google Scholar]
- Patten C. L., Kirchhof M. G., Schertzberg M. R., Morton R. A. & Schellhorn H. E. Microarray analysis of RpoS-mediated gene expression in Escherichia coli K-12. Mol Genet Genomics 272, 580–591 (2004). [DOI] [PubMed] [Google Scholar]
- Weber H., Polen T., Heuveling J., Wendisch V. F. & Hengge R. Genome-wide analysis of the general stress response network in Escherichia coli: sigmaS-dependent genes, promoters, and sigma factor selectivity. J Bacteriol 187, 1591–1603 (2005). [DOI] [PMC free article] [PubMed] [Google Scholar]
- Dong T., Kirchhof M. G. & Schellhorn H. E. RpoS regulation of gene expression during exponential growth of Escherichia coli K12. Mol Genet Genomics 279, 267–277 (2008). [DOI] [PubMed] [Google Scholar]
- Dong T. & Schellhorn H. E. Control of RpoS in global gene expression of Escherichia coli in minimal media. Mol Genet Genomics 281, 19–33 (2009). [DOI] [PubMed] [Google Scholar]
- Dong T. & Schellhorn H. E. Global effect of RpoS on gene expression in pathogenic Escherichia coli O157:H7 strain EDL933. BMC Genomics 10, 349 (2009). [DOI] [PMC free article] [PubMed] [Google Scholar]
- Ibanez-Ruiz M., Robbe-Saule V., Hermant D., Labrude S. & Norel F. Identification of RpoS (sigma(S))-regulated genes in Salmonella enterica serovar typhimurium. J Bacteriol 182, 5749–5756 (2000). [DOI] [PMC free article] [PubMed] [Google Scholar]
- Braun V. & Rehn K. Chemical characterization, spatial distribution and function of a lipoprotein (murein-lipoprotein) of the E. coli cell wall. The specific effect of trypsin on the membrane structure. Eur J Biochem 10, 426–438 (1969). [DOI] [PubMed] [Google Scholar]
- Huerta A. M. & Collado-Vides J. Sigma70 promoters in Escherichia coli: specific transcription in dense regions of overlapping promoter-like signals. J Mol Biol 333, 261–278 (2003). [DOI] [PubMed] [Google Scholar]
- Fabrega A., Rosner J. L., Martin R. G., Sole M. & Vila J. SoxS-dependent coregulation of ompN and ydbK in a multidrug-resistant Escherichia coli strain. FEMS Microbiol Lett 332, 61–67 (2012). [DOI] [PubMed] [Google Scholar]
- Mendoza-Vargas A. et al. Genome-wide identification of transcription start sites, promoters and transcription factor binding sites in E. coli. PLoS One 4, e7526 (2009). [DOI] [PMC free article] [PubMed] [Google Scholar]
- De Lay N. & Gottesman S. A complex network of small non-coding RNAs regulate motility in Escherichia coli. Mol Microbiol 86, 524–538 (2012). [DOI] [PMC free article] [PubMed] [Google Scholar]
- Guillier M. & Gottesman S. The 5' end of two redundant sRNAs is involved in the regulation of multiple targets, including their own regulator. Nucleic Acids Res 36, 6781–6794 (2008). [DOI] [PMC free article] [PubMed] [Google Scholar]
- Vogel J. et al. RNomics in Escherichia coli detects new sRNA species and indicates parallel transcriptional output in bacteria. Nucleic Acids Res 31, 6435–6443 (2003). [DOI] [PMC free article] [PubMed] [Google Scholar]
- Fozo E. M. et al. Repression of small toxic protein synthesis by the Sib and OhsC small RNAs. Mol Microbiol 70, 1076–1093 (2008). [DOI] [PMC free article] [PubMed] [Google Scholar]
- Frohlich K. S., Papenfort K., Berger A. A. & Vogel J. A conserved RpoS-dependent small RNA controls the synthesis of major porin OmpD. Nucleic Acids Res 40, 3623–3640 (2012). [DOI] [PMC free article] [PubMed] [Google Scholar]
- Levi-Meyrueis C. et al. Expanding the RpoS/sigmaS-network by RNA sequencing and identification of sigmaS-controlled small RNAs in Salmonella. PLoS One 9, e96918 (2014). [DOI] [PMC free article] [PubMed] [Google Scholar]
- Repoila F., Majdalani N. & Gottesman S. Small non-coding RNAs, co-ordinators of adaptation processes in Escherichia coli: the RpoS paradigm. Mol Microbiol 48, 855–861 (2003). [DOI] [PubMed] [Google Scholar]
- Lacour S., Leroy O., Kolb A. & Landini P. Substitutions in region 2.4 of sigma70 allow recognition of the sigmaS-dependent aidB promoter. J Biol Chem 279, 55255–55261 (2004). [DOI] [PubMed] [Google Scholar]
- Cho B. K., Kim D., Knight E. M., Zengler K. & Palsson B. O. Genome-scale reconstruction of the sigma factor network in Escherichia coli: topology and functional states. BMC Biol 12, 4 (2014). [DOI] [PMC free article] [PubMed] [Google Scholar]
- McMeechan A. et al. Role of the alternative sigma factors sigmaE and sigmaS in survival of Salmonella enterica serovar Typhimurium during starvation, refrigeration and osmotic shock. Microbiology 153, 263–269 (2007). [DOI] [PubMed] [Google Scholar]
- Janaszak A., Nadratowska-Wesolowska B., Konopa G. & Taylor A. The P1 promoter of the Escherichia coli rpoH gene is utilized by sigma 70 -RNAP or sigma s -RNAP depending on growth phase. FEMS Microbiol Lett 291, 65–72 (2009). [DOI] [PubMed] [Google Scholar]
- Kocharunchitt C., King T., Gobius K., Bowman J.P. & Ross T. Global genome response of Escherichia coli O157ratioH7 Sakai during dynamic changes in growth kinetics induced by an abrupt downshift in water activity. PLoS One 9, e90422 (2014). [DOI] [PMC free article] [PubMed] [Google Scholar]
- Weber M. M., French C. L., Barnes M. B., Siegele D. A. & McLean R. J. A previously uncharacterized gene, yjfO (bsmA), influences Escherichia coli biofilm formation and stress response. Microbiology 156, 139–147 (2010). [DOI] [PMC free article] [PubMed] [Google Scholar]
- Wanner U. & Egli T. Dynamics of microbial growth and cell composition in batch culture. FEMS Microbiol Rev 6, 19–43 (1990). [DOI] [PubMed] [Google Scholar]
- Lacour S., Kolb A. & Landini P. Nucleotides from -16 to -12 determine specific promoter recognition by bacterial sigmaS-RNA polymerase. J Biol Chem 278, 37160–37168 (2003). [DOI] [PubMed] [Google Scholar]
- Mika F. & Hengge R. Small RNAs in the control of RpoS, CsgD, and biofilm architecture of Escherichia coli. RNA Biol 11, 494–507 (2014). [DOI] [PMC free article] [PubMed] [Google Scholar]
- Datsenko K. A. & Wanner B. L. One-step inactivation of chromosomal genes in Escherichia coli K-12 using PCR products. Proc Natl Acad Sci USA 97, 6640–6645 (2000). [DOI] [PMC free article] [PubMed] [Google Scholar]
- Yu D. et al. An efficient recombination system for chromosome engineering in Escherichia coli. Proc Natl Acad Sci USA 97, 5978–5983 (2000). [DOI] [PMC free article] [PubMed] [Google Scholar]
- Herring C. D. et al. Immobilization of Escherichia coli RNA polymerase and location of binding sites by use of chromatin immunoprecipitation and microarrays. J Bacteriol 187, 6166–6174 (2005). [DOI] [PMC free article] [PubMed] [Google Scholar]
- Mooney R. A. et al. Regulator trafficking on bacterial transcription units in vivo. Mol Cell 33, 97–108 (2009). [DOI] [PMC free article] [PubMed] [Google Scholar]
- Langmead B., Trapnell C., Pop M. & Salzberg S. L. Ultrafast and memory-efficient alignment of short DNA sequences to the human genome. Genome Biol 10, R25 (2009). [DOI] [PMC free article] [PubMed] [Google Scholar]
- Li H. et al. The Sequence Alignment/Map format and SAMtools. Bioinformatics 25, 2078–2079 (2009). [DOI] [PMC free article] [PubMed] [Google Scholar]
- Quinlan A. R. & Hall I. M. BEDTools: a flexible suite of utilities for comparing genomic features. Bioinformatics 26, 841–842 (2010). [DOI] [PMC free article] [PubMed] [Google Scholar]
- Kharchenko P. V., Tolstorukov M. Y. & Park P. J. Design and analysis of ChIP-seq experiments for DNA-binding proteins. Nat Biotechnol 26, 1351–1359 (2008). [DOI] [PMC free article] [PubMed] [Google Scholar]
- Gualdi L., Tagliabue L. & Landini P. Biofilm formation-gene expression relay system in Escherichia coli: modulation of sigmaS-dependent gene expression by the CsgD regulatory protein via sigmaS protein stabilization. J Bacteriol 189, 8034–8043 (2007). [DOI] [PMC free article] [PubMed] [Google Scholar]
- Dudin O., Lacour S. & Geiselmann J. Expression dynamics of RpoS/Crl-dependent genes in Escherichia coli. Res Microbiol 164, 838–847 (2013). [DOI] [PubMed] [Google Scholar]
- Visick J. E. & Clarke S. RpoS- and OxyR-independent induction of HPI catalase at stationary phase in Escherichia coli and identification of rpoS mutations in common laboratory strains. J Bacteriol 179, 4158–4163 (1997). [DOI] [PMC free article] [PubMed] [Google Scholar]
- Ihssen J. & Egli T. Specific growth rate and not cell density controls the general stress response in Escherichia coli. Microbiology 150, 1637–1648 (2004). [DOI] [PubMed] [Google Scholar]
- Hengge-Aronis R. Survival of hunger and stress: the role of rpoS in early stationary phase gene regulation in E. coli. Cell 72, 165–168 (1993). [DOI] [PubMed] [Google Scholar]
- Wise A., Brems R., Ramakrishnan V. & Villarejo M. Sequences in the -35 region of Escherichia coli rpoS-dependent genes promote transcription by E sigma S. J Bacteriol 178, 2785–2793 (1996). [DOI] [PMC free article] [PubMed] [Google Scholar]
- Schellhorn H. E., Audia J. P., Wei L. I. & Chang L. Identification of conserved, RpoS-dependent stationary-phase genes of Escherichia coli. J Bacteriol 180, 6283–6291 (1998). [DOI] [PMC free article] [PubMed] [Google Scholar]
- Marschall C. et al. Molecular analysis of the regulation of csiD, a carbon starvation-inducible gene in Escherichia coli that is exclusively dependent on sigma s and requires activation by cAMP-CRP. J Mol Biol 276, 339–353 (1998). [DOI] [PubMed] [Google Scholar]
- Yakhnin H. et al. Complex regulation of the global regulatory gene csrA: CsrA-mediated translational repression, transcription from five promoters by Esigma(7)(0) and Esigma(S), and indirect transcriptional activation by CsrA. Mol Microbiol 81, 689–704 (2011). [DOI] [PMC free article] [PubMed] [Google Scholar]
- Farewell A., Kvint K. & Nystrom T. Negative regulation by RpoS: a case of sigma factor competition. Mol Microbiol 29, 1039–1051 (1998). [DOI] [PubMed] [Google Scholar]
- Dartigalongue C., Missiakas D. & Raina S. Characterization of the Escherichia coli sigma E regulon. J Biol Chem 276, 20866–20875 (2001). [DOI] [PubMed] [Google Scholar]
- Rhodius V. A., Suh W. C., Nonaka G., West J. & Gross C. A. Conserved and variable functions of the sigmaE stress response in related genomes. PLoS Biol 4, e2 (2006). [DOI] [PMC free article] [PubMed] [Google Scholar]
Associated Data
This section collects any data citations, data availability statements, or supplementary materials included in this article.