Abstract
Despite MHC incompatibility, Lewis to DA rat liver transplants survive indefinitely without immunosuppression, and the studies we report sought the mechanism(s) responsible for this. At one year most of the liver reacted positively to host anti-DA antibody. When small (50%) grafts were transplanted, recruitment was more rapid as most of the organ assumed the host phenotype at 3 months. After transplantation the Y-chromosome was detected in the hepatocytes of XX to XY grafts by both in-situ hybridization and PCR. Further, livers from transgenic Lewis rats carrying strong GFP markers lost the marker with time after transplantation to DA, GFP− hosts. Few liver cells contained the Y chromosome in syngeneic XX to XY liver grafts or when the hosts of Lewis XX to DA XY allografts were treated with cyclosporine A (CsA) 10mgs/kg/day. This dosage also impeded enlargement of the liver at ten days. Using GFP+ XX Lewis donors transplanted to GFP− XY DA hosts, we found little Y DNA in GFP+ cells at 10 days. Host derived OV-6 and c-kit positive, albumen positive cells were present at 3-10 days, but cells with the CD34 marker were less common and some clearly still had the donor phenotype at ten days. CXCR-4 positive cells increased with time and were abundant at 1 month after transplantation. We conclude: 1. extra-hepatic cells can differentiate into liver tissues; 2. regenerative stimuli accelerate stem cell recruitment; 3. both regeneration and recruitment are impeded by CsA immunosuppression, and 4. donor GFP positive cells contained little host Y-chromosome after transplantation suggesting that cell fusion was uncommon and, therefore, unlikely to be the mechanism leading to the changes in genotype and phenotype we observed.
Keywords: Liver transplantation, Rat, Hepatocytes, Stem cells, Cyclosporine A
Many investigators have shown that various components of a liver transplant achieve characteristics of the host (1-7). Additionally, in the non transplanted, but chemically or genetically damaged liver, cells from transplanted bone marrow may carry donor sex chromosomes and proteins to a fraction of the cells resembling hepatocytes (8-14). We reasoned that the Lewis to DA rat liver transplant model would be a good one to study the ability of cells outside the liver to participate in the repair of the initial ischemia-reperfusion injury and later the injury produced by low grade rejection. In this model the liver transplant undergoes portal cellular inflammatory changes, but survives without any immunosuppression (15). Further, reduced sized livers can be transplanted successfully allowing evaluation of the impact of a strong regenerative stimulus on the flux of host cells entering the liver.
Materials and Methods
Rat strains and care
Lewis (RT11), DA (RT1Aa) rats were purchased from Harlan Sprague-Dawley (Indianapolis, IN) and used at 8-12 wk of age. The GFP transgenic Lewis rat strain was obtained from the NIH-funded Rat Resource and Research Center (RRRC), University of Missouri, Columbia, MO. Animals were maintained in the specific pathogen-free facility of Johns Hopkins Medical Institutions. Animals were cared for according to NIH guidelines and under a protocol approved by the Johns Hopkins University Animal Care Committee. In some transplanted rats, CsA (10mg/kg) was injected intramuscularly daily for ten days. The number of animals utilized for each of the transplants and the time-points of animals sacrificed were summarized in supplemental on-line materials (Table 1).
Liver transplantation
Orthotopic liver transplantation (OLT) was performed under isoflurane (Abbott Laboratories, North Chicago, IL) inhalation anesthesia according to a method modified from that described by Kamada and Calne (16). Small liver transplantation consisted of removal of the left lateral lobe, the left portion of the median lobe, and the anterior and posterior caudate lobes. This reduced the liver mass by about 50%. The livers were flushed in situ with 10ml cold saline via the portal vein, explanted, and immersed in cold saline solution. The host liver was excised by ligation and division of the right adrenal and lumbar veins. The hepatic artery was ligated and divided. The bile duct was cannulated by insertion of a 2mm-long tube (outer diameter 1.2mm) via choledocotomy and secured with a circumferential 8-0 silk suture. The IVC and the portal vein were cross-clamped with micro-vessel clips. The suprahepatic vena cava was pulled down using a cotton tape passed round the host liver and cross-clamped with a baby Statinsky clamp. The vessels were divided and liver was removed. The donor suprahepatic vena cava was anastomosed end-to-end with the host suprahepatic vena cava with running 8-0 prolene. The portal vein and infra hepatic vena cava were anastomosed using the cuff technique described before (16). The common bile duct of the donor was cannulated with the small tube residing in the host bile duct and tied in place. The hepatic artery was not reconstructed.
Preparation of Hepatocytes, Kupffer Cells, Sinusoidal Endothelial Cells and Stellate Cells
Hepatocytes were isolated by standard two-step type IV collagenase perfusion (17) and enriched to >95% purity by differential centrifugation (18). Percoll gradient centrifugation separated the other cellular components of the liver (19). Purity was consistently >90% as determined by morphology (phagocytosed beads) and >90% as determined by flow cytometry.
Immunohistochemistry and Immunocytochemistry
For immunohistochemistry, 5-μm serially cut, frozen sections were fixed with acetone at (−20°C) for 10 minutes and dried for 1 hour at room temperature. For immunocytochemistry, disassociated hepatocytes were plated on LabTek II CC2 chamber slides (NAlgene) at a density of 104 cells cm−2 in RPMI 1640 medium (Gibco) containing 10% FCS, 100U/ml penicillin and 100mg/ml streptomycin, at 37°C in a 5% CO2-humidified air atmosphere. Two to three hours after plating, the slides were washed with PBS and fixed with acetone at -20°C for 10 minutes. The streptavidin-biotin-peroxidase method with the DAKO Kit (CA, USA) was used to detect RT1Aa antigen. After inactivation of endogenous peroxidase and the blocking of nonspecific binding of antibody, the specimens were reacted with the biotinylated antibody specific for DA-MHC-I (RT1Aa) (1:50, C3, BD Pharmingen) or mouse anti-RT1Aa (1:50, GenWay Biotech) at room temperature for 1.5 hours. Subsequently, the sections were incubated with streptavidin-biotin-peroxidase complex reagent for 45 minutes at room temperature. Diaminobenzidine tetrahydrochloride was used as the chromogen, and hematoxylin was used for counterstaining.
Histological assessment of the degree of repopulation
Assessment of the degree of repopulation was made under direct microscopic observation of at least six fields of tissue sections from the liver allografts, stained for RT1Aa. The percentage of RT1Aa positive and negative cells was determined by counting cells at 40× magnification. Sections were processed from three or more transplanted animals at each time point. Data are reported as mean ± SEM at each time point. The significance was determined by the Student t test. P values <.05 were considered significant.
Flow cytometry
Single-cell suspensions (1×10⁶) of hepatocytes were analyzed for RT1Aa expression. Non-specific antibody binding was blocked with goat and rat serum (Sigma) for 30 minutes. The cells were incubated with fluorescein isothiocyanate (FITC)-conjugated rat anti-RT1Aa antibody (1:100) for 45 minutes at 4°C, and the RT1Aa positive cells were counted by flow cytometry (FACS) using CELLQuest software (Becton-Dickinson). For separation of GFP positive and negative hepatocytes, single-cell suspensions (1×10⁶/ml) of hepatocytes isolated from GFP-liver allografts were selected by FACS.
In situ imaging of GFP expression in livers
Liver grafts were flushed with cold saline (4°C, 10ml) and fixed with 4% paraformaldehyde via portal vein perfusion. The fluorescence of GFP in liver grafts was measured by Xenogen IVIS Imaging system and Living Image software (Xenogen Biosciences).
Fluorescence in situ hybridization (FISH)
In situ hybridization for Y-chromosome was performed by using rat 12 and Y chromosome probes labeled with FITC/Cy3 (Cambio, Cambridge, England) according to the company protocol with the following modifications: 1. acetone fixed frozen liver tissue sections (5μm) were dried at room temperature and dehydrated in 100% ethanol for 5 minutes. 2. the slides were then incubated in pepsin (0.01%) solution for 5 minutes and washed in 2XSSC for 1 minute. 3. the probes (10-15μl) were applied to the slide and sealed with rubber cement. The slides were placed in an air tight, pre-warmed humidified chamber and incubated overnight in the dark at 37°C. Cell nuclei were stained blue with DAPI. Tissue sections were analyzed by confocal fluorescence microscopy.
PCR for Y-chromosome
Total DNA was extracted from isolated cells by using QIAamp DNA Mini Kit (Qiagen, Valencia, USA) according to the manufacturer's protocol. The primer sets for amplification of rat Y-chromosome were 5′-ATTTATGGTGTGGTCCCGTGGAGA-3′ and 5′-TTCTGGTTCTTGGAGGACTGGTGT-3′. The primer sets for amplification of GFP were 5′-ACGTAAACGGCCACAAGTTC-3′ and 5′-AAGTCGTGCTGCTTCATGTG-3′. The primer sets for control amplification of GAPDH were 5′-acagtcaaggctgagaatgg-3′ and 5′-GTTGTCATGGATGACCTTGG-3′. Polymerase chain reaction (PCR) contained 1μl of deoxynucleoside triphosphate mix (10 mM each dNTP), 1μl of 10μM each primer, 0.4μl (5IU/μl) of Platinum Taq polymerase (Invitrogen, Carlsbad, CA), 1.5μl of 50 mM MgCl2 and 2μl total DNA as template in a 50μl reaction solution. The thermal cycling condition was started with one cycle at 94 °C for 2 minutes. This was followed by 30 cycles at 94 °C for 30 seconds, 62 °C for 30 seconds, 72 °C for 50 seconds, and 72 °C for final extension for 3 minutes. PCR products were electrophoresed on 1.5% agarose gels and visualized with ethidium bromide staining.
Immunofluorescence staining
Frozen sections (5-μm) were fixed with acetone (−20°C) for 10 minutes and dried for 1 hour at room temperature. A Tris-based buffer containing 0.5% casein, 5% normal rat and rabbit serum was used for blocking non-specific background and dilution of antibodies. Sections were incubated for 1.5 hour at room temperature with a mixture of a FITC labeled rat polyclonal antibody to RT1Aa (1:50) and rabbit antibody to rat albumin (1:100, MP Biomedicals, LLC) or rabbit polyclonal antibody to c-kit (1:200, Santa Cruz), or goat anti-CD34 (1:100, Santa Cruze), or mouse anti-OV-6 (1:50, R&D System) followed by Texas red donkey anti-rabbit IgG ( 1:200, Santa Cruz), or Cy3 donkey anti-goat IgG (1:100, Jackson Immune Research, Inc.) or rhodamine donkey anti-mouse IgG (1:100, abcam) for 1 h at room temperature. Cell nuclei were stained blue with DAPI. Tissue sections were analyzed by confocal fluorescence microscopy.
Results
Biological characterizing of the Lewis to DA liver transplantation model
Ninety percent of the rats survived the transplant operation and were eating normally by the third day. A heavy portal mononuclear cell infiltration developed at 7-10 days (20), but subsided without treatment. Liver enzyme elevations slowly returned toward normal (Supplemental on-line materials: figure 1). The small (50%) liver transplants regained normal liver volume 10 days after transplantation (Supplemental on-line materials: figure 2), and like the normal sized liver transplants supported life in greater than 90% of recipients. Histological sections showed portal mononuclear cell infiltration and extensive inclusions of fat in the cytoplasm of the hepatocytes during the first 10 days (Supplemental on-line materials: figure 3).
Host cells are present in the regenerating liver allograft
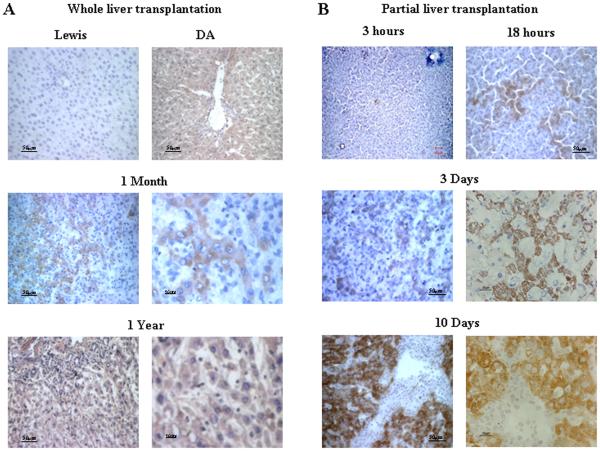
Three methods were used to differentiate donor and host cells: antibody against RT1Aa, sex chromosome analysis, and green fluorescent protein (GFP). Four DA rats surviving one year after transplantation of a whole liver graft from a Lewis donor were studied using an antibody detecting the RT1Aa allotype of host cells. The entire liver from all four grafts reacted positively (Figure 1A). Host cells were quite evident as early as one month (Figure 1A). Small liver grafts stimulated the ingress of host cells at a faster rate. We found from studies done on four or more rats at time points of 3 and 18 hours, and at days 3, and 10 after transplantation that a few cells carrying the host allotype were present as early as 3 hours. The numbers while variable did increase at 18 hours and by 10 days patches of RT1Aa+ cells were present comprising about half of the liver parenchyma (Figure 1B ). Most of the hepatocytes assumed the host phenotype at 3 months (Supplemental on-line materials: figure 4).
Figure 1. Repopulation of liver allografts by recipient MHC-I expressing cells.
A: Immunohistochemistry staining for RT1Aa (recipient MHC-I) in tissue sections from whole liver allografts. RT1Aa+ cells are brown. Upper panels, liver sections from Lewis rats showing RT1Aa− and DA rats showing RT1Aa+. Liver sections from allografts at 1 month (Middle panels) and 1 year (Lower panels) after transplantation demonstrating the progression to total repopulation. Representative photographs of n=3 or 4 individual transplant samples per group. B: Immunohistochemistry staining for RT1Aa in tissue sections from small (50%) liver allografts recovered at 3 hr, 18 hr, 3, and 10 days after transplantation. Representative photographs of n=3 or 4 individual samples per group. The photomicrographs of the transplants at each time point display areas populated with RT1Aa positive cells. This process was patchy and many areas remained negative. For example, RT1Aa positive cells appeared throughout the liver in tissue sections in one rat while scarce in another at 3 days after small liver transplantation
Analysis of host cell phenotype in hepatocytes suspensions
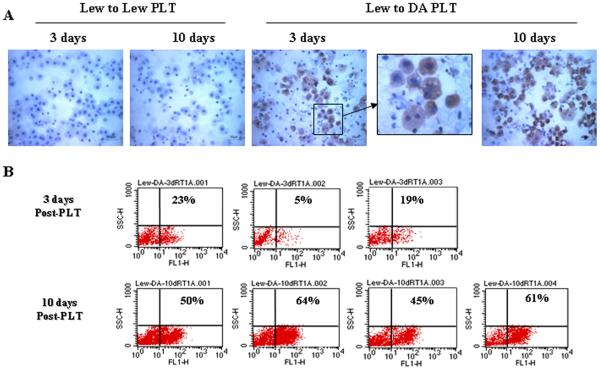
Because the distribution of RT1Aa cells was patchy, it was hard to determine the quantity of host cells by counting cells in histological sections. For this reason we chose to make hepatocyte suspensions from the small liver grafts, and evaluate the numbers of RT1Aa cells by flow cytometry and by cytochemistry. In three Lewis to Lewis grafts all cells remained RT1Aa negative (Figure 2A). By immunocytochemistry RT1Aa-positive hepatocytes were readily detected in the three small liver allografts 3 days after transplantation, and the proportion significantly increased in the four rats studied at 10 days after transplantation. Some disassociated RT1Aa positive cells demonstrated double nuclei. By flow cytometry, 5% to 23% of the hepatocytes from Lewis donors were RT1Aa positive in the three transplanted animals studied at 3 days post transplant. RT1Aa reactivity increased to between 45% and 64% in the four animals studied at day 10 after transplantation (Figure 2B) at which time the liver had re-gained normal volume.
Figure 2. Detection of host phenotype hepatocytes in allograft after partial liver transplantation.
A: Analysis of isolated hepatocytes by immunocytochemistry. Hepatocytes isolated from syngeneic liver grafts (Lewis into Lewis) on day 3 or day 10 after transplantation showing no staining with RT1Aa (left two panels). Hepatocytes isolated from liver allografts from Lewis donors into DA recipients on day 3 or day 10 after transplantation showing increased numbers of brown staining cells (RT1Aa+, right three panels). The photomicrographs were photographed with ×40 objective. Representative photographs of n=3 or 4 individual transplants per group. B: Quantitative analysis of isolated hepatocytes by flow-cytometry. RT1Aa+ hepatocytes quantified by flow cytometric analysis on day 3 (upper panels, n=3) or day 10 (lower panels, n=4) after transplantation.
Sex mismatched liver transplants
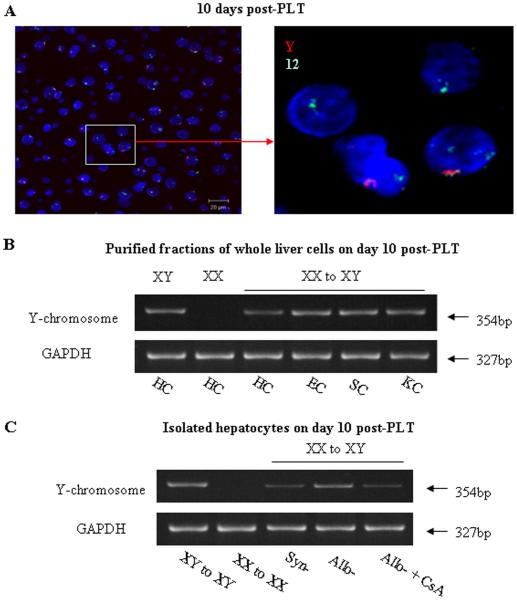
To exclude the possibility that absorption of soluble MHC class-I molecules explained our findings, we used a Y-chromosome probe and in situ hybridization to determine whether the host genome was present in the hepatocytes of the regenerating liver grafts in sex-mismatched Lewis (female) into DA (male) small (50%) liver transplants. The 12-chromosome probe (green) was used as an internal control. The three Lewis livers (XX) transplanted into DA hosts (XY) demonstrated the presence of the Y chromosome (red) in hepatocytes at day 10 after transplantation (Figure 3A). The number of Y-chromosome positive hepatocytes significantly increased, and by one month most of the hepatocytes were Y-chromosome positive (Supplemental on-line materials: figure 5).
Figure 3. Detection of host Y chromosome after small liver transplantation.
A: FISH for Y-chromosome in liver tissue sections. A Y-chromosome probe (Red) was used to distinguish host cells by in situ hybridization in a sex mismatched Lewis (Y-negative) into DA (Y-positive) after partial (50%) liver transplantation. The 12-chromosome probe (green) was used as an internal control. FISH demonstrated the presence of the Y-chromosome (red) in hepatocytes on day 10 after transplantation. The photomicrographs were photographed with ×40 objective. Representative photographs of n=3 individual transplant samples per group. B: The presence of the Y-chromosome in preparations of disassociated liver cells was analyzed by PCR 10 days after a 50% liver transplant. PCR analysis showed that isolated hepatocytes (HC), hepatic sinusoid endothelial cells (EC), stellate cells (SC) and Kupffer cells (KC) were positive for the Y-chromosome. Representative graphs of 3 individual samples. C: The presence of Y-chromosome in hepatocytes. Representative graphs of 3 individual samples. Hepatocytes recovered from sex-mismatched allografts (XX to XY) express Y-chromosome at the levels comparable to hepatocytes recovered from male allografts (XY to XY). However, the levels of Y-chromosome expression in hepatocytes recovered from syngeneic grafts or CsA treated allografts were significant lower compared to hepatocytes recovered from allografts.
To determine which host cell types were present in the liver tissues, we separated the cellular components and used PCR to detect the presence of the Y-chromosome after three XX Lewis to XY DA transplants. Liver tissues were disassociated as described; the various cellular components were purified (see methods) and subjected to PCR. Ten days after a 50% liver transplant, the isolated hepatocytes (HC), hepatic sinusoid endothelial cells (EC), stellate cells (SC) and Kupffer cells (KC) were all positive for the Y-chromosome (Figure 3B). Hepatocytes recovered from sex-mismatched allografts (XX to XY) had the Y-chromosome at what appeared to be lesser concentrations in this semi-quantitative PCR compared to other liver cell types but comparable to hepatocytes recovered from 3 male allografts (XY to XY). However, hepatocytes recovered from three syngeneic grafts or three CsA treated XX to XY allografts contained significantly less Y chromosome (Figure 3C).
Green fluorescent protein and the importance of allograft rejection in stem cell recruitment
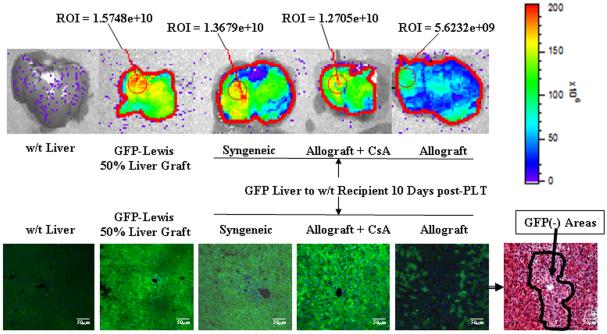
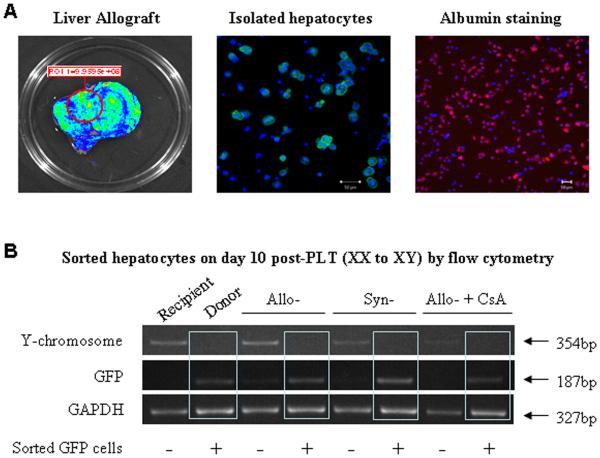
Two groups of six rats were studied: 1. syngeneic, Lewis female GFP+ donors to Lewis male GFP− recipients; 2. allogeneic, Lewis female GFP+ donors to DA male GFP− recipients. At day 10 after transplantation three rats from each group were studied. GFP whole organ fluorescence was measured using the Xenogen system. As shown in figure 4, which is representative of our experience, the wild type Lewis liver has no GFP expression while the small (50%) normal liver from the GFP+ rat has a high degree of fluorescence. The small syngeneic liver transplant had gotten larger and was also strongly fluorescent indicating that regeneration was accomplished by the liver itself. By contrast the allogeneic livers while as large as the syngeneic had lost most of their fluorescence. Fluorescent microscopy in the other three rats per group confirmed these findings. There was significant loss of green parenchyma in the area around the central vein (Figure 4 the right lower panel and Supplemental on-line materials: figure 6) which is the area where most of the RT1Aa abide. PCR reactions detecting the Y chromosome confirmed the finding that few host cells were present in the syngeneic grafts. However, many host cells were present in the allografts as there was a significant amount of the Y chromosome in the sex mismatched allografts (Figure 3).
Figure 4. Detection of donor GFP expression at 10 days after small liver transplantation.
The Xenogen imaging system was used to study sygeneic (GFP Lewis livers transplanted into wild type Lewis hosts), allogeneic (GFP Lewis livers transplanted into DA hosts), and allogeneic-CsA (10 mg/kg/day) GFP Lewis livers into DA hosts after partial (50%) liver transplantation. Upper panel, Xenogen imaging of GFP expression in livers. Lower panel, liver tissue sections were analyzed by fluorescence microscopy. There is diffuse green reactivity of liver tissue in GFP + normal livers, GFP+ syngeneic transplants, and GFP grafts transplanted with CsA. The small GFP+ liver allografts lost GFP markers in the central vein area. The H&E stain shows that these cells had a different appearance than the residual native GFP+ cells (also see Supplemental on-line materials: figure 6). The photomicrographs were photographed with ×20 objective. Representative data of 3 individual samples per group.
The influence of cyclosporine-A immunosuppression
Three additional GFP+ Lewis small livers were transplanted into DA hosts which received 10 mg cyclosporine/kg/day for ten days at which time they were also studied. The liver was still small and green indicating that both regeneration and repopulation were impaired (Figure 4). Very few GFP− cells were seen on fluorescent microscopy (Figure 4 lower panel), and there were clearly fewer host cells by PCR (Figure 3C). The same treatment with CsA inhibited regeneration of native livers after 50% hepatectomy (data not shown).
Host derived hepatocytes, (XY, GFP−) fail to demonstrate donor (XX, GFP+) characteristics
To determine if the host-derived hepatocytes in the transplants also retained donor characteristics, GFP+ XX small Lewis livers were transplanted into wild type XY Lewis hosts (syngeneic), XY DA hosts (allogenic), or XY DA hosts treated with CsA. Hepatocytes were isolated and more than 90% of isolated hepatocytes were positive for albumin (red) (Figure 5A). The GFP+ (donor) and GFP− (host) hepatocytes were separated by FACS. The presence of the Y-chromosome (host) was analyzed by PCR. If GFP+ cells contained the Y-chromosome, cell fusion was likely to have occurred. However, figure 5B shows that GFP+ hepatocytes recovered from syngeneic grafts, allografts, or CsA treated allografts contained very little host Y-chromosome, compared to the GFP negative cells.
Figure 5. Detection of donor GFP and recipient Y chromosome in hepatocytes at 10 days after small liver transplantation.
A: Some hepatocytes were isolated from GFP+ liver allograft show GFP−. Isolated hepatocytes were stained with Cy3 labeled anti-albumin antibody (red). More than 90% of isolated hepatocytes were positive for albumin staining (red). Cell nuclei stained with DAPI (blue). Image was photographed with ×20 objective. B: GFP+ and GFP− hepatocytes were separated by FACS at 10 days after transplantation. The presence of the Y chromosome in GFP+ and GFP− hepatocytes was detected by PCR. GFP+ (donor) hepatocytes recovered from syngeneic grafts, allografts or CsA treated allografts were host Y-chromosome negative. The GFP negative hepatocytes displayed marked Y chromosome reactivity. Representative graphs of 3 individual samples.
Host phenotype cells contained albumen
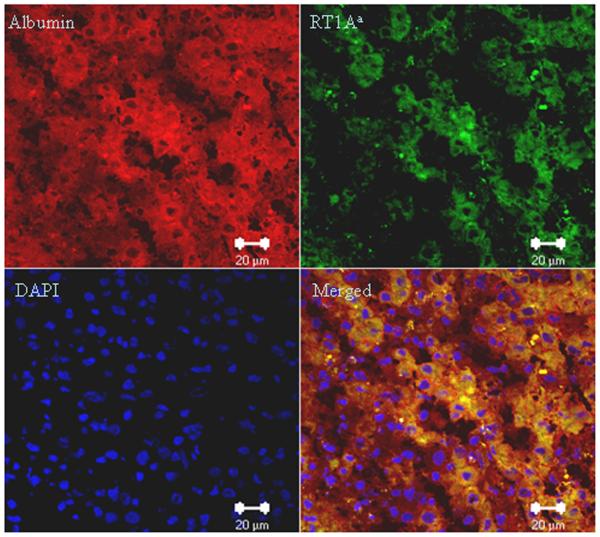
We reacted the tissue sections from small allografts 10 days after transplantation with anti-albumin (second antibody labeled with Cy3, red) and anti-RT1Aa (labeled with FITC, green) antibodies. Clearly the host-derived RT1Aa positive cells contained albumin (Figure 6 and Supplemental on-line materials: figure 7).
Figure 6. Double fluorescence staining for albumin and RT1Aa at 10 days after small (50%) liver transplantation.
Sections stained with both anti-RT1Aa and anti-albumin antibodies showing that host-derived RT1Aa positive cells (Green) contain albumin (Red). Representative photographs of 3 individual samples. Images were photographed with a ×40 objective. (For antibody control staining see Supplemental on-line materials: figure 7)
Accumulation of host-derived progenitor cells in liver allografts at early time points after transplantation
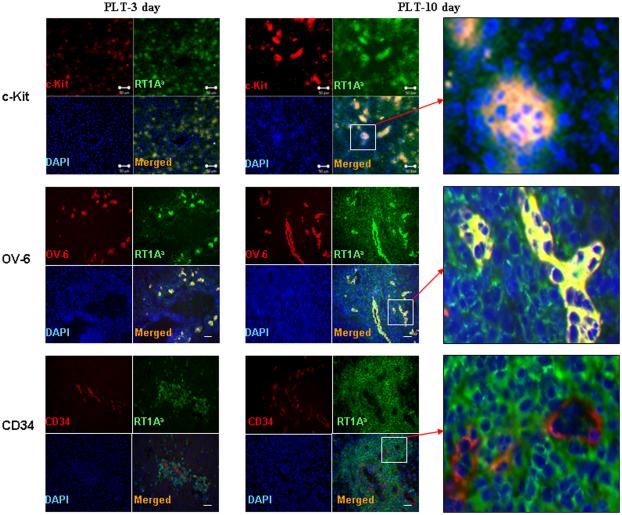
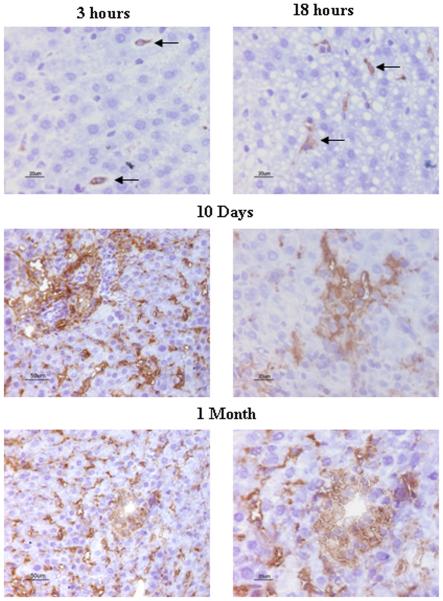
The possible source of the progenitor cells was sought using c-kit, OV-6, CD34 and CXCR-4 markers in three liver allografts at days 3, 10, and 30. There were few c-kit OV-6, CD34 or CXCR-4 positive cells in normal livers (Supplemental on-line materials: figure 8). The c-kit+, OV-6+ cells were clearly evident on day 3 and 10 after partial liver transplantation (Figure 7). These cells were also RT1Aa (host) positive. By one month the c-kit labeled cells were scarce. These results suggest that either the extra-hepatic c-kit+ cells lost their “primitive” marker after differentiation or left the liver. OV-6+ cells were located in the same areas as the cells having the c-kit label while CD34 positive cells were distinct from those with the other labels and most appeared to constitute blood vessels. CD34 positive cells were more evident at day ten than at day three, and some lacked the RT1Aa phenotype while it was clearly present in others (also see Supplemental on-line materials: figure 9). Cells containing the CXCR-4 label were morphologically similar to hepatocytes and perhaps sinusoidal and/or Kuppfer cells (Figure 8). Interestingly, CXCR-4 positive cells remained at high levels at 1 month after partial liver transplantation.
Figure 7. Accumulation of host-derived progenitor cells in liver allografts at early time after transplantation.
The RT1Aa and c-Kit, OV-6 or CD34 double positive cells were identified by immuno-fluorescence staining. Upper panels: The c-kit (red) and RT1Aa (green) double (orange) positive cells were present on day 3 and significantly increased on 10 after partial liver transplantation. Note that the c-kit+ and RT1Aa+ cells are in four to ten cell clusters at 10 days. There were some RT1Aa positive cells (green) without c-kit staining while all c-kit positive cells (red) stained for RT1Aa. Middle panels: The OV-6 (red) and RT1Aa (green) double positive cells (orange) were significantly increased on day 3 and 10 after partial liver transplantation. Lower panels: CD34 positive cells (red) were present in the area immediately around RT1Aa positive cells (green). Some CD34 positive cells stained with RT1Aa (10 days) (orange). Other CD34 positive cells do not stain with RT1Aa (3 days). (For greater detail see supplemental figure 9). Representative photographs of three individual samples. Images were photographed with ×20 objective.
Figure 8. CXCR-4 expression in small liver allografts after transplantation.
CXCR-4 positive cells were identified by immunohistochemistry staining. CXCR-4 positive cells appeared in liver allografts as early as 3 hours after transplantation, and increased in a time-dependent fashion. CXCR-4 labeled hepatocytes at 10 day and 1 month after transplantation. Representative photographs of three individual samples.
Discussion
The studies we report extend the observations of others that under certain conditions bone marrow cells are recruited into the liver and become not only Kupffer cells, endothelial cells, oval cells, stromal cells, and cholangiocytes but functioning hepatocytes. Our studies differ from those previously reported in the quantity of extra-hepatic recruitment which occurred in the allogeneic transplant setting. In our model the liver transplant like the autologous liver damaged by toxins, alkalating agents, and partial hepatectomy recovers rapidly in a process aided by progenitor cells. In the case of autologous liver injury, alkalating agents have to be administered to prevent the liver from regenerating by cells from the liver itself. The timing of the syngeneic Y bone marrow graft containing the progenitor cells and the alkalting agent appears to be critical, and in contrast to our studies a maximum of 20% of the hepatocytes were derived from the donor bone marrow (7-13). In the case of human transplantation, most studies took advantage of sex mismatches and used FISH techniques to detect the donor Y chromosome. These studies found host cells comprising less than 2% of the cells with hepatocytes markers (2-6). The large difference in the proportion of cells derived from the donor is best explained by biological factors which are the subject of this report.
The primary stimulus for progenitor cell recruitment is hepatocyte failure under conditions where intra-hepatic resources are also impaired. We found many fewer host cells in sex mismatched syngeneic liver transplants and in the livers whose hosts were treated with cyclosporine. However, the untreated weakly rejecting transplant provided the optimal conditions for progressive extra-hepatic progenitor cell recruitment. These conditions may have also been present in livers damaged by a genetic abnormality such as fumarylacetoacetate (Fah) deficiency. Two studies in such mice have shown that marrow from normal syngeneic donors was able to correct the enzyme deficiency by establishing nodules of Fah+ cells identical to hepatocyes morphologically (12, 13). Considerable evidence supports cellular fusion between the marrow cells and hepatocytes as the mechanism correcting the enzyme deficiency. Using the same model committed macrophages were also able to enter the liver and form cells bearing the Fah+ phenotype superimposed on the Fah− genome. Very few cells were needed to correct the otherwise lethal defect, and no Fah+ cells were present in other organs suggesting that re-programming hepatocytes to correct enzymes deficiencies may be less arduous than expected. However, no studies have been reported to date showing that allogeneic cells are capable of furnishing and sustaining the transcriptional equipment to correct lethal enzyme deficiencies.
We sought evidence for cell fusion in our transplants by labeling the donor liver with GFP and transplanting female livers into male hosts. The GFP positive cells were sorted by FACS and subjected to PCR searching for labeling of the Y chromosome. Although our PCR runs were only semi-quantitative, there was clearly very little Y activity in any of the purified cell populations recovered from the liver 10 days after small liver transplantation. It may be that cells which trans-differentiated into hepatocytes escaped allograft rejection while any fused cells were rejected because they carried donor antigen. It is also interesting, that while donor cells were not randomly but focally distributed throughout the liver in our studies, no large nodules were present which was a characteristic of the Fah studies.
An increased demand for regeneration, while not essential for stem cell recruitment, was found to accelerate the process. Total host replacement occurred in just three months for the small livers compared to 12 in the normal sized livers. The importance of the regenerative stimulus was also found in autochthenous models.
While the application of calcineurin inhibitors as immunosuppressive agents established clinical transplantation as therapy, we found it affected both stem cell recruitment and regeneration. Small grafts placed in cyclosporine A treated hosts did not increase in volume nor show stem cell recruitment at ten days. While stem cell absence can be explained by the lessoning or the allogeraft response and reduced liver injury, the failure to restore volume implies a added as yet unexplored role of cyclosporine A in limiting liver regeneration. This unexpected finding deserves additional study, but may explain why very few host cells were present in the human studies reported.
The source of cells aiding regeneration is likely to be the bone marrow mesangial cell bearing the c-kit, OV-6, and CXCR-4 surface marker. It is interesting that c-kit positivity waned with time which could mean that the cells are replaced by others, or that these cells lose this “primitive marker” as they differentiate into or fused with hepatocytes. OV-6 labels the small round cell fraction present in the liver and their numbers increase greatly in response to agents such as CCl-4. In our studies OV-6 cells were scarce in normal livers, but abundant in the transplants. They carried the host allotype and are likely to have originated from the population present in the bone marrow. CXCR-4+ cells appear to be a major source of stem cells responding to stromal cell-derived factor-1 (SDF-1) (21) and deserve further study. They were present soon after transplantation and their numbers increased at 30 days suggesting that there was continuous recruitment of these cells by the small liver allografts.
We must acknowledge that our observation demonstrating that an entire allogenieic liver can be replaced by host cells is contrary to accepted concepts. Certainly, doubts regarding the pertinence and applicability of these findings abide especially with respect to explaining the immunological privilege of the liver. Does this mean that our findings should be disregarded because they occur in an unusual and trivial rat system? While this may be the case, we suggest that our studies point to the real possibility that there are interesting, unplumbed, and important relationships between the stimuli for regeneration, the magnitude of rejection, the action of various immunosuppressive agents, the availability of robust stem cells, and graft acceptance. We suggest that studies varying the interplay of these factors may prove fruitful.
Supplementary Material
Acknowledgement
We thank Kwang Woong Lee for helping with Xenogen imaging, Andrew Singer, Daniel Warren and Bin Gao (NIAAA/NIH) for advice. This work would not have been possible without the support and suggestions of Andrew S. Klein (Cedar Sinai Medical Center, CA), Robert A. Montgomery and Gregory B. Bulkley.
Financial Support:
This work was supported by US National Institutes of Health (AI065488 and F32DK072593) and the Johnson-Kiewlich Research Fund.
Abbreviations
- MHC
major histocompatibility
- OLT
orthotopic liver transplantation
- GFP
green fluorescence protein
- CsA
cyclosporine A
References
- 1.Kleeberger W, Rothämel T, Glöckner S, Flemming P, Lehmann U, Kreipe H. High frequency of epithelial chimerism in liver transplants demonstrated by microdissection and STR-analysis. Hepatology. 2002;35(1):110–6. doi: 10.1053/jhep.2002.30275. [DOI] [PubMed] [Google Scholar]
- 2.Fogt F, Beyser KH, Poremba C, Zimmerman RL, Khettry U, Ruschoff J. Recipient-derived hepatocytes in liver transplants: a rare event in sex-mismatched transplants. Hepatology. 2002;36(1):173–6. doi: 10.1053/jhep.2002.33994. [DOI] [PubMed] [Google Scholar]
- 3.Hove WR, van Hoek B, Bajema IM, Ringers J, van Krieken JH, Lagaaij EL. Extensive chimerism in liver transplants: vascular endothelium, bile duct epithelium, and hepatocytes. Liver Transpl. 2003;9(6):552–6. doi: 10.1053/jlts.2003.50116. [DOI] [PubMed] [Google Scholar]
- 4.Ng IO, Chan KL, Shek WH, Lee JM, Fong DY, Lo CM, Fan ST. High frequency of chimerism in transplanted livers. Hepatology. 2003;38(4):989–98. doi: 10.1053/jhep.2003.50395. [DOI] [PubMed] [Google Scholar]
- 5.Idilman R, Erden E, Kuzu I, Ersoz S, Karasu Z, Karayalcin K, Yuce G, Tokat Y, Sahin Y, Tukun A, Akarca US, Karayalcin S. Recipient-derived hepatocytes in sex-mismatched liver allografts after liver transplantation: early versus late transplant biopsies. Transplantation. 2004;78(11):1647–52. doi: 10.1097/01.tp.0000144055.78462.4f. [DOI] [PubMed] [Google Scholar]
- 6.Idilman R, Erden E, Kuzu I, Ersoz S, Karayalcin S. The fate of recipient-derived hepatocytes in sex-mismatched liver allograft following liver transplantation. Clin Transplant. 2007;21(2):202–6. doi: 10.1111/j.1399-0012.2006.00623.x. [DOI] [PubMed] [Google Scholar]
- 7.Gao Z, McAlister VC, Williams GM. Repopulation of liver endothelium by bone-marrow-derived cells. Lancet. 2001;357:932–933. doi: 10.1016/s0140-6736(00)04217-3. [DOI] [PubMed] [Google Scholar]
- 8.Petersen BE, Bowen WC, Patrene KD, Mars WM, Sullivan AK, Murase N, Boggs SS, Greenberger JS, Goff JP. Bone marrow as a potential source of hepatic oval cells. Science. 1999;284:1168–1170. doi: 10.1126/science.284.5417.1168. [DOI] [PubMed] [Google Scholar]
- 9.Lagasse E, Connors H, Al-Dhalimy M, Reitsma M, Dohse M, Osborne L, Wang X, Finegold M, Weissman IL, Grompe M. Purified hematopoietic stem cells can differentiate into hepatocytes in vivo. Nature Med. 2000;6:1229–1234. doi: 10.1038/81326. [DOI] [PubMed] [Google Scholar]
- 10.Wang X, Willenbring H, Akkari Y, Torimaru Y, Foster M, Al-Dhalimy M, Lagasse E, Finegold M, Olson S, Grompe M. Cell fusion is the principle source of bone-marrow-derived hepatocytes. Nature. 2003;422:897–901. doi: 10.1038/nature01531. [DOI] [PubMed] [Google Scholar]
- 11.Vassilopoulos G, Wang PR, Russell DW. Transplanted Bone marrow regenerates liver by cell fusion. Nature. 2003;422:901–904. doi: 10.1038/nature01539. [DOI] [PubMed] [Google Scholar]
- 12.Willenbring H, Bailey AS, Foster M, Akkari Y, Dorrell C, Olson S, Finegold M, Fleming WH, Grompe M. Myelomonocytic cells are sufficient for therapeutic cell fusion in liver. Nat Med. 2004;10:744–748. doi: 10.1038/nm1062. [DOI] [PubMed] [Google Scholar]
- 13.Camargo FD, Finegold M, Goodell MA. Hematopoietic myelomonocytic cells are the major source of hepatocyte fusion partners. J Clin Invest. 2004;113(9):1266–70. doi: 10.1172/JCI21301. [DOI] [PMC free article] [PubMed] [Google Scholar]
- 14.Jang YY, Collector MI, Baylin SB, Diehl AM, Sharkis SJ. Hematopoietic stem cells convert into liver cells within days without fusion. Nat Cell Biol. 2004;6:532–539. doi: 10.1038/ncb1132. [DOI] [PubMed] [Google Scholar]
- 15.Kamada N, Davies Hff., Roser BJ. Reversal of transplant immunity by liver grafting. Nature. 1981;292:840–842. doi: 10.1038/292840a0. [DOI] [PubMed] [Google Scholar]
- 16.Kamada N, Calne RY. A surgical experience with five hundred thirty liver transplants in the rat. Surgery. 1983;93:64–69. [PubMed] [Google Scholar]
- 17.Nagakawa Y, Williams GM, Zheng Q, Tsuchida A, Aoki T, Montgomery RA, Klein AS, Sun Z. Oxidative mitochondrial DNA damage and deletion in hepatocytes of rejecting liver allografts in rats: role of TNF-alpha. Hepatology. 2005;42(1):208–215. doi: 10.1002/hep.20755. [DOI] [PubMed] [Google Scholar]
- 18.Overturf K, Al-Dhalimy M, Finegold M, Grompe M. The repopulation potential of hepatocyte populations differing in size and prior mitotic expansion. Am. J. Pathol. 1999;155:2135–2143. doi: 10.1016/S0002-9440(10)65531-9. [DOI] [PMC free article] [PubMed] [Google Scholar]
- 19.Uchikura K, Wada T, Hoshino S, Nagakawa Y, Aiko T, Bulkley GB, Klein AS, Sun Z. Lipopolysaccharides induced increases in Fas ligand expression by Kupffer cells via mechanisms dependent on reactive oxygen species. Am J Physiol Gastrointest Liver Physiol. 2004;287(3):G620–626. doi: 10.1152/ajpgi.00314.2003. [DOI] [PubMed] [Google Scholar]
- 20.Nagakawa Y, Nomoto S, Kato Y, Montgomery RA, Williams GM, Klein AS, Sun Z. Over-expression of AIF-1 in liver allografts and peripheral blood correlates with acute rejection after transplantation in rats. Am J Transplant. 2004;4(12):1949–57. doi: 10.1111/j.1600-6143.2004.00621.x. [DOI] [PubMed] [Google Scholar]
- 21.Kucia M, Jankowski K, Reca R, Wysoczynski M, Bandura L, Allendorf DJ, Zhang J, Ratajczak J, Ratajczak MZ. CXCR4-SDF-1 signalling, locomotion, chemotaxis and adhesion. J Mol Histol. 2004;35(3):233–245. doi: 10.1023/b:hijo.0000032355.66152.b8. [DOI] [PubMed] [Google Scholar]
Associated Data
This section collects any data citations, data availability statements, or supplementary materials included in this article.


