

SUMMARY
Active neurons exert a mitogenic effect on normal neural precursor and oligodendroglial precursor cells, the putative cellular origins of high-grade glioma (HGG). By using optogenetic control of cortical neuronal activity in a patient-derived pediatric glioblastoma xenograft model, we demonstrate that active neurons similarly promote HGG proliferation and growth in vivo. Conditioned medium from optogenetically stimulated cortical slices promoted proliferation of pediatric and adult patient-derived HGG cultures, indicating secretion of activity-regulated mitogen(s). The synaptic protein neuroligin-3 (NLGN3) was identified as the leading candidate mitogen, and soluble NLGN3 was sufficient and necessary to promote robust HGG cell proliferation. NLGN3 induced PI3K-mTOR pathway activity and feedforward expression of NLGN3 in glioma cells. NLGN3 expression levels in human HGG negatively correlated with patient overall survival. These findings indicate the important role of active neurons in the brain tumor microenvironment and identify secreted NLGN3 as an unexpected mechanism promoting neuronal activity-regulated cancer growth.
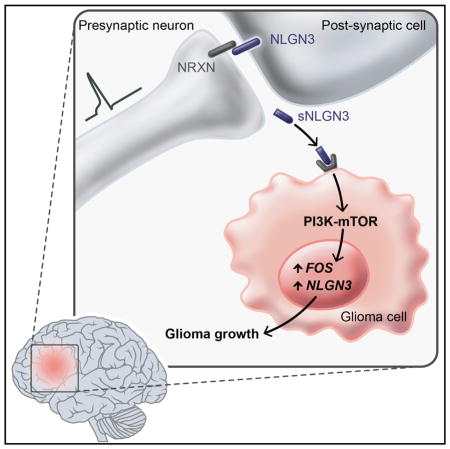
Graphical abstract
INTRODUCTION
High-grade gliomas (HGG), the leading cause of brain tumor death in both children and adults, occur in a striking spatiotemporal pattern highlighting the critical importance of the tumor microenvironment. Molecularly defined subtypes of HGG parse by neuroanatomical site of origin and patient age, with pontine and thalamic HGGs typically occurring in mid-childhood, cortical gliomas of childhood occurring in older children and young adults, and HGG of later adulthood occurring chiefly in the frontotemporal lobes (Khuong-Quang et al., 2012; Schwartzentruber et al., 2012; Sturm et al., 2012; Wu et al., 2012). These age and neuroanatomical predilections of gliomagenesis point to interactions between cell of origin and microenvironment, suggesting dysregulation of neurodevelopment and/or plasticity.
Microenvironmental determinants of glioma cell behavior are incompletely understood, although important relationships between glioma cells and neighboring microglia, astrocytes, and vascular cells have recently come to light (Charles et al., 2011; Pyonteck et al., 2013; Silver et al., 2013). While cellular origins of HGG remain unclear, converging evidence implicates oligo-dendroglial precursor cells (OPCs) and earlier neural precursor cells (NPCs) as putative cells of origin for many forms of HGG (Galvao et al., 2014; Liu et al., 2011; Monje et al., 2011; Wang et al., 2009). Clues to microenvironmental influences driving HGG growth may thus be inferred from mechanisms governing the proliferation of normal NPCs and OPCs in the postnatal brain. We recently demonstrated that neuronal activity exerts a strong mitogenic effect on normal NPCs and OPCs in juvenile and adult mammalian brains (Gibson et al., 2014), raising the possibility that neuronal activity could promote proliferation in HGG.
RESULTS
Optogenetic Control of Cortical Neuronal Activity in a Patient-Derived Pediatric Cortical HGG Orthotopic Xenograft Model
To test the role of neuronal activity in HGG growth, we employed in vivo optogenetic stimulation of premotor cortex in freely behaving mice bearing patient-derived orthotopic xenografts of pediatric cortical glioblastoma (GBM; Figure 1A–1C). The well-characterized Thy1::ChR2 mouse model expressing the excitatory opsin channelrhodopsin-2 (ChR2) in deep cortical projection neurons (Arenkiel et al., 2007; Wang et al., 2007) was crossed onto an immunodeficient background (NOD-SCID-IL2R γ-chain-deficient, NSG), resulting in a mouse model (Thy1::ChR2;NSG) amenable to both in vivo optogenetics and orthotopic xenografting. ChR2-expressing neurons respond with action potentials to 473 nm light pulses with millisecond precision (Arenkiel et al., 2007; Boyden et al., 2005; Wang et al., 2007). Expression of ChR2 does not alter membrane properties in the absence of light or neuronal health in the absence or presence of light under established experimental conditions (Boyden et al., 2005). When an optical fiber is placed just below the pial surface (Figure 1B), ~10% of the irradiance penetrates midway through cortex, thus stimulating the apical dendrites of deep cortical projection neurons expressing ChR2 (Yizhar et al., 2011). Stimulating the premotor circuit unilaterally at 20 Hz, consistent with the 10–40 Hz physiological firing rate of motor cortex projection neurons, elicits complex motor behavior (unidirectional ambulation; Arenkiel et al., 2007; Gibson et al., 2014; Wang et al., 2007). Optogenetic stimulation of the premotor circuit elicits a substantial increase in NPC and OPC proliferation (Gibson et al., 2014). At baseline, precursor cell proliferation is equivalent in mice expressing or lacking ChR2 (Gibson et al., 2014). In this experimental paradigm, the microglial inflammatory response to superficial fiber placement and subsequent light stimulation is minimal in deep cortex, where ChR2-expressing neurons reside, resolves within days, and is equal in Thy1::ChR2 mice and identically manipulated wild-type (WT) controls (Gibson et al., 2014).
Figure 1. Neuronal Activity Promotes High-Grade Glioma Proliferation and Growth In Vivo.

(A) In vivo optogenetic high-grade glioma (HGG) orthotopic xenograft model.
(B) Schematic illustration of the optogenetically stimulatable premotor circuit. Thy1::ChR2+ premotor cortex (M2) neurons depicted in blue; primary motor cortex (M1) projection neurons, green; tumor cells depicted as red dots. Gray shading indicates region of analysis.
(C) Confocal micrograph of infiltrating pHGG (SU-pcGBM2) cells expressing human nuclear antigen (HNA, red), proliferation marker Ki67 (green) in premotor cortical deep layers and subjacent corpus callosum (MBP, white).
(D and E) Single optogenetic stimulation session paradigm. (D) Proliferation index of pHGG cells in identically manipulated WT;NSG (n = 3) and Thy1::ChR2;NSG (n = 7) mice, measured by the proportion of HNA+ cells expressing EdU (left graph) or Ki67 (right graph) 24 hr after one optogenetic stimulation session. (E) Confocal micrograph illustrating proliferating (Ki67+, green) pHGG cells (HNA+, red) xenografted in WT;NSG (“WT”; left) or Thy1::ChR2;NSG mice (“ChR2”; right).
(F–H) Repetitive optogenetic stimulation sessions paradigm. Xenografted WT;NSG (n = 5) and Thy1::ChR2;NSG (n = 4) mice evaluated 48 hr after seven daily sessions of optogenetic stimulation. (F) Proliferation index (Ki67+/HNA+) as in (D) above after seven stimulations. (G) Tumor cell burden increases following 1 week of brief daily optogenetic stimulation sessions, measured as HNA+ cell density within the region of corpus callosum containing active premotor projections; data normalized to WT mean. (H) Confocal micrographs with differential interference contrast (DIC) background to illustrate regional tissue architecture; HNA+ pHGG cells (red) are infiltrating premotor cortex and subjacent corpus callosum. Dotted line indicates region of analysis in corpus callosum.
Data shown as mean ± SEM. *p < 0.05, **p < 0.01 by unpaired two-tailed Student’s t test. Scale bars, 100 μm. See also Figure S1 and Movie S1.
To develop an orthotopic xenograft model appropriate to the juvenile premotor cortex, a culture was established from pre-treatment biopsy tissue of a frontal cortex GBM (WHO grade IV) from a 15-year-old male (culture designated SU-pcGBM2; clinical characteristics, genomic characterization and DNA fingerprinting described in Table S1). These pediatric cortical HGG (pHGG) cells were xenografted unilaterally into premotor (M2) cortex of juvenile Thy1::ChR2;NSG mice, resulting in diffusely infiltrating glioma cells throughout premotor cortex and subjacent corpus callosum (Figure 1C). WT (no opsin) litter-mate control NSG mice (WT;NSG) were identically manipulated for comparison. After tumors were allowed to engraft for 2 months, an optical-neural interface was placed ipsilateral to the xenograft. The unilateral premotor cortex was optogenetically stimulated (473 nm, 20 Hz; cycles of 30 s on/90 s off over 30 min) in awake mice, resulting in unidirectional ambulation. pHGG xenografts did not impede the behavioral response to evoked premotor circuit activity (Movie S1). Light stimulation had no behavioral effect in identically manipulated xenografted WT;NSG mice. Mice were given one dose of EdU to label proliferating cells at the time of optogenetic manipulation and were sacrificed 24 hr later to examine acute effects of neural activity.
Neuronal Activity Promotes High-Grade Glioma Growth In Vivo
Tumor cell burden and distribution did not differ between groups at the time of stimulation (p = 0.74; Figures S1A and S1B). Xenografted human tumor cells (human nuclear antigen, HNA+) co-expressing EdU indicate glioma cells proliferating at the time of EdU administration and optogenetic stimulation, while co-expression of Ki67 indicates cells proliferating at the time of sacrifice 24 hr later. Within the premotor circuit (Figures 1B and S1C), the proliferation index of human tumor cells was increased in optogenetically stimulated Thy1::ChR2;NSG mice compared to that of identically manipulated WT mice, measured both as the percent of tumor cells co-expressing EdU (9.83% ± 0.38% versus 7.43% ± 0.86%; n = 7 Thy1::ChR2;NSG mice, n = 3 WT;NSG mice, respectively; p < 0.05; Figures 1D and 1E) or co-expressing Ki67 (10.53% ± 0.37% versus 7.48% ± 0.48%; n = 7 Thy1::ChR2;NSG mice, n = 3 WT;NSG mice, respectively; p < 0.01, Figures 1D and 1E). This range of observed proliferation indices is consistent with that of human glioma. Proliferation index is typically <5% for low-grade astrocytomas, 5%–15% for anaplastic astrocytomas (WHO grade III), and 10%–20% for GBMs (WHO grade IV); proliferation indices correlate inversely with prognosis, with those above 10% generally indicating poor prognosis (Johannessen and Torp, 2006). The observed activity-regulated increase in proliferation was restricted to the active circuit; in the prefrontal cortex, a region infiltrated by glioma cells but outside of the area stimulated by light, glioma cell proliferation indices were equivalent in Thy1::ChR2;NSG and WT;NSG mice (Figures S1D and S1E). While proliferation increased within the active circuit, glioma cell death remained constant, with only rare tumor cells expressing cleaved caspase-3 in either group (Figures S1F and S1G).
A simplified Galton-Watson mathematical model (Gerlee, 2013) of tumor cell growth incorporating the neuronal activity-associated increase in proliferation index (b) and a fixed cell death rate (d) would predict an exponential growth effect of elevated neuronal activity within the active circuit (xt = x0(1+(b−d))t). Such a model utilizing the observed proliferation indices predicts an activity-regulated ~25% increase in tumor cell number after seven cell divisions and ~50% tumor increase after 14 divisions. To test this prediction in vivo, we utilized a repetitive stimulation paradigm in which mice were optogenetically manipulated as above for 10 min daily on 7 consecutive days and were sacrificed 48 hr after the final session. Following repetitive elevations in premotor circuit activity, tumor cell proliferation index was increased in xenografted Thy1::ChR2;NSG mice to a similar degree as in the single optogenetic stimulation paradigm (10.74% ± 0.61 versus 7.72% ± 0.88; n = 4 Thy1::ChR2;NSG mice, n = 5 WT;NSG mice; p < 0.05, Figure 1F). As predicted, periodically elevated neuronal activity for 1 week yielded a ~42% increase in tumor cell burden within the active circuit relative to identically manipulated WT controls (n = 4 Thy1:: ChR2;NSG, n = 5 WT;NSG mice; p < 0.01; Figures 1G and 1H). These data reflect the influence of neuronal activity on tumor burden during the exponential growth phase; over the course of the disease, as disruption of healthy tissue progresses and the microenvironment evolves, the effects of neuronal activity on glioma growth could change.
Neuronal Activity Promotes Glioma Proliferation through Secreted Factors
To determine whether neurons stimulate glioma proliferation via secretion of an activity-regulated mitogen(s), we optogenetically stimulated acute cortical slices from Thy1::ChR2 or identically manipulated WT mice in situ and collected the conditioned medium (CM), to which we exposed patient-derived HGG cultures (Figure 2A). The slice stimulation paradigm mirrored the in vivo paradigm, using 473 nm light at 20 Hz for cycles of 30 s on, 90 s off over a 30 min period. For this in situ optogenetic model, expected neuronal firing in response to light was validated electrophysiologically, confirming 20 Hz spike trains for 30 s periods throughout the 30 min session (Figure 2B). Maintenance of slice health throughout this paradigm was confirmed electrophysiologically and histologically (Figures S2A–S2D). Cortical slices from WT mice were identically manipulated for comparison. In parallel, CM was collected from blue light-unexposed Thy1::ChR2 and WT cortical slices. Patient-derived HGG cultures were then placed in CM from stimulated (light-exposed) or unstimulated cortical slices (Figure 2A). The HGG cell proliferation index (fraction of total cells in S phase as detected by EdU incorporation) was determined after 24 hr exposure to CM from the acute cortical slice conditions described above. The CM from optogenetically stimulated Thy1::ChR2 cortical slices (active CM) increased the in vitro proliferation index of pHGG (SU-pcGBM2) cells in comparison to CM from all control conditions, including identically manipulated WT, unstimulated Thy1::ChR2, or unstimulated WT cortical slices, or in comparison to blue light-exposed or non-exposed aCSF medium lacking slices (F = 15.49, p < 0.0001; Figures 2C and 2D). Active CM did not alter glioma cell death, as assessed by Annexin V FACS analysis (Figure S2E). The secretion of activity-regulated mitogen(s) was not frequency dependent, as CM from Thy1::ChR2 cortical slices optogenetically stimulated at 5 Hz elicited the same proliferative effect on pHGG cells (Figure S2F).
Figure 2. Activity-Regulated Secreted Factors Promote Glioma Cell Proliferation.

(A) Schematic depicts optogenetic stimulation of acute cortical slices and collection of conditioned medium (CM).
(B) Electrophysiological demonstration by patch-clamp recording (left; trace highlighted in red is magnified at right) of 20 Hz neuronal firing in response to 20 Hz blue light pulses throughout the 30 s stimulation period in the Thy1::ChR2 cortical slice.
(C) Representative confocal micrographs show increased uptake of EdU (red) in cells (DAPI, blue) exposed to CM from stimulated Thy1::ChR2 slices (active CM) versus those exposed to CM from blue light-exposed WT slices (WT CM).
(D) Proliferation index of SU-pcGBM2 cells exposed to optogenetically stimulated or unstimulated Thy1::ChR2 cortical slice CM, blue light-exposed WT cortical slice CM (“WT stim CM”) or non-exposed WT cortical slice CM (“WT unstim CM”), or plain media (aCSF).
(E) Proliferation index of SU-pcGBM2 cells after exposure to CM generated from light-unexposed WT slice conditioning for 4 hr in the presence or absence of 1 μM tetrodotoxin (TTX).
(F–I) Active CM similarly increased the proliferation index of DIPG (F and G), adult GBM (H), and anaplastic oligodendroglioma (I) cultures.
(J–N) Active CM increased the viable cell number measured by CellTiter-Glo after 72 hr of incubation with active or light-exposed WT CM in pediatric and adult GBM (J and M), DIPG (K and L), and anaplastic oligodendroglioma (N) cells.
All experiments analyzed by one-way ANOVA and performed with n = 3 biological replicates. Data shown as mean ± SEM. *p < 0.05, **p < 0.01, ***p < 0.001, ****p < 0.0001. Scale bars, 100 μm. See also Figure S2 and Table S1.
WT cortical slices do exhibit spontaneous neuronal activity; thus, we expect activity-regulated secreted factors to be present in WT CM, albeit to a lesser extent than in media conditioned by Thy1::ChR2 slices with optogenetically elevated neuronal activity. To further explore the possible effects of spontaneous activity, we allowed WT slices to condition the media without blue light for 4 hr rather than 30 min in the presence or absence of the specific voltage-gated sodium channel blocker tetrodotoxin (TTX) to silence spontaneous action potentials. WT CM conditioned for a longer duration elicited an increase in pHGG proliferation; this effect was blocked in CM from slices incubated with TTX (proliferation index 0.32 ± 0.03 with 4 hr WT CM exposure versus ~0.25 with aCSF, aCSF + TTX, or WT CM + TTX exposure; F = 8.45; p < 0.01; Figure 2E). Together, these data indicate that spontaneous neuronal activity regulates secretion of a glioma mitogen(s).
To determine whether this proliferative response to activity-regulated secreted factor(s) was specific to the pHGG model (SU-pcGBM2 cells) or more broadly applicable, we tested nine additional patient-derived HGG cell cultures (Table S1). All four tested cultures of diffuse intrinsic pontine glioma (DIPG), the most common form of pediatric HGG, demonstrated a similarly robust proliferative response to active CM exposure (Figures 2F, 2G, S2G, and S2H). We next tested four patient-derived adult GBM cultures and found a similar increase in cell proliferation after exposure to active CM (Figures 2H, S2I, and S2J) in all but one, which was a young adult epithelioid BRAFV600E mutant GBM (SU-GBM047; Figure S2K). As the mitogenic effect appears largely generalizable across distinct HGG classes, we also tested a patient-derived culture of adult anaplastic oligo-dendroglioma and similarly observed increased cell proliferation in response to activity-regulated secreted factors (Figure 2I). Consistent with spontaneous neuronal activity of WT slices, some cultures exhibit a small but significant increase in proliferation in response to WT CM (e.g., SU-DIPGVI, proliferation index 0.21 ± 0.01 in aCSF versus 0.31 ± 0.02 in WT CM versus 0.46 ± 0.002 in active CM; Figures S2G and S2J).
To ascertain whether the observed effect indicated an increase in overall glioma growth, we used the quantitative viable cell assay CellTiter-Glo following 72 hr exposure to cortical slice CM and found an increase in viable HGG cell number when cultures were exposed to active CM (Figures 2J–2N and S2L–S2N).
Activity-Regulated Glioma Mitogen(s) Are Secreted Proteins
A series of biochemical analyses was employed to ascertain the nature of the activity-regulated mitogen(s). To determine whether the mitogen(s) are small molecules or macromolecules, active or control CM was collected as above and fractionated by molecular size. The >10 kDa macromolecular fraction of active CM, but not the <10 kDa fraction, increased the in vitro glioma proliferation index (Figure 3A). Subsequent fractionation indicated that the mitogen(s) were present in the <100 kDa fraction (Figure 3B). To determine the biochemical nature of the mitogen(s), active CM was heated to >100°C to denature proteins, resulting in loss of its mitogenic effect (Figure 3C). In contrast, treatment of active CM with RNase and DNase had no effect on its proliferation-inducing capacity (Figure 3D). Taken together, these data indicate that the neuronal activity-regulated secreted mitogen(s) is a protein between 10–100 kDa.
Figure 3. Cortical Neuronal Activity-Regulated Glioma Mitogen(s) Are Protein(s).

(A and B) Fractionation of CM by molecular size reveals that the activity-regulated mitogenic factors are >10 kDa (A) and <100 kDa (B).
(C) Heating active CM to 100°C inactivates the mitogen(s).
(D) RNA and DNA digestion of active CM does not change its mitogenic effect. All experiments analyzed by one-way ANOVA and performed with n = 3 biological replicates. Data shown as mean ± SEM. **p < 0.01, ***p < 0.001, ****p < 0.0001. n.s. indicates p > 0.05.
(E) Representative two-dimensional gel electrophoresis separating proteins in light-exposed WT CM (green) and active CM (red) by size (vertical axis) and charge (horizontal axis); merged images, right-most panel.
(F) Volcano plot of spectral counting data shows the ratio of peptides in a given protein found in active CM versus CM from unstimulated Thy1::ChR2 slices. Neuroligin-3 (Nlgn3) is highlighted and circled in red.
(G) List of candidate proteins of interest identified from proteomic analyses.
(H) Nlgn3 peptide sequence. Peptides in red were identified by mass spectrometry of the Nlgn3 isolated from active CM. Despite excellent coverage across the N-terminal ectodomain of the protein, no part of the C-terminal endodomain (transmembrane and intracellular domains, shaded gray) was identified in the isolated soluble Nlgn3.
With respect to small molecules, high levels of glutamate release into CM would not be expected in a healthy brain slice, as perisynaptic astrocytes take up released glutamate from the synaptic cleft (Rothstein et al., 1996). Indeed, low levels of glutamate were present in active CM (Figure S3A). Thus, this in situ experimental paradigm does not address the potential role of glutamate in neuronal activity-regulated glioma cell proliferation in vivo.
Cortical Projection Neuronal Activity-Regulated Secretome
To identify the secreted protein(s) that increase glioma cell proliferation in an activity-dependent manner, we employed mass spectrometric analyses of the cortical slice CM. Of note, neuronal activity may regulate secretion of proteins from neurons themselves or from other cell types in response to active neurons. Active CM and light-exposed WT CM were analyzed and compared using 2D gel electrophoresis to separate the secreted proteins by size and charge; differentially secreted protein spots were then identified by mass spectrometry. The 2D gel analyses were performed in duplicate using independent samples (Figure 3E). Quantitative mass spectrometric techniques of spectral counting and tandem mass tags (TMT) were then used with a third set of independent samples to confirm the 2D gel results and to more precisely define the absolute and relative quantities of each protein in the CM samples. The intersection of these analyses most consistently and robustly identified neuroligin-3 (Nlgn3) as the leading candidate mitogen (Figure 3F), present in active CM at a concentration of ~20–40 nM and upregulated by 2.6-fold compared to light-exposed WT CM. Additional candidates identified are listed in Figure 3G.
The neuroligins are a family of synaptic proteins with a large N-terminal ectodomain, single pass transmembrane domain, and smaller C-terminal cytoplasmic domain (Südhof, 2008). Neuroligin-1 (Nlgn1), acting primarily at excitatory synapses similarly to Nlgn3, is secreted in an activity-regulated fashion by enzymatic cleavage of the N-terminal ectodomain (Peixoto et al., 2012; Suzuki et al., 2012). The 2D gel and quantitative mass spectrometric analyses across all three independent samples demonstrated excellent coverage of the Nlgn3 ectodomain amino acid sequence (protein prophet score = 1; Table S2), identifying the protein with high confidence (Figure 3H). However, the C-terminal transmembrane and cytoplasmic domain of the protein was not detected in Nlgn3 isolated from the active CM (Figure 3H).
Secreted Neuroligin-3 Promotes Glioma Cell Proliferation
The sufficiency of NLGN3 to promote HGG cell proliferation was then tested in vitro. We obtained recombinant full-length human NLGN3 and confirmed its identity and purity by mass spectrometry (Figure S3B). In contrast to the Nlgn3 present in the CM, mass spectrometric analysis of recombinant NLGN3 did identify peptide sequences within the C-terminal tail. 24 hr exposure of pHGG cells to recombinant NLGN3 at various concentrations in vitro promoted a significant increase in proliferation index (Figure 4A), with no change in cell death as measured by Annexin V FACS analysis (Figure 4B). NLGN3 at the concentration present in the active CM (20–40 nM) elicits an increase in proliferation commensurate with the effect of active CM (Figures 4A and 2D). NLGN3 promoted proliferation of each additional patient-derived cell culture tested, including DIPG, adult GBM, and anaplastic oligodendroglioma, with the exception of the epithelioid GBM culture (Figures 4C and S4A).
Figure 4. Secreted Neuroligin-3 Mediates Neuronal Activity-Regulated Glioma Proliferation.

(A) Seven-point dose curve plots SU-pcGBM2 proliferation index as measured by EdU+/DAPI+ staining 24 hr after exposure to recombinant NLGN3 at a 0–100 nM concentration range. Shaded region indicates concentration present in active CM.
(B) After 24 hr exposure to PBS or NLGN3 (50 nM), SU-pcGBM2 cells were stained with DAPI (x axis) and Annexin V-FITC (y axis) to detect cell death by FACS analysis, performed in biological duplicate. Live Annexin V−/DAPI− cells shown in lower-left quadrant of contour plots; pre-apoptotic Annexin V+/DAPI− cells, left upper quadrant; dead Annexin V+/DAPI+ cells, right upper quadrant. No increase in cell death was seen with NLGN3 exposure.
(C) Proliferation indices of various patient-derived HGG cell lines exposed to 50 nM NLGN3 for 24 hr (unpaired two-tailed Student’s t tests).
(D) Neurexin-1β (NRXN, 500 nM), which binds NLGN3 with high affinity, effectively blocks the mitogenic effect of recombinant NLGN3 (50 nM) and abrogates the mitogenic effect of active CM (unpaired two-tailed Student’s t tests). Exposure to NRXN alone or added to light-exposed WT CM (“WT Stim CM”) does not affect pHGG cell proliferation (one-way ANOVA).
For all experiments, n = 3 biological replicates unless otherwise noted. Data shown as mean ± SEM. *p < 0.05, **p < 0.01, ***p < 0.001. n.s. indicates p > 0.05. See also Figure S4.
Additional candidates identified in the proteomic analyses above were also screened in pHGG cells in vitro. Of these, brain-derived neurotrophic factor (BDNF) and the known glioma mitogen 78 kDa glucose-regulated protein (GRP78; Lee et al., 2008) promoted pHGG proliferation but less potently than NLGN3 (Figures S4B–S4D). Additional candidates tested did not affect proliferation, even at high concentrations (Figure S4B). Thus, NLGN3 emerged as an unexpected cortical neuronal activity-regulated glioma mitogen, together with known mitogens BDNF and GRP78.
To test the necessity of Nlgn3 for the proliferation-promoting effect of active CM, we utilized the specific and avid binding of neurexin-1β (NRXN1β) to NLGN3 (Ichtchenko et al., 1996) to deplete Nlgn3 from the cortical slice CM. Confirming that NRXN1β in this setting does deplete the available Nlgn3, addition of NRXN1β completely abrogated the mitogenic effect of recombinant NLGN3 exposure (proliferation index 0.40 ± 0.01 in pHGG cells exposed to 50 nM NLGN3 versus 0.28 ± 0.01 in cells exposed to 50 nM NLGN3 + 500 nM NRXN1β; p < 0.001; Figure 4D). Addition of NRXN1β alone to aCSF or to WT CM had no effect on proliferation index (Figure 4D). However, addition of NRXN1β significantly decreased the mitogenic effect of active slice CM on pHGG cells (proliferation index 0.40 ± 0.01 in cells exposed to active CM versus 0.34 ± 0.01 with exposure to active CM + NRXN1β; p < 0.05; Figure 4D), indicating that secreted NLGN3 is necessary for the full mitogenic effect of cortical neuronal activity on glioma cells. The incomplete abrogation of the mitogenic effect of the CM with addition of NRXN1β is consistent with additional activity-regulated glioma mitogens GRP78 and BDNF present in the CM (Figures S4B–S4D). Indeed, pharmacological inhibition of the BDNF receptor TRKB in combination with NRXN1β completely abrogated the proliferative effect of active CM (Figure S4E).
Downstream Mechanisms of Neuronal Activity-Regulated Glioma Proliferation
To begin to understand the intracellular signaling mechanisms by which neuronal activity promotes HGG cell proliferation, we performed RNA sequencing to define the transcriptome of pHGG cells exposed to active CM versus light-exposed WT CM. Pathway analysis of differentially regulated genes revealed upregulation of the immediate early gene and proto-oncogene FOS, whose expression can be downstream of pathways that include PI3K-mTOR signaling or MAPK signaling (Greenberg and Ziff, 1984; Gonzales and Bowden, 2002; Chen and Davis, 2003), suggesting potential involvement of either pathway (Table S3). Exposure to NLGN3 similarly resulted in upregulation of FOS expression, determined by qPCR (Figure 5A). However, western blot analysis did not reveal upregulation of phospho-ERK1/2T202/Y204, an indicator of MAPK pathway activation, following NLGN3 exposure (Figures S5A and S5B). We thus examined PI3K pathway recruitment by exposure to NLGN3 using western blot analysis of phospho-AKTS473; pHGG cells exposed to NLGN3 exhibited increased phospho-AKTS473 levels relative to total AKT in a dose-dependent manner (F = 17.99, p < 0.001; Figure 5B–C). PI3K canonically regulates mammalian target of rapamycin (mTOR), and thus we examined the effect of NLGN3 exposure on mTOR activity using western blot analysis of phospho-4E-BP1T37/46, revealing an increase in phospho-4E-BP1T37/46 relative to total 4E-BP1 following NLGN3 exposure (Figures 5D and 5E). Blockade of PI3K or mTOR pharmacologically or via shRNA-mediated knockdown prevented the NLGN3-mediated mitogenic effect (Figures 5F–5H and S5C–S5E). Neuronal activity-regulated secretion of NLGN3 thus recruits the PI3K-mTOR pathway to promote glioma cell proliferation.
Figure 5. Secreted Neuroligin-3 Recruits the PI3K Pathway and Promotes Feedforward Expression of NLGN3.

(A) FOS mRNA expression increases after 1 hr exposure to 50 nM NLGN3 compared to vehicle (p < 0.01 by unpaired two-tailed Student’s t test).
(B) NLGN3 increases PI3K pathway signaling. Representative western blot shows increased phosphorylation of AKT (pAKTS473, top; total AKT, bottom) in response to NLGN3 concentrations ranging from 0 to 50 nM.
(C) Quantification of the pAKTS473/AKT ratio fold change (normalized to aCSF) observed in (B).
(D) Representative western blot demonstrates increased phosphorylation of 4E-BP1, a downstream reporter of mTOR, after 50 nM NLGN3 exposure. (Top) 4E-BP1T37/46; (bottom) total 4E-BP1.
(E) Quantification of p4E-BP1T37/46/4E-BP1 ratio fold change after NLGN3 exposure normalized to aCSF control (unpaired two-tailed Student’s t test).
(F) 50 nM NLGN3-induced increase in SU-pcGBM2 proliferation index (EdU assay) is blocked by inhibition of PI3K by BKM120 (100 nM).
(G) Similar to (F), inhibition of mTOR by RAD001 (100 nM) blocks 50 nM NLGN3-induced proliferation in SU-pcGBM2 cells.
(H) Genetic knockdown using specific shRNA against either PI3K or mTOR blocks effect of 50 nM NLGN3 on proliferation index (EdU assay in SU-pcGBM2). *p < 0.05, **p < 0.01, ***p < 0.001, ****p < 0.0001 by one-way ANOVA with Tukey’s post hoc tests to further examine pairwise comparisons unless otherwise indicated.
All experiments performed in n = 3 biological replicates. Data shown as mean ± SEM. See also Figure S5 and Table S3.
Surprisingly, we also found upregulated expression of the neuroligin-3 gene (NLGN3) in pHGG cells exposed to active CM (Table S3), suggesting a positive feedforward effect on glioma cell NLGN3 expression. To determine whether soluble NLGN3 exposure induces its own expression, we performed qPCR in cells exposed to recombinant NLGN3 and found that this elicits increased glioma cell NLGN3 gene expression, tested in both pediatric cortical HGG (F = 9.70, p < 0.01; Figure 6A) and DIPG cells (F = 13.56, p < 0.01; Figure 6B). The role of PI3K-mTOR pathway activity in this positive feedforward effect was investigated using treatment with the PI3K inhibitor BKM120 or shRNA-mediated PI3K knockdown (Figures 6A–6D), both of which blocked the soluble NLGN3-induced increase in NLGN3 gene expression (Figures 6A–6D and S6). Similarly, the mTOR inhibitor RAD001 or shRNA-mediated mTOR knockdown prevented the feedforward effect of NLGN3 on NLGN3 gene expression (Figures 6C and 6E–6G). Soluble NLGN3 thus promotes glioma cell feedforward expression of NLGN3 via the PI3K-mTOR pathway. To determine whether other ligands known to stimulate the PI3K pathway in glioma (Fan et al., 2009) similarly affect NLGN3 expression, we tested the effect of epidermal growth factor (EGF) exposure on glioma cell NLGN3 expression and found no effect (p = 0.781; Figure 6H), suggesting that NLGN3 expression is specific to the context of NLGN3 exposure. Protein expression of NLGN3 following glioma cell NLGN3 exposure was confirmed using western blot analysis; in contrast, glioma cell NLGN3 protein expression was not found at baseline culture conditions (Figure 6I). NLGN3 thus results in feedforward expression at the transcriptional and translational levels. Together, these findings indicate that NLGN3 expression is an indicator of neuronal activity-dependent NLGN3 signaling to glioma cells (Figure 6J).
Figure 6. Secreted Neuroligin-3 Promotes Feedforward Expression of NLGN3 through Recruitment of the PI3K-mTOR Pathway.

(A) NLGN3 mRNA expression in SU-pcGBM2 cells after 12 hr exposure to vehicle, 50 nM NLGN3, 100 nM BKM120, or 50 nM NLGN3 + 100 nM BKM120.
(B) As in (A), SU-DIPGXIII NLGN3 mRNA expression after exposure to NLGN3 and BKM120 alone or in combination.
(C–E) NLGN3 mRNA expression in SU-pcGBM2 cells after shRNA-mediated knockdown of either PI3K or mTOR. Only cells exposed to scrambled shRNA control exhibit increased NLGN3 expression after NLGN3 exposure (unpaired two-tailed Student’s t test.)
(F) NLGN3 mRNA expression in SU-pcGBM2 cells after 12 hr exposure to vehicle, 50 nM NLGN3, 100 nM RAD001, or 50 nM NLGN3 + 100 nM RAD001.
(G) As in (F), SU-DIPGXIII NLGN3 mRNA expression after exposure to NLGN3 and RAD001 alone or in combination.
(H) NLGN3 mRNA expression in SU-pcGBM2 cells does not change after 12 hr exposure to 50 nM EGF versus vehicle (unpaired two-tailed Student’s t test). All qPCR data (A–H) are normalized to vehicle-treated samples and represent fold change of the delta CT in reference to β-actin.
(I) Western blot analysis illustrating NLGN3 protein expression. Lanes 1 and 2 = 10 nM and 25 nM recombinant FLAG-tagged NLGN3, respectively. Lanes 3 and 4 = lysate from SU-pcGBM2 cells exposed to aCSF or 50 nM recombinant FLAG-tagged NLGN3, respectively. Top panel probed with anti-NLGN3; bottom panel probed with anti-FLAG.
(J) Schematic illustrating the model of neuronal activity-regulated NLGN3 secretion from a post-synaptic cell, subsequent recruitment of glioma cell PI3K-mTOR pathway, expression of FOS and NLGN3, and proliferation.
n = 3 biological replicates unless otherwise stated. Data shown as mean ± SEM. *p < 0.05, **p < 0.01, ***p < 0.001 by one-way ANOVA unless otherwise stated. n.s. indicates p > 0.05. See also Figure S6 and Table S3.
Neuroligin-3 Gene Expression Is Associated with Decreased Survival in Human High-Grade Glioma
Having demonstrated that NLGN3 exposure increases tumor cell NLGN3 expression, we next asked whether the NLGN3 gene exhibited aberrations in glioma. Analysis of data from The Cancer Genome Atlas (TCGA) showed that somatic mutations in NLGN3 are infrequent in pediatric (pilocytic astrocytoma/medulloblastoma, 0.4%) and adult brain tumors (low-grade gliomas, 1.1%; high-grade gliomas, 0.4%; Table S4). Interestingly, an extended analysis of NLGN3 mutations and copy-number aberrations across multiple cancer types in the International Cancer Genome Consortium (ICGC) and the cBioPortal for Cancer Genomics databases revealed more frequent mutations and amplifications in other tumors, with particular predominance in thyroid, pancreatic, prostate, and gastric cancers (Figure S7C and Table S4).
To validate the clinical significance of NLGN3 in human glioma pathophysiology, we next examined the relationship between NLGN3 gene expression and patient survival in 429 cases of adult GBM in TCGA. NLGN3 mRNA expression level was found to be inversely correlated with patient overall survival (Figure 7). A two-class model in which patients were stratified according to median NLGN3 expression showed an association between higher NLGN3 expression and shorter survival (p < 0.05 by the log-rank test; Figure 7A). In patients whose tumors exhibited below-median NLGN3 expression, estimated mean survival was 20.8 months (95% CI, 17.1–24.4); in comparison, mean survival of patients with above-median NLGN3 expression was 15.2 months (95% CI, 13.1–17.2). On Cox regression analysis, the hazard ratio for death with high versus low NLGN3 expression was 1.31 (95% CI, 1.05–1.63). NLGN3 expression was also significantly inversely associated with patient survival in a continuous Cox proportional-hazards regression analysis, such that higher expression represented an unfavorable prognosis (hazard ratio for death with high versus low NLGN3 expression, 1.15; 95% CI, 1.01–1.30; p < 0.05).
Figure 7. Neuroligin-3 Expression Inversely Correlates with Survival in Human Glioblastoma.

(A) A two-class model stratified by median NLGN3 expression in 429 GBM cases with molecular subtype data from the TCGA (http://cancergenome.nih.gov). Mean overall survival decreases by ~5.6 months in patients with tumors exhibiting above-median NLGN3 expression; p < 0.05 by the log-rank test.
(B) GBM subtype-specific NLGN3 expression. Box plots show the smallest and largest observations (top and bottom whiskers, respectively), the interquartile (IQ) range (box), and the median (black line). Data points more than 1.5 times the IQ range lower than the first quartile or 1.5 times the IQ range higher than the third quartile were considered outliers (shown as circles outside the box and whisker plot). Corresponding table of Kruskal-Wallis one-way ANOVAs with p values indicates pairwise comparisons of NLGN3 expression in the four subtypes and significance of differential NLGN3 expressions. See also Figure S7, Table S4.
To examine the specificity of these findings, we explored the relationship of neuroligin-2 (NLGN2) to survival in human GBM. Recombinant NLGN2 does not promote pHGG proliferation in vitro (Figure S7D). Likewise, there is no significant association between NLGN2 expression and patient survival in adult GBM, assessed as above in a continuous Cox model (hazard ratio for death with high versus low NLGN2 expression, 0.95; 95% CI, 0.78–1.16; p = 0.634) and in a two-class model stratified by median expression (p = 0.795 by the log-rank test; Figure S7E).
Interestingly, upon examination of NLGN3 expression by molecular GBM subtype as defined by TCGA (Verhaak et al., 2010), NLGN3 expression was significantly lower in the mesenchymal subtype compared to classical, neural, and proneural subtypes (asymptotic significance of p < 0.001 by independent-samples Kruskal-Wallis test; Figure 7B). Notably, NLGN3 expression remained significantly associated with patient survival in a multivariate Cox model that incorporates molecular subtype (hazard ratio for death with high versus low NLGN3 expression, 1.15; 95% CI, 1.01–1.30; p < 0.05).
DISCUSSION
Neurons in the Glioma Microenvironment
The results presented here demonstrate that excitatory neuronal activity can influence brain cancer growth. This represents a striking example of the core physiological function of an organ promoting the growth of a cancer arising within it. An important mechanism mediating this key microenvironmental interaction is activity-regulated secretion of NLGN3. The importance of NLGN3 in HGG pathophysiology is underscored by the finding that NLGN3 expression strongly predicts survival in human HGG. Taken together, these data elucidate a fundamental dimension of the HGG microenvironment and identify a robust and targetable mechanism driving HGG proliferation.
The role that neurons may play in brain cancer is underscored by perineuronal satellitosis, the histopathological hallmark of multiple forms of glioma characterized by tumor cell clustering around neuronal somata (Scherer 1938). A wealth of elegant data illustrates that neurotransmitters and neuropeptides can affect glioma cell behavior (Cuddapah et al., 2014; Labrakakis et al., 1998; Seifert and Sontheimer, 2014; Synowitz et al., 2001); for example, glutamate secreted from glioma cells influences their own proliferation and invasion through autocrine/paracrine signaling and subsequently increases the excitability of affected cortical networks (Buckingham et al., 2011; Campbell et al., 2012; Ishiuchi et al., 2002, 2007). However, a direct influence exerted by active parenchymal neurons upon the glioma environment has not been well appreciated. The critical role of neural elements in the cancer microenvironment has recently been elucidated for prostate (Magnon et al., 2013), pancreatic (Stopczynski et al., 2014) and gastric (Zhao et al., 2014) cancers, in which peripheral innervation was found to potently promote cancer progression. Our results suggest that active neurons play an important role in the microenvironment of brain tumors through malignant hijacking of mechanisms central to brain plasticity.
Normal and Malignant Neuron-Glial Interactions
A surprisingly broad range of molecularly and clinically distinct classes of HGG exhibited neuronal activity-regulated proliferation, and this response to neuronal activity mirrors that of putative HGG cells of origin. While the cellular origins of HGG may vary among subtypes of the disease, mounting evidence suggests that not only oligodendrogliomas (Persson et al., 2010; Sugiarto et al., 2011), but also many high-grade astrogliomas, arise from precursor cells in the oligodendroglial lineage, including NPCs/early OPCs (Monje et al., 2011) and OPCs (Liu et al., 2011; Galvao et al., 2014; Glasgow et al., 2014). OPCs, the most mitotically active cells in the postnatal brain (Geha et al., 2010), may be particularly susceptible to malignant transformation due to Olig2-mediated suppression of p53 function (Mehta et al., 2011). Overexpression of a single transcription factor can determine the oligodendroglial or astrocytic phenotype of oligodendroglial lineage cell-derived tumors (Glasgow et al., 2014). A salient example of this point is the tumor from which the adult GBM culture SU-GBM052 used in this study was derived, a grade IV astrocytoma apparently arising from a transformed grade II oligodendroglioma. The “proneural,” and to a lesser extent the “neural” and “classical,” molecular subtypes of adult GBM, are defined by expression of oligodendroglial lineage-associated genes (Verhaak et al., 2010). Intriguingly, our data demonstrate that NLGN3 is expressed abundantly in these three subtypes of GBM compared to “mesenchymal” GBM, supporting the concept of a lineage-specific molecular relevance of NLGN3 to gliomagenesis. Normal NPCs and OPCs respond briskly to neuronal activity, and in the healthy juvenile and adult brain this response results in the activity-regulated generation of mature oligodendrocytes and remodeling of myelin, improving the function of that active circuit (Gibson et al., 2014). The findings presented here suggest that the malignant counterparts of these activity-responsive neural precursor cells may exploit mechanisms of myelin development and plasticity to promote growth.
Neuroligin-3 in Health and Disease
The finding that NLGN3 is a glioma mitogen opens numerous doors to a deeper mechanistic understanding of its role in health and disease. The neuroligins are post-synaptic adhesion molecules that are important in synaptic function and plasticity (Südhof, 2008; Varoqueaux et al., 2006). Nlgn1 and Nlgn3 are found in excitatory synapses, while Nlgn2 participates in inhibitory synapses (Gibson et al., 2009; Südhof, 2008). The canonical binding partners of the neuroligins are presynaptic β-neurexins (Ichtchenko et al., 1996; Südhof, 2008). While wild-type neuroligins play a central role in normal synaptic function, NLGN3 mutations are implicated in altered synaptic function in autism (Jamain et al., 2003; Rothwell et al., 2014; Tabuchi et al., 2007). Our data show that somatic mutations and amplifications in NLGN3 are also found at varying frequency in different types of human malignancies, supporting a possibly broader role of NLGN3 in cancer. Such mutations are less frequent in gliomas, implying that non-genetic mechanisms of NLGN3 deregulation may predominate in neoplasms of organs that normally express NLGN3. Such mechanisms may include, as we show here, activity-regulated secretion coupled with a positive feedforward effect on expression. Interestingly, NLGN3 mutations and amplifications are prominent in pancreatic, prostate, and gastric cancers, for which a cancer growth-promoting role of innervation has been demonstrated (Stopczynski et al., 2014; Magnon et al., 2013; Zhao et al., 2014).
Neuroligin Secretion
Nlgn1 and Nlgn2 are known to undergo activity-dependent cleavage at the C-terminal transmembrane and cytoplasmic domain with resultant secretion of the N-terminal ectodomain (Peixoto et al., 2012; Suzuki et al., 2012). The data presented here illustrate activity-regulated secretion of Nlgn3 in the context of cortical projection neuronal activity. The mechanism of Nlgn3 secretion remains to be seen, but the apparent absence of the C-terminal transmembrane and cytoplasmic domain in the Nlgn3 protein identified in the active slice CM suggests similarities with mechanisms of Nlgn1 and Nlgn2 secretion. Given the enormous complexity of neurexin splice variants (> 1,000; Ullrich et al., 1995) and possible alternative binding partners (Samarelli et al., 2014), the identity of the binding partner for NLGN3 in glioma cells remains an open question for further exploration.
While the present study provides evidence that active neurons promote HGG proliferation, this intercellular interaction may be indirect. Neuronal activity influences multiple cell types within an active neural circuit, and numerous activity-responsive cell types could play a role in promoting glioma growth. It is possible that NLGN3 is secreted directly from active neurons or from OPCs, which act as post-synaptic cells in axoglial synapses (Bergles et al., 2010; Bergles et al., 2000) and express the highest level of Nlgn3 mRNA of any neural cell type (Zhang et al., 2014).
Neuroligin-3, PI3K Pathway, and Feedforward Expression
How NLGN3 recruits the glioma cell PI3K pathway is not yet clear, but links between neuroligin binding and receptor tyrosine kinase (RTK) activation, frequently upstream of PI3K, have been described in other contexts. Nlgn1 binding to Nrxn1β in presynaptic neurons promotes neurite outgrowth in a manner that depends upon Nrxn1β-mediated activation of the RTK fibroblast growth factor receptor-1 (Fgfr1; Gjørlund et al., 2012). A similar NRXN-RTK interaction may mediate NLGN3 stimulation of PI3K activity in HGG if a NRXN family member is indeed the binding partner of NLGN3 in glioma cells.
PI3K-mediated feedforward regulation of NLGN3 gene and protein expression was unexpected. NLGN3 is not part of the canonical PI3K gene expression signature (Creighton et al., 2010), and, as demonstrated above, other growth factors known to stimulate PI3K such as EGF do not elicit changes in NLGN3 gene expression in glioma cells, indicating that NLGN3 is not a general marker of PI3K activity but is rather specific to this context. PI3K has been shown to regulate Nlgn1 and Nlgn2 translation (Gkogkas et al., 2013), suggesting another link between PI3K pathway activity and regulation of NLGN3 expression. Future work will elucidate the manner in which NLGN3 recruits PI3K and subsequently promotes feedforward glioma NLGN3 expression.
Additional Mechanisms of Neuronal Activity-Regulated Glioma Proliferation
It is also important to note that NLGN3 is almost certainly not the only important mechanism promoting activity-regulated glioma growth. Indeed, GRP78 and BDNF were also identified as glioma mitogens, and accordingly, Nlgn3 depletion resulted in a significant but incomplete abrogation of the mitogenic capacity of the CM, indicating partial contributions from other mitogens such as these. Recent single-cell analyses have elucidated intra-tumoral cellular heterogeneity in HGG (Patel et al., 2014), and it is not yet clear if these different activity-regulated mitogens act on the same or different cellular subpopulations. The candidate activity-dependent mitogens were recognized here via differential regulation and secretion that enabled their identification in the CM following a burst of cortical neuronal activity. Beyond these candidates, additional possible mitogens could be secreted in a more local manner or on a different timescale that precludes their identification within this experimental paradigm. Cell-contact-mediated mechanisms of activity-regulated glioma growth were also not evaluated in our in situ system. One mechanism that we do not evaluate explicitly is activity-regulated glutamate release. Certainly, glutamate released by glioma cells (Buckingham et al., 2011; Campbell et al., 2012; Ishiuchi et al., 2002, 2007) is well-demonstrated to promote glioma growth, and local neuronal glutamate release could function similarly, possibly contributing to the mitogenic effect of active neurons witnessed in vivo.
Conclusions
NLGN3 was identified as an unexpected mitogen promoting HGG growth. It is yet unclear whether NLGN3 similarly mediates healthy myelin plasticity, which future work should address. If that proves to be the case, this important synaptic protein could represent a mechanism of coupling synaptic plasticity and myelin plasticity. Regardless, neuron-glioma cell interactions, including NLGN3 secretion and subsequent signaling to the oncogenic PI3K-mTOR pathway in glioma cells, represent therapeutic targets for this group of devastating brain tumors.
EXPERIMENTAL PROCEDURES
See the Extended Experimental Procedures for detailed experimental procedures.
Isolation and Culture of the Primary Human Tumor Cells
Tumor tissue was dissociated and cultured as described in the Extended Experimental Procedures.
Orthotopic Xenografting
600,000 SU-pcGBM2 cells were stereotactically implanted into the M2 premotor cortex of Thy1::ChR2;NSG or WT;NSG littermate mice at P35. Cells were allowed to engraft for at least 2 months prior to placement of an optical-neural interface for optogenetic stimulation.
In Vivo Optogenetic Stimulation
At least 7 days prior to stimulation, the optical-neural interface was placed just below the pial surface of the cortex ipsilateral to xenografts. For the single stimulation paradigm, animals were stimulated with cycles of 473 nm light pulses at 20 Hz for 30 s, followed by 90 s of recovery over a 30 min period and sacrificed 24 hr after stimulation. For the repetitive stimulation paradigm, animals were stimulated as above for 10 min periods on 7 consecutive days and were sacrificed 48 hr after the final session.
Generation of Conditioned Media
In short, Thy1::ChR2 or WT mouse brains were cut in 350 μm sections on a vibratome, allowed to recover, and stimulated at 20 Hz using a blue-light LED transmitted through the microscope objective. Surrounding medium was then collected for immediate use or frozen at −80°C for future experiments.
Determination of Cell Proliferation In Vitro
To assess the number of cells actively entering S phase in response to various conditions (see Extended Experimental Procedures), patient-derived glioma cell cultures were exposed to cortical slice CM or various recombinant proteins along with 10 μM EdU and were fixed after 24 hr. EdU incorporation was determined using Click-iT EdU visualization (Invitrogen).
Proteomic Analysis
Determination of proteins found within the active CM was done using 2D-gel electrophoresis accompanied by LC MS/MS.
Western Blot Analysis
Protein levels were determined using western blot analyses. Briefly, after various treatments, 400,000 SU-pcGBM2 cells were lysed and loaded onto SDS-PAGE gels. Proteins were separated with gel electrophoresis and transferred to a PVDF membrane. Proteins were then probed with various antibodies as described in Extended Experimental Procedures.
qPCR
After various cell treatments (described in Extended Experimental Procedures), RNA was extracted from 500,000 SU-pcGBM2 or SU-DIPGXIII cells using TRIzol reagent. cDNA was generated using RT-PCR, and gene expression changes were further probed using quantitative PCR.
Supplementary Material
Highlights.
Neuronal activity promotes high-grade glioma (HGG) proliferation and growth
Neuroligin-3 is an activity-regulated secreted glioma mitogen
Neuroligin-3 induces PI3K-mTOR signaling in HGG cells
Neuroligin-3 expression is inversely correlated with survival in human HGG
Acknowledgments
The authors gratefully acknowledge support from the Matthew Larson Foundation, Godfrey Family Fund in Memory of Fiona Penelope, National Institute of Neurological Disorders and Stroke (NINDS K08NS070926), McKenna Claire Foundation, National Science Foundation Graduate Research Fellowship Program, California Institute for Regenerative Medicine (CIRM RB4-06093 and RN3-06510), Alex’s Lemonade Stand Foundation, The Cure Starts Now Foundation, Lyla Nsouli Foundation, Unravel Pediatric Cancer, the Wayland Villars DIPG Foundation, the Dylan Jewett, Connor Johnson, Zoey Ganesh, Dylan Frick, Abigail Jensen, and Jennifer Kranz Memorial Funds, Virginia and D.K. Ludwig Fund for Cancer Research, the Bear Necessities Pediatric Cancer Foundation, Lucile Packard Foundation for Children’s Health, Stanford University School of Medicine Dean’s Fellowship, Child Health Research Institute at Stanford Anne T. and Robert M. Bass Endowed Faculty Scholarship in Pediatric Cancer and Blood Diseases, National Cancer Institute (PSOC-MCSTART U54CA143907), Canary Foundation, Ben and Catherine Ivy Foundation, and the Sujal and Meera Patel Foundation. Special thanks to Sarah Chen for illustrations, to Elizabeth Hoyte for assistance with figures, to Eric Raabe for use of the JHH-DIPGI cell line, and to Tom Südhof for helpful discussions.
Footnotes
ACCESSION NUMBERS
The accession number for RNA-seq data deposited in the GEO database is GEO: GSE62563.
Supplemental Information includes Extended Experimental Procedures, seven figures, one movie, and four tables and can be found with this article online at http://dx.doi.org/10.1016/j.cell.2015.04.012.
AUTHOR CONTRIBUTIONS
H.S.V. and T.B.J. conducted all experiments and contributed to experimental design, manuscript editing, and data analysis for all sections. V.C. contributed to conducting in vivo experiments and to experimental design. M.M. designed all experiments, wrote the manuscript, and supervised all aspects of the work.
References
- Arenkiel BR, Peca J, Davison IG, Feliciano C, Deisseroth K, Augustine GJ, Ehlers MD, Feng G. In vivo light-induced activation of neural circuitry in transgenic mice expressing channelrhodopsin-2. Neuron. 2007;54:205–218. doi: 10.1016/j.neuron.2007.03.005. [DOI] [PMC free article] [PubMed] [Google Scholar]
- Bergles DE, Roberts JD, Somogyi P, Jahr CE. Glutamatergic synapses on oligodendrocyte precursor cells in the hippocampus. Nature. 2000;405:187–191. doi: 10.1038/35012083. [DOI] [PubMed] [Google Scholar]
- Bergles DE, Jabs R, Steinhäuser C. Neuron-glia synapses in the brain. Brain Res Brain Res Rev. 2010;63:130–137. doi: 10.1016/j.brainresrev.2009.12.003. [DOI] [PMC free article] [PubMed] [Google Scholar]
- Boyden ES, Zhang F, Bamberg E, Nagel G, Deisseroth K. Millisecond-timescale, genetically targeted optical control of neural activity. Nat Neurosci. 2005;8:1263–1268. doi: 10.1038/nn1525. [DOI] [PubMed] [Google Scholar]
- Buckingham SC, Campbell SL, Haas BR, Montana V, Robel S, Ogunrinu T, Sontheimer H. Glutamate release by primary brain tumors induces epileptic activity. Nat Med. 2011;17:1269–1274. doi: 10.1038/nm.2453. [DOI] [PMC free article] [PubMed] [Google Scholar]
- Campbell SL, Buckingham SC, Sontheimer H. Human glioma cells induce hyperexcitability in cortical networks. Epilepsia. 2012;53:1360–1370. doi: 10.1111/j.1528-1167.2012.03557.x. [DOI] [PMC free article] [PubMed] [Google Scholar]
- Charles NA, Holland EC, Gilbertson R, Glass R, Kettenmann H. The brain tumor microenvironment. Glia. 2011;59:1169–1180. doi: 10.1002/glia.21136. [DOI] [PubMed] [Google Scholar]
- Chen DB, Davis JS. Epidermal growth factor induces c-fos and c-jun mRNA via Raf-1/MEK1/ERK-dependent and -independent pathways in bovine luteal cells. Mol Cell Endocrinol. 2003;200:141–154. doi: 10.1016/s0303-7207(02)00379-9. [DOI] [PubMed] [Google Scholar]
- Creighton CJ, Fu X, Hennessy BT, Casa AJ, Zhang Y, Gonzalez-Angulo AM, Lluch A, Gray JW, Brown PH, Hilsenbeck SG, et al. Proteomic and transcriptomic profiling reveals a link between the PI3K pathway and lower estrogen-receptor (ER) levels and activity in ER+ breast cancer. Breast Cancer Res. 2010;12:R40. doi: 10.1186/bcr2594. [DOI] [PMC free article] [PubMed] [Google Scholar]
- Cuddapah VA, Robel S, Watkins S, Sontheimer H. A neuro-centric perspective on glioma invasion. Nat Rev Neurosci. 2014;15:455–465. doi: 10.1038/nrn3765. [DOI] [PMC free article] [PubMed] [Google Scholar]
- Fan QW, Cheng C, Knight ZA, Haas-Kogan D, Stokoe D, James CD, McCormick F, Shokat KM, Weiss WA. EGFR signals to mTOR through PKC and independently of Akt in glioma. Sci Signal. 2009;2:ra4. doi: 10.1126/scisignal.2000014. [DOI] [PMC free article] [PubMed] [Google Scholar]
- Galvao RP, Kasina A, McNeill RS, Harbin JE, Foreman O, Verhaak RG, Nishiyama A, Miller CR, Zong H. Transformation of quiescent adult oligodendrocyte precursor cells into malignant glioma through a multistep reactivation process. Proc Natl Acad Sci USA. 2014;111:E4214–E4223. doi: 10.1073/pnas.1414389111. [DOI] [PMC free article] [PubMed] [Google Scholar]
- Geha S, Pallud J, Junier MP, Devaux B, Leonard N, Chassoux F, Chneiweiss H, Daumas-Duport C, Varlet P. NG2+/Olig2+ cells are the major cycle-related cell population of the adult human normal brain. Brain Pathol. 2010;20:399–411. doi: 10.1111/j.1750-3639.2009.00295.x. [DOI] [PMC free article] [PubMed] [Google Scholar]
- Gerlee P. The model muddle: in search of tumor growth laws. Cancer Res. 2013;73:2407–2411. doi: 10.1158/0008-5472.CAN-12-4355. [DOI] [PubMed] [Google Scholar]
- Gibson JR, Huber KM, Südhof TC. Neuroligin-2 deletion selectively decreases inhibitory synaptic transmission originating from fast-spiking but not from somatostatin-positive interneurons. J Neurosci. 2009;29:13883–13897. doi: 10.1523/JNEUROSCI.2457-09.2009. [DOI] [PMC free article] [PubMed] [Google Scholar]
- Gibson EM, Purger D, Mount CW, Goldstein AK, Lin GL, Wood LS, Inema I, Miller SE, Bieri G, Zuchero JB, et al. Neuronal activity promotes oligodendrogenesis and adaptive myelination in the mammalian brain. Science. 2014;344:1252304. doi: 10.1126/science.1252304. [DOI] [PMC free article] [PubMed] [Google Scholar]
- Gjørlund MD, Nielsen J, Pankratova S, Li S, Korshunova I, Bock E, Berezin V. Neuroligin-1 induces neurite outgrowth through interaction with neurexin-1β and activation of fibroblast growth factor receptor-1. FASEB J. 2012;26:4174–4186. doi: 10.1096/fj.11-202242. [DOI] [PubMed] [Google Scholar]
- Gkogkas CG, Khoutorsky A, Ran I, Rampakakis E, Nevarko T, Weatherill DB, Vasuta C, Yee S, Truitt M, Dallaire P, et al. Autism-related deficits via dysregulated eIF4E-dependent translational control. Nature. 2013;493:371–377. doi: 10.1038/nature11628. [DOI] [PMC free article] [PubMed] [Google Scholar]
- Glasgow SM, Zhu W, Stolt CC, Huang TW, Chen F, LoTurco JJ, Neul JL, Wegner M, Mohila C, Deneen B. Mutual antagonism between Sox10 and NFIA regulates diversification of glial lineages and glioma subtypes. Nat Neurosci. 2014;17:1322–1329. doi: 10.1038/nn.3790. [DOI] [PMC free article] [PubMed] [Google Scholar]
- Gonzales M, Bowden GT. The role of PI 3-kinase in the UVB-induced expression of c-fos. Oncogene. 2002;21:2721–2728. doi: 10.1038/sj.onc.1205366. [DOI] [PubMed] [Google Scholar]
- Greenberg ME, Ziff EB. Stimulation of 3T3 cells induces transcription of the c-fos proto-oncogene. Nature. 1984;311:433–438. doi: 10.1038/311433a0. [DOI] [PubMed] [Google Scholar]
- Ichtchenko K, Nguyen T, Südhof TC. Structures, alternative splicing, and neurexin binding of multiple neuroligins. J Biol Chem. 1996;271:2676–2682. doi: 10.1074/jbc.271.5.2676. [DOI] [PubMed] [Google Scholar]
- Ishiuchi S, Tsuzuki K, Yoshida Y, Yamada N, Hagimura N, Okado H, Miwa A, Kurihara H, Nakazato Y, Tamura M, et al. Blockage of Ca(2+)-permeable AMPA receptors suppresses migration and induces apoptosis in human glioblastoma cells. Nat Med. 2002;8:971–978. doi: 10.1038/nm746. [DOI] [PubMed] [Google Scholar]
- Ishiuchi S, Yoshida Y, Sugawara K, Aihara M, Ohtani T, Watanabe T, Saito N, Tsuzuki K, Okado H, Miwa A, et al. Ca2+-permeable AMPA receptors regulate growth of human glioblastoma via Akt activation. J Neurosci. 2007;27:7987–8001. doi: 10.1523/JNEUROSCI.2180-07.2007. [DOI] [PMC free article] [PubMed] [Google Scholar]
- Jamain S, Quach H, Betancur C, Råstam M, Colineaux C, Gillberg IC, Soderstrom H, Giros B, Leboyer M, Gillberg C, Bourgeron T Paris Autism Research International Sibpair Study. Mutations of the X-linked genes encoding neuroligins NLGN3 and NLGN4 are associated with autism. Nat Genet. 2003;34:27–29. doi: 10.1038/ng1136. [DOI] [PMC free article] [PubMed] [Google Scholar]
- Johannessen AL, Torp SH. The clinical value of Ki-67/MIB-1 labeling index in human astrocytomas. Pathol Oncol Res. 2006;12:143–147. doi: 10.1007/BF02893360. [DOI] [PubMed] [Google Scholar]
- Khuong-Quang DA, Buczkowicz P, Rakopoulos P, Liu XY, Fontebasso AM, Bouffet E, Bartels U, Albrecht S, Schwartzentruber J, Letourneau L, et al. K27M mutation in histone H3.3 defines clinically and biologically distinct subgroups of pediatric diffuse intrinsic pontine gliomas. Acta Neuropathol. 2012;124:439–447. doi: 10.1007/s00401-012-0998-0. [DOI] [PMC free article] [PubMed] [Google Scholar]
- Labrakakis C, Patt S, Hartmann J, Kettenmann H. Functional GABA(A) receptors on human glioma cells. Eur J Neurosci. 1998;10:231–238. doi: 10.1046/j.1460-9568.1998.00036.x. [DOI] [PubMed] [Google Scholar]
- Lee HK, Xiang C, Cazacu S, Finniss S, Kazimirsky G, Lemke N, Lehman NL, Rempel SA, Mikkelsen T, Brodie C. GRP78 is over-expressed in glioblastomas and regulates glioma cell growth and apoptosis. Neurooncol. 2008;10:236–243. doi: 10.1215/15228517-2008-006. [DOI] [PMC free article] [PubMed] [Google Scholar]
- Liu C, Sage JC, Miller MR, Verhaak RG, Hippenmeyer S, Vogel H, Foreman O, Bronson RT, Nishiyama A, Luo L, Zong H. Mosaic analysis with double markers reveals tumor cell of origin in glioma. Cell. 2011;146:209–221. doi: 10.1016/j.cell.2011.06.014. [DOI] [PMC free article] [PubMed] [Google Scholar]
- Magnon C, Hall SJ, Lin J, Xue X, Gerber L, Freedland SJ, Frenette PS. Autonomic nerve development contributes to prostate cancer progression. Science. 2013;341:1236361. doi: 10.1126/science.1236361. [DOI] [PubMed] [Google Scholar]
- Mehta S, Huillard E, Kesari S, Maire CL, Golebiowski D, Harrington EP, Alberta JA, Kane MF, Theisen M, Ligon KL, et al. The central nervous system-restricted transcription factor Olig2 opposes p53 responses to genotoxic damage in neural progenitors and malignant glioma. Cancer Cell. 2011;19:359–371. doi: 10.1016/j.ccr.2011.01.035. [DOI] [PMC free article] [PubMed] [Google Scholar]
- Monje M, Mitra SS, Freret ME, Raveh TB, Kim J, Masek M, Attema JL, Li G, Haddix T, Edwards MS, et al. Hedgehog-responsive candidate cell of origin for diffuse intrinsic pontine glioma. Proc Natl Acad Sci USA. 2011;108:4453–4458. doi: 10.1073/pnas.1101657108. [DOI] [PMC free article] [PubMed] [Google Scholar]
- Patel AP, Tirosh I, Trombetta JJ, Shalek AK, Gillespie SM, Wakimoto H, Cahill DP, Nahed BV, Curry WT, Martuza RL, et al. Single-cell RNA-seq highlights intratumoral heterogeneity in primary glioblastoma. Science. 2014;344:1396–1401. doi: 10.1126/science.1254257. [DOI] [PMC free article] [PubMed] [Google Scholar]
- Peixoto RT, Kunz PA, Kwon H, Mabb AM, Sabatini BL, Philpot BD, Ehlers MD. Transsynaptic signaling by activity-dependent cleavage of neuroligin-1. Neuron. 2012;76:396–409. doi: 10.1016/j.neuron.2012.07.006. [DOI] [PMC free article] [PubMed] [Google Scholar]
- Persson AI, Petritsch C, Swartling FJ, Itsara M, Sim FJ, Auvergne R, Goldenberg DD, Vandenberg SR, Nguyen KN, Yakovenko S, et al. Non-stem cell origin for oligodendroglioma. Cancer Cell. 2010;18:669–682. doi: 10.1016/j.ccr.2010.10.033. [DOI] [PMC free article] [PubMed] [Google Scholar]
- Pyonteck SM, Akkari L, Schuhmacher AJ, Bowman RL, Sevenich L, Quail DF, Olson OC, Quick ML, Huse JT, Teijeiro V, et al. CSF-1R inhibition alters macrophage polarization and blocks glioma progression. Nat Med. 2013;19:1264–1272. doi: 10.1038/nm.3337. [DOI] [PMC free article] [PubMed] [Google Scholar]
- Rothstein JD, Dykes-Hoberg M, Pardo CA, Bristol LA, Jin L, Kuncl RW, Kanai Y, Hediger MA, Wang Y, Schielke JP, Welty DF. Knockout of glutamate transporters reveals a major role for astroglial transport in excitotoxicity and clearance of glutamate. Neuron. 1996;16:675–686. doi: 10.1016/s0896-6273(00)80086-0. [DOI] [PubMed] [Google Scholar]
- Rothwell PE, Fuccillo MV, Maxeiner S, Hayton SJ, Gokce O, Lim BK, Fowler SC, Malenka RC, Südhof TC. Autism-associated neuroligin-3 mutations commonly impair striatal circuits to boost repetitive behaviors. Cell. 2014;158:198–212. doi: 10.1016/j.cell.2014.04.045. [DOI] [PMC free article] [PubMed] [Google Scholar]
- Samarelli AV, Riccitelli E, Bizzozero L, Silveira TN, Seano G, Pergolizzi M, Vitagliano G, Cascone I, Carpentier G, Bottos A, et al. Neuroligin 1 induces blood vessel maturation by cooperating with the α6 integrin. J Biol Chem. 2014;289:19466–19476. doi: 10.1074/jbc.M113.530972. [DOI] [PMC free article] [PubMed] [Google Scholar]
- Scherer HJ. Structural development in gliomas. Am J Cancer. 1938;34:333–351. [Google Scholar]
- Schwartzentruber J, Korshunov A, Liu XY, Jones DT, Pfaff E, Jacob K, Sturm D, Fontebasso AM, Quang DA, Tönjes M, et al. Driver mutations in histone H3.3 and chromatin remodelling genes in paediatric glioblastoma. Nature. 2012;482:226–231. doi: 10.1038/nature10833. [DOI] [PubMed] [Google Scholar]
- Seifert S, Sontheimer H. Bradykinin enhances invasion of malignant glioma into the brain parenchyma by inducing cells to undergo amoeboid migration. J Physiol. 2014;592:5109–5127. doi: 10.1113/jphysiol.2014.274498. [DOI] [PMC free article] [PubMed] [Google Scholar]
- Silver DJ, Siebzehnrubl FA, Schildts MJ, Yachnis AT, Smith GM, Smith AA, Scheffler B, Reynolds BA, Silver J, Steindler DA. Chondroitin sulfate proteoglycans potently inhibit invasion and serve as a central organizer of the brain tumor microenvironment. J Neurosci. 2013;33:15603–15617. doi: 10.1523/JNEUROSCI.3004-12.2013. [DOI] [PMC free article] [PubMed] [Google Scholar]
- Stopczynski RE, Normolle DP, Hartman DJ, Ying H, DeBerry JJ, Bielefeldt K, Rhim AD, DePinho RA, Albers KM, Davis BM. Neuroplastic changes occur early in the development of pancreatic ductal adenocarcinoma. Cancer Res. 2014;74:1718–1727. doi: 10.1158/0008-5472.CAN-13-2050. [DOI] [PMC free article] [PubMed] [Google Scholar]
- Sturm D, Witt H, Hovestadt V, Khuong-Quang DA, Jones DT, Konermann C, Pfaff E, Tönjes M, Sill M, Bender S, et al. Hotspot mutations in H3F3A and IDH1 define distinct epigenetic and biological subgroups of glioblastoma. Cancer Cell. 2012;22:425–437. doi: 10.1016/j.ccr.2012.08.024. [DOI] [PubMed] [Google Scholar]
- Südhof TC. Neuroligins and neurexins link synaptic function to cognitive disease. Nature. 2008;455:903–911. doi: 10.1038/nature07456. [DOI] [PMC free article] [PubMed] [Google Scholar]
- Sugiarto S, Persson AI, Munoz EG, Waldhuber M, Lamagna C, Andor N, Hanecker P, Ayers-Ringler J, Phillips J, Siu J, et al. Asymmetry-defective oligodendrocyte progenitors are glioma precursors. Cancer Cell. 2011;20:328–340. doi: 10.1016/j.ccr.2011.08.011. [DOI] [PMC free article] [PubMed] [Google Scholar]
- Suzuki K, Hayashi Y, Nakahara S, Kumazaki H, Prox J, Horiuchi K, Zeng M, Tanimura S, Nishiyama Y, Osawa S, et al. Activity-dependent proteolytic cleavage of neuroligin-1. Neuron. 2012;76:410–422. doi: 10.1016/j.neuron.2012.10.003. [DOI] [PubMed] [Google Scholar]
- Synowitz M, Ahmann P, Matyash M, Kuhn SA, Hofmann B, Zimmer C, Kirchhoff F, Kiwit JC, Kettenmann H. GABA(A)-receptor expression in glioma cells is triggered by contact with neuronal cells. Eur J Neurosci. 2001;14:1294–1302. doi: 10.1046/j.0953-816x.2001.01764.x. [DOI] [PubMed] [Google Scholar]
- Tabuchi K, Blundell J, Etherton MR, Hammer RE, Liu X, Powell CM, Südhof TC. A neuroligin-3 mutation implicated in autism increases inhibitory synaptic transmission in mice. Science. 2007;318:71–76. doi: 10.1126/science.1146221. [DOI] [PMC free article] [PubMed] [Google Scholar]
- Ullrich B, Ushkaryov YA, Südhof TC. Cartography of neurexins: more than 1000 isoforms generated by alternative splicing and expressed in distinct subsets of neurons. Neuron. 1995;14:497–507. doi: 10.1016/0896-6273(95)90306-2. [DOI] [PubMed] [Google Scholar]
- Varoqueaux F, Aramuni G, Rawson RL, Mohrmann R, Missler M, Gottmann K, Zhang W, Südhof TC, Brose N. Neuroligins determine synapse maturation and function. Neuron. 2006;51:741–754. doi: 10.1016/j.neuron.2006.09.003. [DOI] [PubMed] [Google Scholar]
- Verhaak RG, Hoadley KA, Purdom E, Wang V, Qi Y, Wilkerson MD, Miller CR, Ding L, Golub T, Mesirov JP, et al. Integrated genomic analysis identifies clinically relevant subtypes of glioblastoma characterized by abnormalities in PDGFRA, IDH1, EGFR, and NF1. Cancer Cell. 2010;17:98–110. doi: 10.1016/j.ccr.2009.12.020. [DOI] [PMC free article] [PubMed] [Google Scholar]
- Wang H, Peca J, Matsuzaki M, Matsuzaki K, Noguchi J, Qiu L, Wang D, Zhang F, Boyden E, Deisseroth K, et al. High-speed mapping of synaptic connectivity using photostimulation in Channelrhodopsin-2 transgenic mice. Proc Natl Acad Sci USA. 2007;104:8143–8148. doi: 10.1073/pnas.0700384104. [DOI] [PMC free article] [PubMed] [Google Scholar]
- Wang Y, Yang J, Zheng H, Tomasek GJ, Zhang P, McKeever PE, Lee EY, Zhu Y. Expression of mutant p53 proteins implicates a lineage relationship between neural stem cells and malignant astrocytic glioma in a murine model. Cancer Cell. 2009;15:514–526. doi: 10.1016/j.ccr.2009.04.001. [DOI] [PMC free article] [PubMed] [Google Scholar]
- Wu G, Broniscer A, McEachron TA, Lu C, Paugh BS, Becksfort J, Qu C, Ding L, Huether R, Parker M, et al. Somatic histone H3 alterations in pediatric diffuse intrinsic pontine gliomas and non-brainstem glioblastomas. Nat Genet. 2012;44:251–253. doi: 10.1038/ng.1102. [DOI] [PMC free article] [PubMed] [Google Scholar]
- Yizhar O, Fenno LE, Davidson TJ, Mogri M, Deisseroth K. Optogenetics in neural systems. Neuron. 2011;71:9–34. doi: 10.1016/j.neuron.2011.06.004. [DOI] [PubMed] [Google Scholar]
- Zhang Y, Chen K, Sloan SA, Bennett ML, Scholze AR, O’Keeffe S, Phatnani HP, Guarnieri P, Caneda C, Ruderisch N, et al. An RNA-sequencing transcriptome and splicing database of glia, neurons, and vascular cells of the cerebral cortex. J Neurosci. 2014;34:11929–11947. doi: 10.1523/JNEUROSCI.1860-14.2014. [DOI] [PMC free article] [PubMed] [Google Scholar]
- Zhao CM, Hayakwa Y, Kodama Y, Muthupalani S, Westphalen CB, Anderson GT, Flatberg A, Johannessen H, Friedman RA, Renz BW, et al. Denervation suppresses gastric tumorigenesis. Sci Transl Med. 2014;6:250ra115. doi: 10.1126/scitranslmed.3009569. [DOI] [PMC free article] [PubMed] [Google Scholar]
Associated Data
This section collects any data citations, data availability statements, or supplementary materials included in this article.