

Abstract
Background
Heart failure with preserved ejection fraction (HFpEF) accounts for approximately 50% of all cases of heart failure and currently has no effective treatment. Diastolic dysfunction underlies HFpEF; therefore, elucidation of the mechanisms that mediate relaxation can provide new potential targets for treatment. Cardiac myosin binding protein-C (cMyBP-C) is a thick filament protein that modulates cross-bridge cycling rates via alterations in its phosphorylation status. Thus, we hypothesize that phosphorylated cMyBP-C accelerates rate of cross-bridge detachment, thereby enhancing relaxation to mediate diastolic function.
Methods and Results
We compared mouse models expressing phosphorylation deficient cMyBP-C(S273A/S282A/S302A)-cMyBP-C(t3SA), phosphomimetic cMyBP-C(S273D/S282D/S302D)-cMyBP-C(t3SD), and WT-control cMyBP-C(tWT) to elucidate the functional effects of cMyBP-C phosphorylation. Decreased voluntary running distances, increased lung/body weight ratios, and increased brain natriuretic peptide (BNP) levels in cMyBP-C(t3SA) mice demonstrate that phosphorylation deficiency is associated with signs of heart failure. Echocardiography (ejection fraction, myocardial relaxation velocity) and pressure/volume measurements (−dP/dtmin, pressure decay time constant Tau-Glantz, passive filling stiffness) show that cMyBP-C phosphorylation enhances myocardial relaxation in cMyBP-C(t3SD) mice while deficient cMyBP-C phosphorylation causes diastolic dysfunction with preserved ejection fraction in cMyBP-C(t3SA) mice. Simultaneous force and [Ca2+]i measurements on intact papillary muscles show that enhancement of relaxation in cMyBP-C(t3SD) mice and impairment of relaxation in cMyBP-C(t3SA) mice are not due to altered [Ca2+]i handling, implicating that altered cross-bridge detachment rates mediate these changes in relaxation rates.
Conclusions
cMyBP-C phosphorylation enhances relaxation while deficient phosphorylation causes diastolic dysfunction and phenotypes resembling HFpEF. Thus, cMyBP-C is a potential target for treatment of HFpEF.
Keywords: cardiac myosin binding protein-C, diastole, heart failure, contractility, myocardium
Heart failure with preserved ejection fraction (HFpEF) is a growing public health concern. One in five Americans will develop heart failure (HF) in their lifetimes.1 An aging population will increase prevalence of HF in the U.S.1 In recent years, the survival of HF patients has improved, but as yet, this improvement has not extended to individuals with HFpEF.2 The prevalence of HFpEF has risen to about 50% of all HF cases and treatment options remain limited.2 Due to the combination of a rising prevalence, an aging population, and a dearth of treatments, there is urgent need for elucidating underlying mechanisms as an important step toward developing novel therapies for HFpEF. Diastolic dysfunction is believed to be the dominant cause of HFpEF3, i.e., mere diagnosis of mild diastolic dysfunction carries a greater than 8-fold increase in mortality over 5 years.4 This study presents evidence that phosphorylation of cardiac myosin binding protein-C (cMyBP-C) enhances the ability of the myocardium to relax (lusitropy); and therefore, targeting cMyBP-C phosphorylation has the potential for translation to a novel therapy for HFpEF.
cMyBP-C is a thick filament accessory protein that binds at 42-nm intervals within the C-zone of the A-band of the sarcomere.5, 6 cMyBP-C is readily phosphorylated by a host of kinases such as protein kinase A (PKA)7, PKC8, PKD9, calcium calmodulin kinase IIδ (CAMK2δ)10, glycogen synthase kinase 3β (GSK3β)11 and ribosomal S6 kinase (RSK6)12. Unphosphorylated cMyBP-C appears to repress both cross-bridge attachment and detachment.13–16 Upon phosphorylation, cMyBP-C releases its inhibitory effects to accelerate the rate of cross-bridge cycling14 to suggest that cMyBP-C phosphorylation may play an important role in mediating lusitropy. Furthermore, review of human heart failure and animal models also suggest that cMyBP-C may mediate diastolic function.17 However, the possibility that phosphorylation of cMyBP-C directly enhances whole heart lusitropy has not been established.
We hypothesized that phosphorylation of cMyBP-C enhances lusitropy. To test this idea, we created a cMyBP-C phosphomimetic cMyBP-C(t3SD) mouse and used existing mouse models expressing phosphorylatable wild-type cMyBP-C or phosphorylation-deficient mutant cMyBP-C(t3SA) to assess the effects of phosphorylation status on diastolic function. Our studies showed that phosphorylation of cMyBP-C enhanced lusitropy, while the absence of phosphorylation at the three PKA sites in the M-domain of cMyBP-C depressed lusitropy and gave rise to phenotypes associated with HFpEF.
Methods
Mouse Lines
All protocols for animal care and use were approved by the Institutional Animal Care and Use Committees (IACUC) at the Texas A&M University Health Science Center College of Medicine Temple campus and the University of Wisconsin School of Medicine and Public Health. Aspartic-acid for serine substitutions were made at the three known PKA sites (S273D, S282D, S302D) in the M-domain of cMyBP-C to mimic the negative charge of phosphorylation (Figure 1A). An N-terminal cMyc-tag was included for identification and the α-myosin heavy chain promoter was used to target expression to the heart. The t3SD transgene was expressed transgenically on the cMyBP-C(−/−) null background18 to generate the cMyBP-C(t3SD) mouse. The wild-type (WT) control cMyBP-C(tWT) mouse and the phosphorylation deficient cMyBP-C(t3SA) mouse were described previously.14 The protein expression levels of cMyBP-C in comparison to true WT were cMyBP-C(tWT), 72%; cMyBP-C(t3SA), 74%; and cMyBP-C(t3SD), 84%. We used mice at 3 months ± 2 weeks of age at a ratio of approximately 1:1 female to male, unless otherwise specified.
Figure 1. t3SD mutant cMyBP-C is appropriately incorporated when expressed in cMyBP-C(−/−) myofibrils.
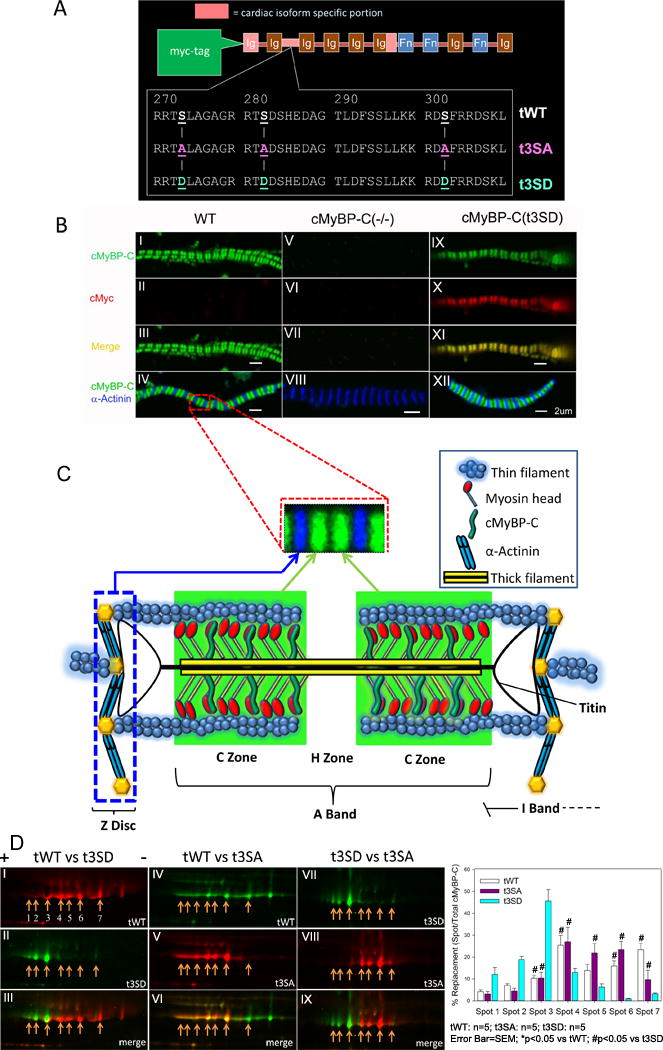
A. Different forms of transgenic cMyBP-C were expressed on the cMyBP-C(−/−) null background under control of the α-myosin heavy chain promoter. tWT contains normal PKA sites Ser273, Ser282 and Ser302 in the cardiac M-domain of cMyBP-C. The t3SA mutation introduces Ala for Ser substitutions at the same three PKA sites, while the t3SD mutation introduces Asp for Ser substitutions at the same sites. All transgenic proteins were engineered to contain an N-terminal cMyc-tag. B. Green indicates anti-cMyBP-C, red indicates anti-cMyc, blue shows anti-α-actinin, and yellow results from merging of anti-cMyBP-C and anti-cMyc. Left panels (I–IV) show WT myofibrils with green doublets that correspond to endogenous cMyBP-C (panels I and III) and blue lines (panel IV) corresponding to α-actinin located at the Z-discs. Thus, cMyBP-C appears as green doublets within the sarcomeres, which in turn are delineated by blue at the Z-discs. Middle panels (V–VIII) show cMyBP-C(−/−) myofibrils with only blue lines (panel VIII) corresponding to α-actinin binding at the Z-discs. Right panels (IX-XII) show cMyBP-C(t3SD) myofibrils with green doublets (panel IX) indicating cMyBP-C and red doublets (panel X) indicating c-Myc labeled transgenic proteins in the same labeling pattern pattern. Yellow (panel XI) signifies that the cMyBP-C and cMyc doublets overlap, showing that our transgenic protein is appropriately positioned in the sarcomere. Panel XII shows that green doublets corresponding to cMyBP-C lay between the blue α-actinin bands located in the Z-discs. C. WT myofibril image section was enlarged to show a single sarcomere delineated by Z-disks and cMyBP-C appearing as green doublets that are localized to the C-zone of the A-band and the empty H-zone in the middle. Due to the inability of our 63× oil objective to resolve the cMyBP-C transverse bands that are separated by intervals of 42 nm along the thick filaments, the cMyBP-C bands6 on either side of H-zone sarcomere appear as a green doublet. Correct incorporation of phosphorylation deficient cMyBP-Ct3SA protein has been demonstrated in a prior publication.14 D. 2-dimensional differential gel electrophoresis (2D-DIGE). (+) is the positive terminal to which more negative (i.e., acidic isoelectric point with low pI) proteins migrate. (−) is the negative terminal toward which more positive proteins travel. Left panels (I–III): cMyBP-C(tWT) is labeled with Cy5-red (panel I) along with seven spots that were quantified. cMyBP-C(t3SD) is labeled with Cy3-green (panel II). The merged images (panel III) show that cMyBP-C(t3SD) spots migrated to more negative pI, consistent with the introduction of Ser to Asp mutations. Middle panels (IV–VI): cMyBP-C(tWT) is labeled with Cy3-green (panel IV) and cMyBP-C(t3SA) is labeled with Cy5-red (panel V). The cMyBP-C(t3SA) spots migrated to a more neutral pI with respect to cMyBP-C(tWT), as demonstrated in the merged image (panel VI). Right panels (VII–IX): cMyBP-C(t3SD) is labeled with Cy3-green while cMyBP-C(t3SA) is labeled with Cy5-red. The merged image showed that cMyBP-C(t3SD) spots had a much more negative distribution, i.e., there was little overlap with cMyBP-C(t3SA) spots. The accompanying bar graph shows the quantified intensities of each spot in hearts from the three mouse models.
Immunofluorescence
Immunofluorescent labeling of myofibrils was used to verify incorporation of transgenic cMyBP-C(t3SD) protein into sarcomeres, using a protocol modified from a previous study.14 Rabbit polyclonal anti-cMyBP-C antibody18 at 1:250 dilution was paired with Alexa-Fluor488® (Life Technologies) goat anti-rabbit secondary antibody at 1:250 dilution. Mouse monoclonal anti-cMyc (Clone 9E10, EMD Millipore) at 1:25 dilution was paired with Alexa-Fluor543® (Life Technologies) goat anti-mouse secondary antibody at 1:250 dilution. Goat polyclonal anti-α-actinin (Santa Cruz Biotechnology) at 1:25 dilution was paired with Alexa-Fluor647® (Life Technologies) donkey anti-goat secondary antibody at 1:250 dilution. A Leica SP2 confocal microscope with 63× oil immersion objective was used for imaging. Lasers with wavelengths of 488 nm, 543 nm, and 633 nm were used to excite the fluorescent secondary antibodies to image cMyBP-C, cMyc (transgenic protein tag), and α-actinin (Z-disc).
Two-Dimensional Differential in-Gel Electrophoresis (2D-DIGE)
2D-DIGE was used to determine the isoelectric migration patterns of contractile proteins from all lines (tWT, t3SA and t3SD) using a protocol described previously.19, 20 Cardiac myofibrils were prepared from left ventricular tissue and re-suspended in UTC buffer (8 mol/L urea, 2 mol/L thiourea and 4% CHAPS). An RC-DC assay (Bio-Rad) was performed to determine protein concentrations in each of the samples. Following 2-D clean up (GE Healthcare 2-D Clean-Up Kit), a total of 100 μg of protein was labeled with 100 ρmol of Cy2, Cy3, or Cy5 (GE Healthcare)/50 μg protein, according to methods described previously.21, 22 The internal control was prepared by labeling each sample equally with Cy2 to facilitate gel-to-gel comparisons. Equal amounts of Cy2, Cy3 and Cy5-labeled protein were loaded onto either 24 cm, pH 3–11 or 18cm, pH 4–7 or 18cm, pH 7–11 immobilized pH gradient (IPG) strips (GE Healthcare) and focused in a Bio-Rad Protean IEF cell. To separate cMyBP-C spots, 24cm, pH 3–11 strips were used.23 The focused pH 4–7 and pH 7–11 strips were used to separate myosin light chain 2(MLC2)21 and cardiac troponin I (cTnI)24 spots, respectively. Focused IPG strips were then subjected to electrophoresis in 12% SDS polyacrylamide gels.25 Gels were imaged with a Typhoon 9410 Imager (GE Healthcare). Images were analyzed using PDQuest 8.0 Advanced software (BioRad).
Measurement of Physiologic Parameters
Voluntary running was used to compare overall physiological impact of cMyBP-C phosphorylation status. Mice at 6-weeks of age were singly housed with a low profile running wheel (Med-Associates ENV-044-01, DIG-804) for 6 weeks. A wireless hub continuously recorded the number of revolutions from all running wheels with 30 second time resolution. Running wheels were checked for malfunction twice per week.
Animals were sacrificed and heart weight/body weight and lung weight/body weight ratios were measured as indicators of cardiac hypertrophy and pulmonary edema, respectively. Brain natriuretic peptide (BNP) mRNA levels were measured in myocardial samples as a biochemical indicator of heart failure. We quantified BNP mRNA levels in hearts of all three lines of mice. Mice were anesthetized using 4% inhaled isoflurane and hearts were quickly removed and frozen rapidly in liquid nitrogen. Total RNA was isolated using TRIzol Reagent (Life Technologies) and first strand cDNA was synthesized using the RT2 First Strand kit (QIAGEN). Real-time PCR was performed using an Agilent Mx3005P qPCR system (Agilent Technologies) with RT2 SYBR Green ROX qPCR Master Mix (QIAGEN). Cycle threshold value was obtained to calculate the relative expression levels of BNP and GAPDH (used as internal control) in each sample using Mx Pro QPCR software (Agilent Technologies). The gene-specific primers for amplifying BNP (primer PPM04558A) and GAPDH (primer PPM02946E) were obtained from QIAGEN.
Echocardiography
A VisualSonics Vevo 2100 system (FUJIFILM VisualSonics Inc.) with a probe providing 30 micrometer spatial resolution was used to assess in vivo cardiac structure and function. Unlike the older Vevo 770 system, the Vevo 2100 system has time resolution that allows imaging of the beating mouse heart in real time. Real-time measurements with the Vevo 2100 produce absolute measurement values that differ from the older Vevo 770, which relied on electrocardiogram (ECG) gating to guide reconstruction of heart from slices that were imaged at different points in time. Therefore, absolute numbers from the present study are not directly comparable to those from previous studies.14
Mice were anesthetized with 0.5–2% isoflurane, the ECG was monitored continuously in real time, and isoflurane was adjusted to keep heart rate at 380–440 beats per minute (BPM). The echo-table temperature was controlled at 39°C. Two-dimensional imaging, blood flow Doppler, tissue Doppler, and M-Mode measurements were done. All mice recovered from the procedure without signs of distress.
Pressure-Volume (PV) Measurements
Intra-ventricular pressure and volume were measured with 1.2F Scisense Pressure-volume (P-V) admittance catheters (Transonic Systems Inc.). Anesthesia was induced with 4% isoflurane, which was reduced to 1% after a surgical plane of anesthesia was achieved. Through a midline cervical incision, the right carotid artery was identified, isolated, and then cannulated to insert the 1.2F PV loop catheter. Left ventricular pressure and volume were recorded using the iWorx IX/228S Data Acquisition System (Transonic Systems Inc.) with a Scisense Advantage PV control unit version 5.0. Left ventricular stiffness is calculated by , where p(v) is the end-diastolic pressure and (v) is the end-diastolic volume. (A) is a curve fitting constant26 corresponding to the slow gentle rise portion of the curve. (Stiffness) is the stiffness constant26 of the ventricle corresponding to the approximately exponential-rise portion of the curve. Pressure offset is calculated (poffset) to quantify a shift in the position of the end diastolic pressure-volume relationship with or without an accompanying change in the steepness of the relationship, which also includes an instrumentation offset.
Force/Calcium Measurements on Intact Papillary Muscle
Simultaneous intracellular calcium [Ca2+]i and force measurements were performed on intact papillary muscles to determine whether variations in Ca2+ re-uptake accounted for possible differences in relaxation among the three mouse models. We modified an earlier protocol27 for this purpose. Right ventricular papillary muscles were carefully isolated and mounted into the apparatus. Force transducer (Aurora Scientific) measured the force. Hyper-switch system (IonOptix LLC) measured intracellular Fura-2AM (TEFLabs) fluorescence as the indicator of [Ca2+]i. Pacing frequency was increased (1 to 2.5 Hz) to simulate increasing heart rate. Papillary muscles were continuously superfused at room temperature to avoid the rapid extrusion of Fura-2AM that occurs at higher temperatures.27 Recordings of fluorescence at 510 nm from calcium-bound Fura-2AM (FCa; 340 nm excitation) and calcium-free Fura-2AM (Ffree; 380 nm excitation) were obtained. [Ca2+]i was estimated based on the FCa/Ffree ratio after correcting for background and sequestered Ca2+. Measurements were obtained at the length that yielded maximum twitch force for each muscle. Trains of greater than 30 contractions were averaged to produce traces that were subsequently used for data analysis.
Interpretation of Key Measurements
Echocardiographic tissue Doppler measurements of peak myocardial relaxation velocity in early diastole (Ea) correspond to the peak rate of pressure decay (−dP/dt)min28. Similarly, tissue Doppler of peak myocardial contraction velocity in systole (Sa) corresponds to peak rate of pressure increase (+dP/dt)max.29 Since pressure is a function of force, (−dF/dt)min and (+dF/dt)max in intact papillary muscles would correspond to intra-ventricular (−dP/dt)min and (+dP/dt)max, respectively. These relationships then allow one to relate intact papillary function to intact in vivo cardiac function by [dFR=(−dF/dt)min/(+dF/dt)max] ≈ dPR=(−dP/dt)min/(+dP/dt)max] ≈ Ea/Sa. Increased E/Ea is a reliable echocardiographic indicator of diastolic dysfunction because it captures both increasing left atrial pressure (i.e., increasing pressure will increase blood inflow velocity E across the mitral valve) and the decreased ability of the myocardium to relax (i.e., decreased Ea).3, 30–32 Tau-Glantz is a pressure decay time constant obtained from intra-cardiac pressure measurements, with a smaller number indicating faster relaxation.33 dFR normalizes peak relaxation to peak contraction to allow comparison of intrinsic lusitropy of papillary muscles across different geometries and different peak rates of force development. Furthermore, increases in dFR indicate acceleration of relaxation because increases in peak rate of relaxation must exceed peak rate of force development for this to occur.
Statistical Analysis
Statistical analyses were done with a combination of SPSS and R statistical analyses software with significance set at p<0.05. A histogram appearing to fit a normal distribution and a yielding a non-significant Shapiro-Wilkes test qualified a data set as being normal. Normally distributed data sets were analyzed with an ANOVA post-hoc Tukey test, since there were at least 3 groups in each comparison. Repeated measurements such as responses to increased pacing frequency within the same group were tested with repeated measures ANOVA.
Data sets that did not qualify as normal were analyzed using exact tests. For groups>2, the Kruskal Wallis test was used to show the presence of a group with a significantly different distribution from the others. Afterwards, a Mann-Whitney test with the Holm-Bonferroni adjustment for multiple comparisons was used to identify which group(s) differed from the others. For repeated measurements within the same group, Friedman’s 2-way analysis of variance by rank was used to detect differences in distributions. For all analyses, the use of either a parametric test or an exact test did not impact the conclusions.
Whenever possible, box plots were used to display the data with the values of the box-bottom at the 25th percentile, the median line within the box, and the box-top at the 75th percentile; the bottom-whisker at the 10th percentile, and the top-whisker at the 90th percentile.
Results
Immunofluorescence and 2D-DIGE experiments showed that phosphorylation mimetic cMyBP-C(t3SD) protein was properly incorporated and electrically charged, and had no effect on the post-translational modification of other myofilament proteins
Immunofluorescent triple labeling of cMyBP-C, α−actinin (Z-disk), and cMyc (transgenic protein label) demonstrated that cMyBP-C(t3SD) protein was appropriately incorporated and properly positioned within the myofibril (Figure 1B–1C). The proper incorporation of cMyBP-C(t3SA) protein was verified in a previous study.14 The t3SD mutations, which caused cMyBP-C to be more negatively charged, redistributed the 2D-DIGE cMyBP-C spots to more acidic regions (i.e., nearer the positive pole, Figure 1D). The t3SA mutations, which caused the protein to be more neutrally charged, redistributed the 2D-DIGE cMyBP-C spots to more neutral regions (i.e., nearer the center, Figure 1D). 2D-DIGE analyses showed similar distributions of spots for cardiac troponin-I (cTnI), cardiac troponin-T4 (cTnT4), cardiac tropomyosin (cTm), and myosin light chain-2 (MLC2) for all three mouse lines (Figures S1–S2); therefore, the cMyBP-C mutations did not change the post-translational modification of these proteins. Furthermore, all three mouse lines exhibited similar levels of titin phosphorylation (Figure S3).
Phosphorylation-deficient cMyBP-C(t3SA) mouse, but not the phosphomimetic cMyBP-C(t3SD) mouse showed signs of heart failure
After an acclimatization period of 4 weeks, we found that cMyBP-C(tWT) and cMyBP-C(t3SD) mice ran voluntarily up to ~12km/day (Figure 2A). cMyBP-C(t3SA) mice exhibited shorter running distances of ~5km/day (Figure 2A). The shorter running distances for cMyBP-C (t3SA) mice suggest that lack of cMyBP-C phosphorylation leads to a loss of cardiac reserve, which is often seen in heart failure. Normal running distances in cMyBP-C(t3SD) mice suggest that constitutively phosphorylated cMyBP-C either have normal cardiac reserve or cardiac function was sufficiently high at baseline that running did not exceed the capability of the heart to deliver adequate blood flow. cMyBP-C(t3SA) mice had increased heart weight to body weight ratios (HW/BW) (Figure 2B), an indicator of cardiac hypertrophy, and increased lung weight to body weight ratio (LW/BW), an indicator of pulmonary edema suggesting the presence of heart failure (Figure 2C). cMyBP-C(t3SD) mice showed HW/BW and LW/BW ratios similar to MyBPC(tWT) mice (Figure 2B and 2C), indicating that the phosphomimetic cMyBP-C(t3SD) mouse does not exhibit heart failure. cMyBP-C(t3SD) mice showed similar levels of brain natriuretic peptide (BNP) when compared to MyBPC(tWT) controls (Figure 2D). In contrast, BNP levels were elevated in cMyBP-C(t3SA) mice (Figure 2D). In summary, shorter running distances, increased heart/body weight ratio, presence of pulmonary edema, and elevated BNP combined to strongly suggest that cMyBP-C(t3SA) mice are in heart failure.
Figure 2. Non-phosphorylatable cMyBP-C(t3SA) mouse exhibited signs of heart failure.
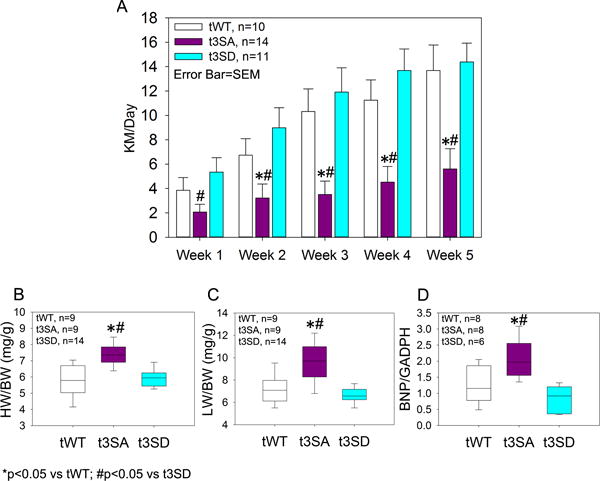
A. Singly caged mice voluntarily ran on wheels that continuously logged rotations via a wireless hub. The cMyBP-C(t3SA) mice ran shorter distances. cMyBP-C(tWT) and cMyBP-C(t3SD) mice ran longer and similar distances. All mouse lines demonstrated increasing running distances vs. week-1 using Friedman’s analysis of variance by rank with Holm-Bonferroni adjustment for multiple comparisons; however, cMyBP-C(t3SA) mice took longer to increase running distances. cMyBP-C(tWT) and cMyBP-C(t3D) running distances showed positive correlation with weeks by Spearman’s correlation. B. cMyBP-C(t3SA) mice exhibited increased heart weight to body weight (HW/BW) ratios suggesting the presence of hypertrophy. C. cMyBP-C(t3SA) mice had increased lung weight to body weight (LW/BW) ratios suggesting pulmonary edema. D. Brain Natriuretic Peptide (BNP) mRNA levels were used as a marker for heart failure. cMyBP-C(t3SA) mice exhibited significantly increased levels of BNP.
Echocardiography showed that cMyBP-C phosphorylation is a significant determinant of diastolic function
Echocardiography was performed on mice at an average age of 3–4 months to quantify in vivo function which was done at similar heart rates in all three lines. All three mouse lines exhibited left ventricular ejection fraction (LVEF) of greater than 50% (Figure 3). cMyBP-C(t3SA) hearts showed prominently increased LV posterior wall thickness (PWTd), mildly decreased LVEF that was still >50%, and mildly increased LV internal diameter during diastole (LVIDd) (Figure 3). cMyBP-C(t3SA) hearts exhibited depressed lusitropy evidenced by slower peak myocardial relaxation velocity (Ea) at the mitral valve annulus (Figure 3B, 3H, supplementary videos) and increased isovolumetric relaxation time (IVRT) (Figure 3F), indicating impaired relaxation. Conversely, cMyBP-C(t3SD) hearts showed markedly faster Ea. Since faster Ea corresponds to faster peak rates of LV pressure decay (−dP/dt)min and a shorter pressure decay time constant during diastole28, we conclude that cMyBP-C(t3SD) hearts exhibited enhanced lusitropy when compared to cMyBP-C(t3SA) and cMyBP-C(tWT) models (Figure 3B, 3H, supplementary videos). The ratio of peak blood inflow velocity across the mitral valve during early diastole (E) to peak myocardial relaxation velocity (Ea) at the mitral valve annulus (E/Ea) was used to evaluate diastolic dysfunction.4, 28, 31, 32 The E/Ea ratios in cMyBP-C(t3SA) hearts were significantly higher than in cMyBP-C(tWT) hearts, which is evidence of diastolic dysfunction.4, 30–32 In contrast, cMyBP-C(t3SD) hearts exhibited decreased E/Ea ratios, demonstrating enhanced diastolic function (Figure 3J). The ratio of peak relaxation to peak contraction velocities (Ea/Sa) was used as another measure of diastolic dysfunction as these variables correspond to the rates of pressure change (−dP/dt)min28 and (+dP/dt)max29, respectively. cMyBP-C(t3SD) hearts showed the highest Ea/Sa ratio and cMyBP-C(t3SA) hearts showed the lowest Ea/Sa ratio when all models are compared (Figure 3I), further confirming enhanced diastolic function in the cMyBP-C(t3SD) mouse and depressed diastolic dysfunction in the cMyBP-C(t3SA) mouse. Thus, the cMyBP-C(t3SD) mouse consistently demonstrated enhanced diastolic function while cardiac function in cMyBP-C(t3SA) mice resembled HFpEF.
Figure 3. Echocardiography.
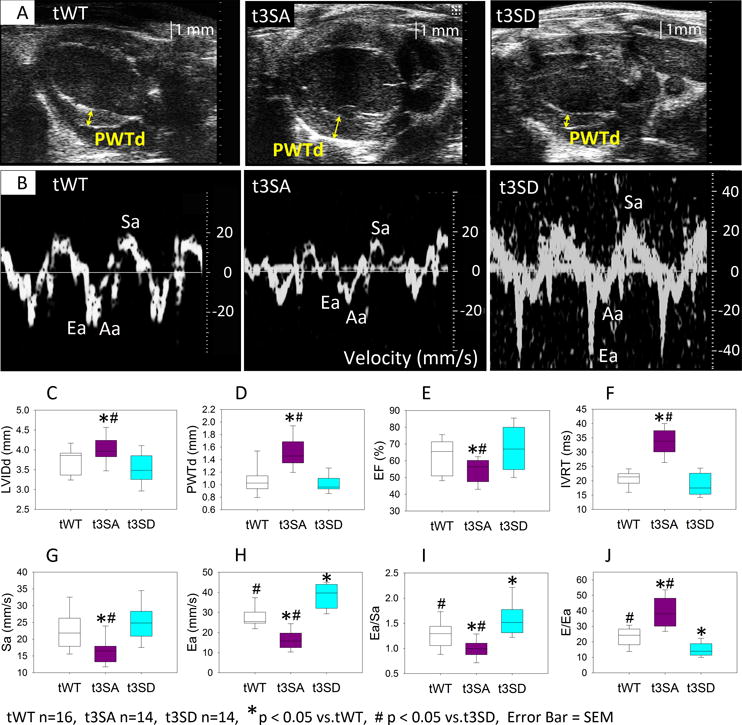
Echocardiographic exams were performed at similar heart rates (tWT: 420±9, n=16; t3SA: 428±8, n=14; t3SD: 420±8, n=14; in beats per minute) on mice of similar age of 3–4 months. A. Para-sternal long-axis echos showed that cMyBP-C(t3SA) hearts had increased left ventricular (LV) posterior wall thickness during diastole (PWTd). B. Tissue Doppler measurements showed that cMyBP-C(t3SD) myocardium relaxes at a much faster velocity (Ea) during early diastole. C. cMyBP-C(t3SA) hearts slightly larger LVIDd. D. cMyBP-C(t3SA) hearts exhibited thicker PWTd. E. cMyBP-C(t3SA) hearts has mildly reduced LVEF. F. cMyBP-C(t3SA) hearts had longer isovolumetric relaxation times (IVRT). G. cMyBP-C(t3SA) hearts had slower peak myocardial contraction velocities (Sa) during systole. H. cMyBP-C(t3SD) hearts exhibited faster myocardial relaxation velocity (Ea) than all others. I. The cMyBP-C(t3SD) hearts had greater Ea/Sa ratios than all others. J. cMyBP-C(t3SD) hearts demonstrated enhanced diastolic function which was evident in having the lowest the E/Ea ratio compared to all others, where E is the peak blood inflow velocity across the mitral valve during early diastole.
Additional echocardiography exams were performed on mice at an average age of 12–13 months at similar heart rates to document possible effects of age on the results. Unlike the results at 3–4 months of age, all lines showed similar LVIDd and similar LVEF. In comparison to other two lines, the cMyBP-C(t3SA) hearts from older mice exhibited thickened left ventricular walls, slower myocardial relaxation velocity in early diastole (Ea), and the smallest Ea/Sa ratio to indicate diastolic dysfunction. The cMyBP-C(t3SD) hearts showed fastest Ea, and smallest E/Ea ratio to indicate enhanced diastolic function. However cMyBP-C(t3SD) now exhibits fastest Sa. Older cMyBP-C(t3SA) hearts showing similar LVIDd and LVEF as other lines reinforced the notion that cardiac function with phosphorylation-deficient cMyBP-C resembles HFpEF. Furthermore, the cMyBP-C(t3SD) results demonstrated that cMyBP-C phosphorylation-dependent enhancement of diastolic function is preserved with aging. See Figure S4 for details.
Systolic blood pressure measurements are similar between mouse lines
Systolic blood pressures were measure by tail cuffs on restrained conscious mice at similar ages of 75–82 days. All lines exhibited similar peak systolic blood pressures. The values in mmHg were: cMyBPC(tWT), 103.0 ± 2.5, n=5; cMyBP-C(t3SA), 108.8 ± 2.3, n=6; cMyBP-C(t3SD), 102.6 ± 2.5, n=5. Thus, the differences in diastolic function cannot be explained on the basis of differences in systolic blood pressure.
In-situ intra-cardiac measurements show that myocardial relaxation rates are related to cMyBP-C phosphorylation
Phosphomimetic cMyBP-C(t3SD) hearts showed the fastest rate of pressure decay, (−dP/dt)min, while cMyBP-C(t3SA) hearts showed the slowest (−dP/dt)min (Figure 4A–C, 4E). Since all mouse lines exhibited similar peak rates of pressure generation (+dP/dt)max, the enhanced relaxation in the cMyBP-C(t3SD) hearts cannot be explained as a simple consequence of faster cross-bridge cycling rate (Figures 4A–C, 4D). The derivative pressure ratio (dPR) = (−dP/dt)min/(+dP/dt)max provides a means for comparing lusitropy because it indexes the heart’s ability to relax to its maximum rate of pressure development. Comparison of dPRs yielded the following hierarchy: cMyBP-C(t3SD) > cMyBP-C(tWT) > cMyBP-C(t3SA); therefore, lusitropy as indicated by dPR is related to cMyBP-C phosphorylation status. Since (dP/dt)min and (dP/dt)max relate to Ea and Sa, respectively, these pressure measurements strongly confirm the echocardiographic findings. The Tau-Glantz method was used to estimate the pressure decay time constant because this method uses change rates for calculation as a means to avoid equipment-related confounding pressure offset differences.33 cMyBP-C(t3SD) hearts showed the smallest Tau-Glantz, while cMyBP-C(t3SA) showed the largest Tau-Glantz; therefore, comparison of time constants of pressure decay also showed that lusitropy is related to cMyBP-C phosphorylation status (Figure 4G). A diastolic pressure-volume stiffness constant was calculated in order to compare passive filling26 among the mouse models studied. This analysis resulted in a hierarchy of stiffness constants: cMyBP-C(t3SD) < cMyBP-C(tWT) < cMyBP-C(t3SA). Thus, diastolic passive filling stiffness is inversely related to cMyBP-C phosphorylation status (Figure 4H–I). In summary, (−dP/dt)min, dPR, Tau-Glantz, and stiffness constant all showed that the rate of myocardial relaxation increases with level of cMyBP-C phosphorylation, while diastolic stiffness decreases with increasing phosphorylation.
Figure 4. Pressure-Volume measurements.
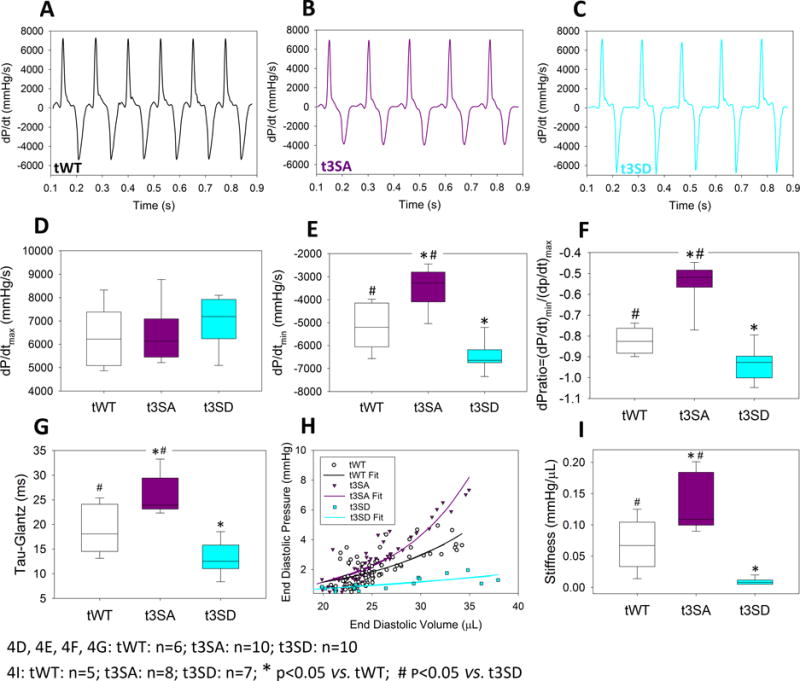
Intra-cardiac pressure and volume measurements were performed at similar heart rates (tWT: 413±21, n=6; t3SA: 400±12, n=10; t3SD: 420±12, n=10; in beats per minute) on mice of similar age of 3–4 months. A–C. At similar dP/dtmax, cMyBP-C(t3SD) hearts had the greatest peak rate of pressure decrease dP/dtmin while cMyBP-C(t3SA) hearts had the slowest rate of pressure decrease. D. All hearts show similar dP/dtmax. E. cMyBP-C(t3SD) hearts exhibited the largest values of dP/dtmin, while cMyBP-C(t3SA) hearts exhibited the smallest values of dP/dtmin. F. cMyBP-C(t3SD) hearts exhibited the greatest derivative pressure ratios, i.e., dPR=(−dP/dt)min/(+dP/dt)max, while cMyBP-C(t3SA) hearts showed the smallest dPR. G. cMyBP-C(t3SD) hearts demonstrated the smallest (i.e., fastest) pressure relaxation time constant Tau-Glantz calculated by . H. Venous occlusion revealed that cMyBP-C(t3SA) hearts exhibited the greatest increase in diastolic pressure with increasing end diastolic volume. I. cMyBP-C(t3SD) hearts demonstrated the smallest stiffness constant, while cMyBP-C(t3SA) hearts showed the largest stiffness constant.
Phosphomimetic cMyBP-C(t3SD) papillary muscles exhibit enhanced relaxation independent of [Ca2+]i decay kinetics
cMyBP-C(tWT) and cMyBP-C(t3SD) papillary muscles exhibited frequency dependent acceleration of relaxation that was absent in the phosphorylation-deficient cMyBP-C(t3SA) model. We used the derivative force ratio (dFR)=(−dF/dt)min/(+dF/dt)max17 to assess the effect of increasing pacing frequency in all three mouse models. Increased pacing frequency accelerated relaxation, which is manifested as increasing dFR in cMyBP-C(tWT) (Figure 5A and 5G) and cMyBP-C(t3SD) (Figure 5C and 5G) myocardium, but this was not the case in cMyBP-C(t3SA) muscle (Figure 5B, 5G). Moreover, cMyBP-C(t3SD) myocardium consistently exhibited greater dFRs than cMyBP-C(tWT), signifying enhanced relaxation (Figure 5A, 5C, and 5G).
Figure 5. cMyBP-C phosphomimetic (t3SD) enhances myocardial relaxation independent of [Ca2+]i transient kinetics.
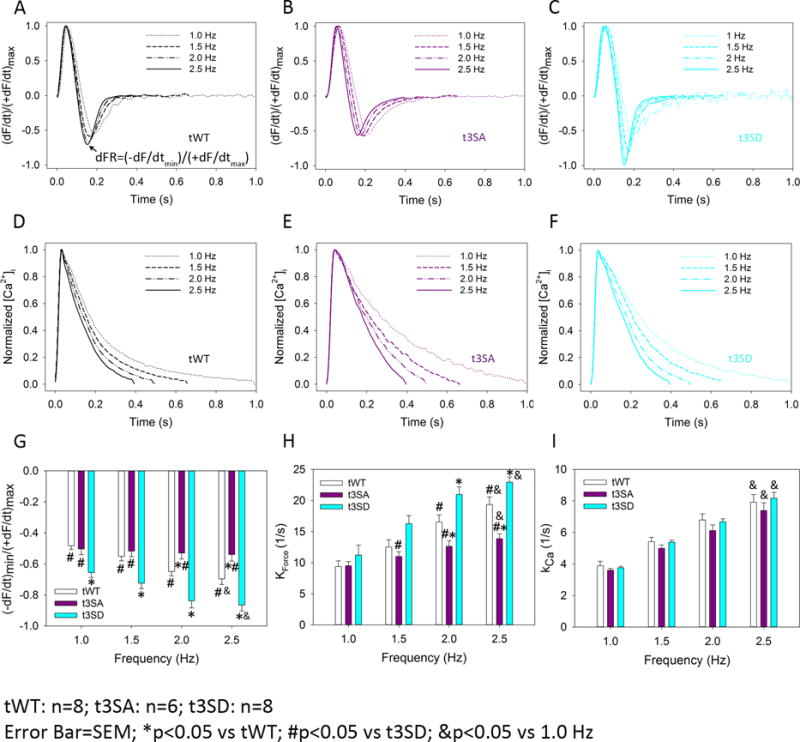
Force and [Ca2+]i were measured simultaneously in intact papillary muscles from all mouse models as a function of increasing pacing frequency (1–2.5 Hz). A. cMyBP-C(tWT) papillary muscles exhibited acceleration of relaxation in response to increased pacing frequency, which is evident as an increase in the steepness of the peak rate of relaxation with respect to maximum rate of force development, quantified as the derivative force ratio dFR=(−dF/dt)min/(+dF/dt)max. B. cMyBP-C(t3SA) papillary muscles exhibited a loss of frequency-dependent acceleration of relaxation (i.e., dFR did not change with increasing pacing frequency). C. cMyBP-C(t3SD) muscles showed increased acceleration of relaxation (relative to cMyBP-C(tWT) muscles) in response to increased pacing frequency (i.e., a greater dFR). D–F. Normalized [Ca2+]i traces demonstrate that increasing pacing frequency shortened [Ca2+]i decay times similarly in all mouse models. G. Increased pacing frequency causes acceleration of relaxation, evident as increased dFR in cMyBP-C(tWT) and cMyBP-C(t3SD), but not in cMyBP-C(t3SA) muscles. cMyBP-C(t3SD) muscles showed increased dFR in comparison to cMyBP-C(tWT), demonstrating enhanced relaxation. H. cMyBP-C(t3SD) papillary muscles showed greater force decay constant kforce to indicate faster relaxation rates at higher pacing frequencies in comparison to cMyBP-C(t3SA) starting at 1.5 Hz and then cMyBP-C(tWT) starting at 2 Hz; kforce was calculated as a single negative exponential from normalized force decay traces. I. Increasing pacing frequency caused similar increases in the [Ca2+]i decay constant kCa in all mouse models; kCa was calculated as a single negative exponential from ormalized [Ca2+]i decay traces.
cMyBP-C(t3SD) papillary muscles also showed faster rate of relaxation as evidenced by greater rate constant of force decay (kforce). cMyBP-C(t3SD) exhibited greater kforce in comparison to cMyBP-C(t3SA) starting at 1.5 Hz. cMyBP-C(t3SD) exhibited greater kforce in comparison to cMyBP-C(tWT) starting at 2 Hz. (Figure 5H for summary and Figure S5 for real-time examples).
Meanwhile, increased pacing frequency induced similar reductions in the [Ca2+]i decay times in all three models, which translated to faster rate constants of [Ca2+]i decay (kCa) (Figure 5D–F, 5H). Since all three mouse models showed similar increases in the kCa with increased pacing frequency (Figure 5I), the different relaxation kinetics in the three mouse lines were not due to differences in the [Ca2+]i decay kinetics. These results suggest that the enhanced lusitropy (e.g., greater dFR and faster kforce) in the phosphomimetic cMyBP-C mouse is due to speeding of cross-bridge cycling kinetics, specifically cross-bridge detachment rates, and not alterations in the kinetics of the [Ca2+]i transients.
Experiments on skinned myocardium in our previous study yielded similar tension-pCa relationships in cMyBP-C(tWT) and cMyBP-C(t3SA) myocardium.14 Skinned myocardium studies in the current work also showed that cMyBP-C(tWT) and cMyBP-C(t3SD) have similar tension-pCa relationships (See Figure S6). Consequently, differences in relaxation kinetics cannot be explained by differences in calcium sensitivity.
CaMK2δ and PKA can phosphorylate cMyBP-C and calcium handling proteins. Thus, expression and phosphorylation status of these kinases were examined by Western blotting. Expression and phosphorylation levels of these kinases appear to be similar across all the mouse lines, which suggest that kinase activities do not differ between lines (see Figure S7). Thus, differences in cardiac function cannot be attributed to differences in CaMK2δ or PKA activity.
All mouse models showed similarly negligible levels of fibrosis
A study was performed to determine whether differences in tissue fibrosis contributed to the observed differences in diastolic function in the three mouse lines. The study involved semi-automated image analyses using ImageJ software on trichrome stained heart sections. Each heart was examined in 3 full sections that were further subdivided into 48–68 regions including the apex, left ventricular free wall, interventricular septum, and right ventricle free wall. All mouse lines exhibited less than 0.2% fibrosis (tWT 0.096±0.041%, t3SA 0.037±0.018%, t3SD 0.028±0.005; n=3 hearts for all lines, mice of 6-weeks of age). There were no statistical differences between the mouse lines. Thus, there are no significant increases or differences in amount of fibrosis in any of the mouse lines that would explain the differences in diastolic function. Please see data supplement for additional methods and results (Figure S8).
Discussion
This study was undertaken to determine the contribution of cMyBP-C phosphorylation to cardiac diastolic function, which was done by comparing cardiac function in mouse models expressing phosphorylation deficient cMyBP-C(t3SA), phosphomimetic cMyBP-C(t3SD), or normally phosophorylatable cMyBP-C(tWT). The key findings in echocardiography and intra-cardiac pressure/volume measurements demonstrate that diastolic function varies widely with the phosphorylation state of cMyBP-C; therefore, cMyBP-C is a key determinant of myocardial relaxation. Phosphorylation mimetic cMyBP-C(t3SD) hearts consistently showed enhanced relaxation and enhanced diastolic function. At the opposite extreme, phosphorylation deficient cMyBP-C(t3SA) hearts consistently showed impaired relaxation and diastolic dysfunction. Furthermore, cMyBP-C(t3SA) mice showed phenotypes that resemble human HFpEF. Simultaneous force and [Ca2+]i measurements were done on intact papillary muscles to elucidate the underlying mechanism. The results suggest that cMyBP-C phosphorylation increased rates of cross-bridge detachment to mediate enhancement of diastolic function (see Table).
Table.
Functional Studies Summary
| Method | Changes in function, using cMyBP-C(tWT) as the reference
|
|
|---|---|---|
| cMyBP-C(t3SA) | cMyBP-C(t3SD) | |
| Echocardiography | ↓Ea, ↓Ea/Sa, ↑E/Ea | ↑Ea, ↑Ea/Sa, ↓E/Ea |
| Intra-cardiac pressure-volume | ↓|(−dP/dt)min|, ↓dPR, ↑Tau-Glantz, ↑Stiffness | ↑|(−dP/dt)min|, ↑dPR, ↓Tau-Glantz, ↓Stiffness |
| Intact Papillary Muscle | ↓dFR, ↓kforce, ~kCa | ↑dFR, ↑kforce, ~kCa |
Enhancement of myocardial relaxation due to cMyBP-C phosphorylation is likely due to a faster rate of cross-bridge detachment
The relaxation rates measured in papillary muscles increased with cMyBP-C phosphorylation, in the following rank order of force decay rate constants kforce [cMyBP-C(t3SD) > cMyBP-C(tWT) > cMyBP-C(t3SA)]. cMyBP-C(t3SD) and cMyBP-C(tWT) papillary muscles exhibited frequency-dependent acceleration of relaxation as evidenced by increasing dFR as pacing frequency was increased. The underlying greater increases in |(−dF/dt)min| relative to |(+dF/dt)max| suggest that an increased rate of cross-bridge detachment underlies the acceleration of relaxation. All three mouse models exhibited similar [Ca2+]i decay rate constants, kCa, at 1 Hz and similar frequency-dependent increases in kCa, i.e., increased pacing frequency similarly accelerated calcium re-uptake in all models. Consequently, the faster relaxation kinetics (kforce) and acceleration of relaxation (dFR) with increasing pacing frequency observed with increasing cMyBP-C phosphorylation cannot be attributed to changes in calcium handling kinetics. Present and previous14 experiments on skinned myocardium also yielded similar calcium sensitivities of force among all three mouse models. The absence of differences in calcium handling or calcium sensitivity further supports the conclusion that cMyBP-C phosphorylation causes faster cross-bridge detachment rates. Another study demonstrating that phosphorylation of cMyBP-C increased cross-bridge detachment rate without affecting attachment rate is consistent with such a mechanism.16 Likewise, the findings that dephosphorylated cMyBP-C slowed actin sliding velocity over native thick filaments34 and phosphorylated cMyBP-C modified the torsional flexibility of actin35 are consistent with the idea that cross-bridge detachment rates are accelerated by phosphorylation of cMyBP-C. Furthermore, the cMyBP-C(−/−)18 mouse exhibits faster cross-bridge cycling rates14 and an inability to accelerate relaxation in response to increased pacing frequency, thereby resulting in diastolic dysfunction.17 In this scenario, there is no cMyBP-C present to modulate cross-bridge detachment rates to accelerate relaxation. A possible explanation for the effect of cMyBP-C phosphorylation to increase cross-bridge detachment rate is that product release steps in the cross-bridge cycle are accelerated due to reduced binding of phosphorylated cMyBP-C to the myosin heavy chain36, thereby promoting detachment.
cMyBP-C phosphorylation modulates cardiac diastolic function
Measurements of cardiac function in a range of animal models corroborate the idea that cMyBP-C phosphorylation levels modulate diastolic function. For example, a hypertensive mouse model exhibited both diastolic dysfunction and decreased cMyBP-C phosphorylation at Ser282.37 A review17 has summarized that essentially all genetically modified mouse models of cMyBP-C dephosphorylation exhibit some form of diastolic dysfunction. On the other hand, increased cMyBP-C phosphorylation at Ser273/Ser282 was associated with preserved diastolic function despite increased blood pressure, increased peak intracellular calcium, and decreased cTnI phosphorylation in an angiotensin-II infusion rat model of hypertension.38 Older hypertensive dogs with HFpEF exhibited diastolic dysfunction in the presence of hypo-phosphorylation of cMyBP-C along with other contractile proteins.39 The present work clarifies the roles of cMyBP-C phosphorylation in changes of diastolic function found in prior studies by demonstrating that cMyBP-C phosphorylation can directly modulate diastolic function in the absence of aging, hypertension, or volume overload.
Existing data from humans show that hypo-phosphorylation of cMyBP-C is associated with diastolic dysfunction. Patients exhibiting a combination of hypertension, left ventricular hypertrophy, normal ejection fraction, and diastolic dysfunction were found to have decreased cMyBP-C phosphorylation.40 Diastolic dysfunction with normal ejection fraction is a prominent aspect of hypertrophic cardiomyopathy (HCM). Samples of myocardium obtained during myectomy surgery to relieve outflow obstruction in HCM patients exhibited decreased cMyBP-C phosphorylation41, 42, suggesting that hypo-phosphorylation of cMyBP-C is involved in the pathogenesis of diastolic dysfunction in these patients. Thus, these clinical data support the notion that cMyBP-C phosphorylation modulate diastolic function.
Cardiac phenotypes in the cMyBP-C(t3SA) mouse resemble human HFpEF. Decreased daily running distances, increased lung/body weight ratio (i.e., pulmonary edema), and increased BNP mRNA levels combine to suggest the presence of heart failure in cMyBP-C(t3SA) mice. Furthermore, 12-month-old cMyBP-C(t3SA) hearts show similar LVIDd, similar LVEF, and diastolic dysfunction in comparison cMyBP-C(tWT) mice. Human HFpEF is defined by the presence of heart failure with EF typically greater than 50%,43 with diastolic dysfunction as a major contributing factor.3 A majority of HFpEF patients exhibit hypertrophy.44 Thus, the combination of preserved EF, diastolic dysfunction, and hypertrophy in the presence of heart failure suggests that the cMyBP-C(t3SA) mouse approximates human HFpEF. On the other hand, cMyBP-C(t3SD) hearts exhibiting enhanced diastolic function that persists into older age suggests that phosphorylation of cMyBP-C may be a target for treating HFpEF.
Observed changes are not attributable to differences in post-translational modifications of other regulatory contractile proteins, selected kinases, or fibrosis
Similar distributions of 2D-DIGE spots for cTnI, cTnT4, cTm, and MLC-2 showed that there are no differences in post-translational modifications of these proteins in our mutant mouse lines. Phosphorylation staining also showed similar levels of titin phosphorylation. Expression and phosphorylation levels of CaMK2δ and PKA are similar. All mouse lines also demonstrated similarly negligible fibrosis. Therefore, differences in cardiac function cannot be attributed to differences in post-translational modification of myofilament proteins (cTnI, cTnT4, cTm, MLC-2), titin phosphorylation, CaMK2δ, PKA, or fibrosis.
Potential limitations
At present, about seventeen potential phosphorylation sites, including serines, tyrosines and threonines,45 have been identified in cMyBP-C. Our mouse models only address three serine phosphorylation sites. Thus, the roles of the remaining phosphorylation sites remain to be determined. Despite carefully excluding many possible confounding differences (e.g., calcium transients, phosphorylation of other contractile proteins, fibrosis), undetected compensation in response to our genetic manipulations may still have taken place to contribute to the observed differences.
β-adrenergic receptor activation leading to PKA phosphorylation of cMyBP-C can also activate G-protein receptor kinase-2 (GRK2) signaling pathway.46 This parallel GRK2 signaling pathway can depress cardiac function and cause deleterious remodeling.47 Angiotensin-II causing reactive oxygen radicals to constitutively activate CaMK2δ is another parallel signaling pathway to cMyBP-C phosphorylation that can cause harm.48 Thus, challenges in developing therapies would be finding methods to phosphorylate cMyBP-C or maintain cMyBP-C phosphorylation independently of these parallel signaling pathways.
Conclusions
Echocardiography and pressure/volume measurements show that cMyBP-C phosphorylation enhances relaxation, while the absence of cMyBP-C phosphorylation at the PKA sites in the M-domain causes diastolic dysfunction. Simultaneous force and [Ca2+]i measurements in intact papillary muscles suggest that cMyBP-C phosphorylation increases rates of cross-bridge detachment relative to attachment as the underlying mechanism for enhanced relaxation. The absence of cMyBP-C phosphorylation at the M-domain sites results in phenotypes resembling HFpEF. Thus, interventions designed to mimic or increase the levels of cMyBP-C phosphorylation can be potential treatments for HFpEF.
Supplementary Material
Acknowledgments
We would like to thank Vincent J. VanBuren Ph.D. (Texas A&M University HSC College of Medicine) for his statistical analyses support.
Sources of Funding: This effort is supported in part by NIH/NHLBI K08HL114877, AHA/BGIA7750035, Texas A&M University HSC College of Medicine start-up funds, and Baylor Scott & White Health funds to CT; NIH/NHLBI PO1 HL 062426 to RJS; and NIH/NHLBI R37 HL82900 and P01 HL094291 to RLM.
Footnotes
Disclosures
R.L. Moss is a consultant to Myokardia, Inc. R.J. Solaro is a member of the Scientific Advisory Board at Cytokinetics Inc.
References
- 1.Go AS, Mozaffarian D, Roger VL, Benjamin EJ, Berry JD, Blaha MJ, Dai S, Ford ES, Fox CS, Franco S, Fullerton HJ, Gillespie C, Hailpern SM, Heit JA, Howard VJ, Huffman MD, Judd SE, Kissela BM, Kittner SJ, Lackland DT, Lichtman JH, Lisabeth LD, Mackey RH, Magid DJ, Marcus GM, Marelli A, Matchar DB, McGuire DK, Mohler ER, 3rd, Moy CS, Mussolino ME, Neumar RW, Nichol G, Pandey DK, Paynter NP, Reeves MJ, Sorlie PD, Stein J, Towfighi A, Turan TN, Virani SS, Wong ND, Woo D, Turner MB. Heart disease and stroke statistics–2014 update: a report from the american heart association. Circulation. 2014;129:e28–e292. doi: 10.1161/01.cir.0000441139.02102.80. [DOI] [PMC free article] [PubMed] [Google Scholar]
- 2.Owan TE, Hodge DO, Herges RM, Jacobsen SJ, Roger VL, Redfield MM. Trends in prevalence and outcome of heart failure with preserved ejection fraction. N Engl J Med. 2006;355:251–9. doi: 10.1056/NEJMoa052256. [DOI] [PubMed] [Google Scholar]
- 3.McMurray JJ, Adamopoulos S, Anker SD, Auricchio A, Bohm M, Dickstein K, Falk V, Filippatos G, Fonseca C, Gomez-Sanchez MA, Jaarsma T, Kober L, Lip GY, Maggioni AP, Parkhomenko A, Pieske BM, Popescu BA, Ronnevik PK, Rutten FH, Schwitter J, Seferovic P, Stepinska J, Trindade PT, Voors AA, Zannad F, Zeiher A. ESC Guidelines for the diagnosis and treatment of acute and chronic heart failure 2012: The Task Force for the Diagnosis and Treatment of Acute and Chronic Heart Failure 2012 of the European Society of Cardiology. Developed in collaboration with the Heart Failure Association (HFA) of the ESC. Eur Heart J. 2012;33:1787–847. doi: 10.1093/eurheartj/ehs104. [DOI] [PubMed] [Google Scholar]
- 4.Redfield MM, Jacobsen SJ, Burnett JC, Jr, Mahoney DW, Bailey KR, Rodeheffer RJ. Burden of systolic and diastolic ventricular dysfunction in the community: appreciating the scope of the heart failure epidemic. Jama. 2003;289:194–202. doi: 10.1001/jama.289.2.194. [DOI] [PubMed] [Google Scholar]
- 5.Offer G, Moos C, Starr R. A new protein of the thick filaments of vertebrate skeletal myofibrils. Extractions, purification and characterization. J Mol Biol. 1973;74:653–76. doi: 10.1016/0022-2836(73)90055-7. [DOI] [PubMed] [Google Scholar]
- 6.Luther PK, Bennett PM, Knupp C, Craig R, Padron R, Harris SP, Patel J, Moss RL. Understanding the organisation and role of myosin binding protein C in normal striated muscle by comparison with MyBP-C knockout cardiac muscle. J Mol Biol. 2008;384:60–72. doi: 10.1016/j.jmb.2008.09.013. [DOI] [PMC free article] [PubMed] [Google Scholar]
- 7.Gautel M, Zuffardi O, Freiburg A, Labeit S. Phosphorylation switches specific for the cardiac isoform of myosin binding protein-C: a modulator of cardiac contraction? Embo J. 1995;14:1952–60. doi: 10.1002/j.1460-2075.1995.tb07187.x. [DOI] [PMC free article] [PubMed] [Google Scholar]
- 8.Xiao L, Zhao Q, Du Y, Yuan C, Solaro RJ, Buttrick PM. PKCepsilon increases phosphorylation of the cardiac myosin binding protein C at serine 302 both in vitro and in vivo. Biochemistry. 2007;46:7054–61. doi: 10.1021/bi700467k. [DOI] [PMC free article] [PubMed] [Google Scholar]
- 9.Dirkx E, Cazorla O, Schwenk RW, Lorenzen-Schmidt I, Sadayappan S, Van Lint J, Carrier L, van Eys GJ, Glatz JF, Luiken JJ. Protein kinase D increases maximal Ca2+-activated tension of cardiomyocyte contraction by phosphorylation of cMyBP-C-Ser315. Am J Physiol Heart Circ Physiol. 2012;303:H323–31. doi: 10.1152/ajpheart.00749.2011. [DOI] [PMC free article] [PubMed] [Google Scholar]
- 10.Schlender KK, Bean LJ. Phosphorylation of chicken cardiac C-protein by calcium/calmodulin-dependent protein kinase II. J Biol Chem. 1991;266:2811–7. [PubMed] [Google Scholar]
- 11.Kuster DW, Sequeira V, Najafi A, Boontje NM, Wijnker PJ, Witjas-Paalberends ER, Marston SB, Dos Remedios CG, Carrier L, Demmers JA, Redwood C, Sadayappan S, van der Velden J. GSK3beta phosphorylates newly identified site in the proline-alanine-rich region of cardiac myosin-binding protein C and alters cross-bridge cycling kinetics in human: short communication. Circ Res. 2013;112:633–9. doi: 10.1161/CIRCRESAHA.112.275602. [DOI] [PMC free article] [PubMed] [Google Scholar]
- 12.Cuello F, Bardswell SC, Haworth RS, Ehler E, Sadayappan S, Kentish JC, Avkiran M. Novel role for p90 ribosomal S6 kinase in the regulation of cardiac myofilament phosphorylation. J Biol Chem. 2011;286:5300–10. doi: 10.1074/jbc.M110.202713. [DOI] [PMC free article] [PubMed] [Google Scholar]
- 13.Bardswell SC, Cuello F, Rowland AJ, Sadayappan S, Robbins J, Gautel M, Walker JW, Kentish JC, Avkiran M. Distinct sarcomeric substrates are responsible for protein kinase D-mediated regulation of cardiac myofilament Ca2+ sensitivity and cross-bridge cycling. J Biol Chem. 2010;285:5674–82. doi: 10.1074/jbc.M109.066456. [DOI] [PMC free article] [PubMed] [Google Scholar]
- 14.Tong CW, Stelzer JE, Greaser ML, Powers PA, Moss RL. Acceleration of crossbridge kinetics by protein kinase A phosphorylation of cardiac myosin binding protein C modulates cardiac function. Circ Res. 2008;103:974–82. doi: 10.1161/CIRCRESAHA.108.177683. [DOI] [PMC free article] [PubMed] [Google Scholar]
- 15.Stelzer JE, Patel JR, Walker JW, Moss RL. Differential roles of cardiac myosin-binding protein C and cardiac troponin I in the myofibrillar force responses to protein kinase A phosphorylation. Circ Res. 2007;101:503–11. doi: 10.1161/CIRCRESAHA.107.153650. [DOI] [PubMed] [Google Scholar]
- 16.Coulton AT, Stelzer JE. Cardiac myosin binding protein C and its phosphorylation regulate multiple steps in the cross-bridge cycle of muscle contraction. Biochemistry. 2012;51:3292–301. doi: 10.1021/bi300085x. [DOI] [PMC free article] [PubMed] [Google Scholar]
- 17.Tong CW, Nair NA, Doersch KM, Liu Y, Rosas PC. Cardiac myosin-binding protein-C is a critical mediator of diastolic function. Pflugers Arch. 2014;466:451–7. doi: 10.1007/s00424-014-1442-1. [DOI] [PMC free article] [PubMed] [Google Scholar]
- 18.Harris SP, Bartley CR, Hacker TA, McDonald KS, Douglas PS, Greaser ML, Powers PA, Moss RL. Hypertrophic cardiomyopathy in cardiac myosin binding protein-C knockout mice. Circ Res. 2002;90:594–601. doi: 10.1161/01.res.0000012222.70819.64. [DOI] [PubMed] [Google Scholar]
- 19.Layland J, Cave AC, Warren C, Grieve DJ, Sparks E, Kentish JC, Solaro RJ, Shah AM. Protection against endotoxemia-induced contractile dysfunction in mice with cardiac-specific expression of slow skeletal troponin I. FASEB journal : official publication of the Federation of American Societies for Experimental Biology. 2005;19:1137–9. doi: 10.1096/fj.04-2519fje. [DOI] [PubMed] [Google Scholar]
- 20.Solaro RJ, Pang DC, Briggs FN. The purification of cardiac myofibrils with Triton X-100. Biochim Biophys Acta. 1971;245:259–62. doi: 10.1016/0005-2728(71)90033-8. [DOI] [PubMed] [Google Scholar]
- 21.Scruggs SB, Hinken AC, Thawornkaiwong A, Robbins J, Walker LA, de Tombe PP, Geenen DL, Buttrick PM, Solaro RJ. Ablation of ventricular myosin regulatory light chain phosphorylation in mice causes cardiac dysfunction in situ and affects neighboring myofilament protein phosphorylation. J Biol Chem. 2009;284:5097–106. doi: 10.1074/jbc.M807414200. [DOI] [PMC free article] [PubMed] [Google Scholar]
- 22.Warren CM, Arteaga GM, Rajan S, Ahmed RP, Wieczorek DF, Solaro RJ. Use of 2-D DIGE analysis reveals altered phosphorylation in a tropomyosin mutant (Glu54Lys) linked to dilated cardiomyopathy. Proteomics. 2008;8:100–5. doi: 10.1002/pmic.200700772. [DOI] [PMC free article] [PubMed] [Google Scholar]
- 23.Yuan C, Sheng Q, Tang H, Li Y, Zeng R, Solaro RJ. Quantitative comparison of sarcomeric phosphoproteomes of neonatal and adult rat hearts. Am J Physiol Heart Circ Physiol. 2008;295:H647–56. doi: 10.1152/ajpheart.00357.2008. [DOI] [PMC free article] [PubMed] [Google Scholar]
- 24.Kirk JA, MacGowan GA, Evans C, Smith SH, Warren CM, Mamidi R, Chandra M, Stewart AF, Solaro RJ, Shroff SG. Left ventricular and myocardial function in mice expressing constitutively pseudophosphorylated cardiac troponin I. Circ Res. 2009;105:1232–9. doi: 10.1161/CIRCRESAHA.109.205427. [DOI] [PMC free article] [PubMed] [Google Scholar]
- 25.Fritz JD, Swartz DR, Greaser ML. Factors affecting polyacrylamide gel electrophoresis and electroblotting of high-molecular-weight myofibrillar proteins. Anal Biochem. 1989;180:205–10. doi: 10.1016/0003-2697(89)90116-4. [DOI] [PubMed] [Google Scholar]
- 26.Zile MR, Baicu CF, Gaasch WH. Diastolic heart failure–abnormalities in active relaxation and passive stiffness of the left ventricle. N Engl J Med. 2004;350:1953–9. doi: 10.1056/NEJMoa032566. [DOI] [PubMed] [Google Scholar]
- 27.Tong CW, Gaffin RD, Zawieja DC, Muthuchamy M. Roles of phosphorylation of myosin binding protein-C and troponin I in mouse cardiac muscle twitch dynamics. J Physiol. 2004;558:927–41. doi: 10.1113/jphysiol.2004.062539. [DOI] [PMC free article] [PubMed] [Google Scholar]
- 28.Nagueh SF, Sun H, Kopelen HA, Middleton KJ, Khoury DS. Hemodynamic determinants of the mitral annulus diastolic velocities by tissue Doppler. J Am Coll Cardiol. 2001;37:278–85. doi: 10.1016/s0735-1097(00)01056-1. [DOI] [PubMed] [Google Scholar]
- 29.Seo JS, Kim DH, Kim WJ, Song JM, Kang DH, Song JK. Peak systolic velocity of mitral annular longitudinal movement measured by pulsed tissue Doppler imaging as an index of global left ventricular contractility. Am J Physiol Heart Circ Physiol. 2010;298:H1608–15. doi: 10.1152/ajpheart.01231.2009. [DOI] [PubMed] [Google Scholar]
- 30.Ho CY, Solomon SD. A clinician’s guide to tissue Doppler imaging. Circulation. 2006;113:e396–8. doi: 10.1161/CIRCULATIONAHA.105.579268. [DOI] [PubMed] [Google Scholar]
- 31.Kasner M, Westermann D, Steendijk P, Gaub R, Wilkenshoff U, Weitmann K, Hoffmann W, Poller W, Schultheiss HP, Pauschinger M, Tschope C. Utility of Doppler echocardiography and tissue Doppler imaging in the estimation of diastolic function in heart failure with normal ejection fraction: a comparative Doppler-conductance catheterization study. Circulation. 2007;116:637–47. doi: 10.1161/CIRCULATIONAHA.106.661983. [DOI] [PubMed] [Google Scholar]
- 32.Nagueh SF, Appleton CP, Gillebert TC, Marino PN, Oh JK, Smiseth OA, Waggoner AD, Flachskampf FA, Pellikka PA, Evangelista A. Recommendations for the evaluation of left ventricular diastolic function by echocardiography. J Am Soc Echocardiogr. 2009;22:107–33. doi: 10.1016/j.echo.2008.11.023. [DOI] [PubMed] [Google Scholar]
- 33.Raff GL, Glantz SA. Volume loading slows left ventricular isovolumic relaxation rate. Evidence of load-dependent relaxation in the intact dog heart. Circ Res. 1981;48:813–24. doi: 10.1161/01.res.48.6.813. [DOI] [PubMed] [Google Scholar]
- 34.Previs MJ, Beck Previs S, Gulick J, Robbins J, Warshaw DM. Molecular mechanics of cardiac myosin-binding protein C in native thick filaments. Science. 2012;337:1215–8. doi: 10.1126/science.1223602. [DOI] [PMC free article] [PubMed] [Google Scholar]
- 35.Colson BA, Rybakova IN, Prochniewicz E, Moss RL, Thomas DD. Cardiac myosin binding protein-C restricts intrafilament torsional dynamics of actin in a phosphorylation-dependent manner. Proc Natl Acad Sci U S A. 2012;109:20437–42. doi: 10.1073/pnas.1213027109. [DOI] [PMC free article] [PubMed] [Google Scholar]
- 36.Gruen M, Prinz H, Gautel M. cAPK-phosphorylation controls the interaction of the regulatory domain of cardiac myosin binding protein C with myosin-S2 in an on-off fashion. FEBS Lett. 1999;453:254–9. doi: 10.1016/s0014-5793(99)00727-9. [DOI] [PubMed] [Google Scholar]
- 37.Jeong EM, Monasky MM, Gu L, Taglieri DM, Patel BG, Liu H, Wang Q, Greener I, Dudley SC, Jr, Solaro RJ. Tetrahydrobiopterin improves diastolic dysfunction by reversing changes in myofilament properties. J Mol Cell Cardiol. 2013;56:44–54. doi: 10.1016/j.yjmcc.2012.12.003. [DOI] [PMC free article] [PubMed] [Google Scholar]
- 38.Jin CZ, Jang JH, Kim HJ, Wang Y, Hwang IC, Sadayappan S, Park BM, Kim SH, Jin ZH, Seo EY, Kim KH, Kim YJ, Kim SJ, Zhang YH. Myofilament Ca2+ desensitization mediates positive lusitropic effect of neuronal nitric oxide synthase in left ventricular myocytes from murine hypertensive heart. J Mol Cell Cardiol. 2013;60:107–15. doi: 10.1016/j.yjmcc.2013.04.017. [DOI] [PubMed] [Google Scholar]
- 39.Hamdani N, Bishu KG, von Frieling-Salewsky M, Redfield MM, Linke WA. Deranged myofilament phosphorylation and function in experimental heart failure with preserved ejection fraction. Cardiovasc Res. 2013;97:464–71. doi: 10.1093/cvr/cvs353. [DOI] [PubMed] [Google Scholar]
- 40.Donaldson C, Palmer BM, Zile M, Maughan DW, Ikonomidis JS, Granzier H, Meyer M, VanBuren P, LeWinter MM. Myosin cross-bridge dynamics in patients with hypertension and concentric left ventricular remodeling. Circ Heart Fail. 2012;5:803–11. doi: 10.1161/CIRCHEARTFAILURE.112.968925. [DOI] [PMC free article] [PubMed] [Google Scholar]
- 41.Copeland O, Sadayappan S, Messer AE, Steinen GJ, van der Velden J, Marston SB. Analysis of cardiac myosin binding protein-C phosphorylation in human heart muscle. J Mol Cell Cardiol. 2010;49:1003–11. doi: 10.1016/j.yjmcc.2010.09.007. [DOI] [PubMed] [Google Scholar]
- 42.van Dijk SJ, Paalberends ER, Najafi A, Michels M, Sadayappan S, Carrier L, Boontje NM, Kuster DW, van Slegtenhorst M, Dooijes D, dos Remedios C, ten Cate FJ, Stienen GJ, van der Velden J. Contractile dysfunction irrespective of the mutant protein in human hypertrophic cardiomyopathy with normal systolic function. Circ Heart Fail. 2012;5:36–46. doi: 10.1161/CIRCHEARTFAILURE.111.963702. [DOI] [PubMed] [Google Scholar]
- 43.Writing Committee M. Yancy CW, Jessup M, Bozkurt B, Butler J, Casey DE, Jr, Drazner MH, Fonarow GC, Geraci SA, Horwich T, Januzzi JL, Johnson MR, Kasper EK, Levy WC, Masoudi FA, McBride PE, McMurray JJ, Mitchell JE, Peterson PN, Riegel B, Sam F, Stevenson LW, Tang WH, Tsai EJ, Wilkoff BL, American College of Cardiology Foundation/American Heart Association Task Force on Practice G 2013 ACCF/AHA guideline for the management of heart failure: a report of the American College of Cardiology Foundation/American Heart Association Task Force on practice guidelines. Circulation. 2013;128:e240–327. doi: 10.1161/CIR.0b013e31829e8776. [DOI] [PubMed] [Google Scholar]
- 44.Zile MR, Gottdiener JS, Hetzel SJ, McMurray JJ, Komajda M, McKelvie R, Baicu CF, Massie BM, Carson PE, Investigators IP Prevalence and significance of alterations in cardiac structure and function in patients with heart failure and a preserved ejection fraction. Circulation. 2011;124:2491–501. doi: 10.1161/CIRCULATIONAHA.110.011031. [DOI] [PubMed] [Google Scholar]
- 45.Kooij V, Holewinski RJ, Murphy AM, Van Eyk JE. Characterization of the cardiac myosin binding protein-C phosphoproteome in healthy and failing human hearts. J Mol Cell Cardiol. 2013;60:116–20. doi: 10.1016/j.yjmcc.2013.04.012. [DOI] [PMC free article] [PubMed] [Google Scholar]
- 46.Benovic JL, Mayor F, Jr, Somers RL, Caron MG, Lefkowitz RJ. Light-dependent phosphorylation of rhodopsin by beta-adrenergic receptor kinase. Nature. 1986;321:869–72. doi: 10.1038/321869a0. [DOI] [PubMed] [Google Scholar]
- 47.Zhu W, Petrashevskaya N, Ren S, Zhao A, Chakir K, Gao E, Chuprun JK, Wang Y, Talan M, Dorn GW, 2nd, Lakatta EG, Koch WJ, Feldman AM, Xiao RP. Gi-biased beta2AR signaling links GRK2 upregulation to heart failure. Circ Res. 2012;110:265–74. doi: 10.1161/CIRCRESAHA.111.253260. [DOI] [PMC free article] [PubMed] [Google Scholar]
- 48.Erickson JR, He BJ, Grumbach IM, Anderson ME. CaMKII in the cardiovascular system: sensing redox states. Physiol Rev. 2011;91:889–915. doi: 10.1152/physrev.00018.2010. [DOI] [PMC free article] [PubMed] [Google Scholar]
Associated Data
This section collects any data citations, data availability statements, or supplementary materials included in this article.