

Abstract
α-Synuclein (aS) aggregation has been amply investigated for its involvement in Parkinson’s disease because its amyloid fibrils are the main constituent of Lewy bodies, one of the hallmarks of the disease. aS aggregation was studied here in vitro and in cellular models to correlate aggregation products with toxicity mechanisms. Independent results published elsewhere suggested that aS overexpression and/or aggregation may impair cellular metabolism and cause mitochondrial damage. In this context, we report the characterization of changes in NADH fluorescence properties in vitro and in human embryonic kidney 293 cells upon aS aggregation. The application of the phasor approach to study NADH fluorescence lifetime and emission allowed us to identify changes that correlate with aS aggregation. In particular, the fraction of bound NADH, characterized by longer lifetimes in comparison to free NADH, is increased, and the maximum of the NADH emission is shifted toward shorter wavelengths in the presence of aggregating aS both in vitro and in cells. These data suggest that NADH binds to aggregated aS. NMR experiments in vitro substantiate such binding, which occurs during aggregation. NADH fluorescence is thus useful to detect aS aggregation and by extension the associated oxidative stress.—Plotegher, N., Stringari, C., Jahid, S., Veronesi, M., Girotto, S., Gratton, E., Bubacco, L. NADH fluorescence lifetime is an endogenous reporter of α-synuclein aggregation in live cells.
Keywords: Parkinson’s disease, amyloid, FLIM, spectral imaging, phasor
α-Synuclein (aS) is a 140 amino acid protein that is abundantly expressed at presynaptic terminals in mammalian brain (1). Its physiologic function is still unclear, but it has been shown that aS is involved in synaptic plasticity (2), neurotransmitter release (3–5), synaptic vesicle recycling, and soluble N-ethylmaleimide-sensitive factor attachment protein receptor complex assembly (6). The association of aS with Parkinson’s disease (PD) arises from the observation that single-point mutations in the SNCA gene, encoding the aS protein, as well as gene duplication or triplication lead to an autosomal-dominant form of this neurodegenerative disorder (7). Moreover, PD is characterized by 1) the prevalent death of dopaminergic neurons in the substantia nigra pars compacta and by 2) the presence of intraneuronal inclusions containing protein aggregates, termed Lewy bodies (LBs), in parkinsonian brains (8). The main constituent of LBs is aS, assembled into amyloid fibrils, which show a secondary structure of predominantly β-sheets (9). The assembly of aS fibrils in its early stages involves the formation of a heterogeneous ensemble of oligomeric species. Fibrillization of aS has been widely studied in vitro using fluorescence spectroscopy, transmission electron microscopy (TEM), and atomic force microscopy (10). More recently, new microscopy techniques for characterizing the aggregation process in cells have been applied (11–13). It is essential to study aS aggregation in live cells when aiming at the identification of the toxicity mechanisms through which aS oligomers or higher aggregates act. The cellular models acquired even more importance when it was shown that aS oligomeric species and fibrillar fragments could be responsible for spreading the aS aggregation process from unhealthy to healthy neurons (14–16).
Aggregation of aS in cells can be studied using β-sheet-sensitive exogenous dyes, such as Thioflavin S, or by using aS-specific antibody staining (17). An alternative approach to study aS aggregation in live cells requires conjugation of native aS with either a fluorescent molecule or a fluorescent protein (18, 19) because an endogenous probe for aggregated aS has not been identified. Furthermore, early-stage oligomerization is difficult to detect because oligomeric species are transient and heterogeneous (10).
Interestingly, aS accumulation in cell models and in vivo was shown to cause impairment of mitochondrial complex I (20, 21). The production of reactive oxygen species by complex I is a general feature associated with PD and aging (22); aS was shown to localize in the mitochondrial membrane (23) and to translocate to the mitochondria under stress conditions (24). Moreover, it has been reported that aS accumulation leads to mitochondrial fragmentation (25) and dysfunction (26–30).
The results presented here suggest that aS is associated with impairment of metabolism due to mitochondrial damage and resultant oxidative stress, perturbing NADH:NAD+ ratio. We monitored free and bound NADH pools by measuring the NADH fluorescence lifetime in live cells as a way to probe the NADH/NAD+ equilibrium. Bird et al. (31) showed that NADH:NAD+ correlates with the ratio between free and bound NADH, which can be determined according to their different fluorescence lifetimes. We measured variations of NADH/NAD+ (approximately free/bound NADH) associated with aS overexpression and aggregation in living cells using a very sensitive approach, termed phasor fluorescence lifetime imaging microscopy (FLIM) (32). To independently validate the association between the variation in NADH fluorescence properties and aS aggregation observed in cells, we measured NADH fluorescence lifetime and spectra and NMR properties in an in vitro aS aggregation assay.
MATERIALS AND METHODS
Solution and aS aggregate preparation
Recombinant aS was obtained as previously described (33), suspended in sterile PBS (pH 7.4) at a concentration of ∼250 μM. A 250 μM NADH solution was prepared in PBS (pH 7.4). The NADH fluorescence spectrum and lifetime were measured in buffer, mixed 1:1 with 1000 U/ml lactate dehydrogenase (LDH) (L3916; Sigma-Aldrich, St. Louis, MO, USA), mixed 1:1 with the 250 μM aS solution, or preparing an aggregated sample from equimolar aS:NADH solution shaking for 2 weeks at 1000 rpm at 37°C.
TEM measurements
TEM samples were prepared by adsorbing a 15 μl aliquot taken from an aS/NADH aggregated sample, prepared as previously described, onto a carbon-coated copper grid. Negative staining was then performed with a 0.05% uranyl acetate solution. TEM micrographs were acquired on a Tecnai G2 12 Twin instrument (FEI Company, Hillsboro, OR, USA).
NMR experiments
For all the NMR experiments, aS samples were prepared in 20 mM Tris buffer (pH 7.4). Samples for water-ligand observed via gradient spectroscopy (WaterLOGSY) and R2 filter experiments were prepared by incubating identical aliquots of aS (5 µM) in a thermoshaker at 37°C at 1000 rpm. At different incubation times, NADH (100 µM, final concentration) was added to the aS aliquots just before recording the NMR spectra.
All NMR experiments were performed at 298 K on a Bruker Ultrashield Plus FT-NMR 600 MHz ADVANCE III equipped with a Cryoprobe QCI 1H/19F–13C/15N–D and with a SampleJet autosampler with temperature control (Bruker Corporation, Billerica, MA, USA). For each sample, reference 1D 1H spectra of the incubated protein and NADH samples alone were recorded before mixing them. In the 1H NMR spectrum, multiple solvent suppression was achieved with the excitation sculpting sequence (34, 35); the 2 selective 180° square pulses and the 4 pulsed field gradients of the scheme were 2.7 and 1.2 ms in duration, respectively. The gradient recovery time was 0.2 ms. A mixture of 5 planar fluorinated molecules (1-[4-(5-trifluoromethyl-imidazo[1,2-a]pyrimidin-7-yl)-piperidin-1-yl]-ethanone; 5-piperidin-3-yl-7-trifluoromethyl-imidazo[1,2-a]pyrimidine; 2H-chromen-3-yl-[2-(trifluoromethyl)-6,8-dihydro-5H-imidazo[1,2-a]pyrazin-7-yl]methanone; 2-methoxy-1-[4-[6-methyl-4-(trifluoromethyl)isoxazolo[5,4-b]pyridin-3-yl]-1-piperidyl]ethanone; and [5-amino-1-(4-trifluoromethoxy-phenyl)-1H-pyrazol-4-yl]-piperidin-4-yl-methanone), shown in Supplemental Fig. S7, was added to the incubated protein as a control, to verify possible nonspecific interactions.
WaterLOGSY NMR experiments used a 2.7 ms selective rectangular 180° pulse at the water signal frequency and a nuclear overhauser effect mixing time of 1.5 seconds, with a number of scans of 1024 and a delay time (d1) of 2 s. 1H R2 filter experiments were recorded with a spin-echo scheme with a total τ of 0.96 s, 64 scans, and a d1 of 3 s. 19F R2 filter experiments were recorded with a spin-echo scheme with a total τ of 0.6 s, 64 scans, and a d1 of 3 s.
Seed preparation
Fragments of recombinant aS fibrils, termed seeds, for cell treatments were prepared as follows: lyophilized aS was resuspended in PBS (pH 7.4) and aggregated for 2 weeks at 37°C with shaking at 1000 rpm; fibrils were then pelleted, washed and suspended in sterile PBS (pH 7.4), and sonicated with a tip sonicator. Seed concentration was calculated as the equivalent monomeric aS concentration by measuring supernatant concentration after pelleting the fibrils and estimating the amount of protein in the fibrils by difference.
Cell cultures and transfection
Human embryonic kidney 293 (HEK293) cells were cultured in DMEM, supplemented with 10% fetal bovine serum (FBS), 50 U/ml penicillin, and 50 μg/ml streptomycin (Gibco, Life Technologies, Carlsbad, CA, USA) at 37°C in 5% CO2. Cells were plated at ∼70% confluency in 35 mm Petri dishes with 14 mm microwells, properly designed for imaging (MatTek Corporation, Ashland, MA, USA) and coated with fibronectin (Sigma-Aldrich). pcDNA empty vector or pcDNA-aS was overexpressed using Lipofectamine (Invitrogen, Life Technologies) as transfection reagent, following the manufacturer’s protocol. The plasmid amount was 2 μg (DNA:Lipofectamine was 1:2.5). When needed, 1–3 μM seeds were added to the Lipofectamine and DNA mix before the transfection.
Western blot
HEK293 cell samples were lysed with a lysis buffer [20 mM Tris (pH 8.0), 150 mM NaCl, 1 mM EDTA, 1 mM sodium pyrophosphate, 1 mM glycerophosphate, 1 mM sodium orthovanadate, and 1% Triton X-100] supplemented with protease inhibitor cocktail (Sigma-Aldrich) and centrifuged to eliminate cellular debris. Samples of the control cell lysate and of the cells overexpressing aS lysate were loaded onto an SDS-PAGE (13%) and after running blotted onto a PVDF membrane. aS was detected using the MJFR1 antibody (Abcam Incorporated, Cambridge, MA, USA) and quantification with ImageJ (NIH, Bethesda, MD, USA).
Wide-field and confocal imaging
Cells were fixed in methanol at −20°C, permeabilized in PBS with 0.1% Triton X-100, and blocked with PBS supplemented with 5% FBS. Blocked cells were then stained with a mouse monoclonal primary antibody against aS (Cell Signaling Technology, Danvers, MA, USA) diluted 1:200 in PBS with 5% FBS. The counterstaining was performed with Alexa Fluor 488 goat anti-mouse IgG, diluted 1:200 (Invitrogen, Life Technologies). Cells were also stained with Hoechst 33242 (Invitrogen, Life Technologies) to visualize the nuclei. Wide-field fluorescence images were collected with an inverted wide-field microscope (Leica DMI 4000B; Leica Microsystems, Buffalo Grove, IL, USA), and higher-resolution fluorescence microscopy images were acquired with a confocal microscope (Nikon Eclipse E6000; Tokyo, Japan).
Multiphoton, fluorescence lifetime, and spectral imaging
Fluorescence lifetime imaging was performed using a Zeiss 710 with a ×63/1.4 oil-immersion objective (Carl Zeiss Gesellschaft mit beschränkter Haftung, Jena, Germany), coupled with a Ti:Sapphire laser (Mai Tai; Spectra-Physics, Santa Clara, CA, USA) and an ISS A320 FastFLIM (Champaign, IL, USA). The acquisition settings were as follows: an image size of 256 × 256 pixels and pixel dwell time of 25 μs/pixel. A dichroic filter (690 nm) separated the fluorescence signal from the laser light, and a short-pass filter (610 nm) was placed in front of the photomultiplier (H7422P-40; Hamamatsu, Shizuoka Prefecture, Japan). The excitation wavelength for NADH was 740 nm.
A 495 nm long-pass filter separates the blue and the green fluorescence. NADH fluorescence was collected through a 460/80 nm filter.
The software used for data acquisition and analysis was SimFCS, developed at the Laboratory for Fluorescence Dynamics (University of California, Irvine, Irvine, CA, USA; http://www.lfd.uci.edu). FLIM calibration was obtained by measuring the lifetime of fluorescein, which is known to be 4.04 ns. Data were acquired until >100 counts were collected in the brightest pixel of the image.
Data acquisition for spectral phasor experiments was performed on a Zeiss 710 using a ×63/1.4 oil objective, coupled with a Ti:sapphire laser, exciting the sample at 740 nm. The images were acquired in the spectral mode of the microscope using Zeiss software, using 32 channels with 9.73 nm of bandwidth, from 416.32 to 727.65 nm. Pixel dwell time was 177 ms, image size was 512 × 512 pixels, and each image was the result of averaging 2–4 acquisitions.
FLIM data analysis
Every pixel in the FLIM image was transformed to a pixel in the phasor plot, as described previously by Digman et al. (32) in 2008: the coordinates g and s of each point in the phasor plot were calculated from the fluorescence-intensity decay in the corresponding pixel in the FLIM image. The cluster analysis of the phasor plot allowed for identifying clusters of pixels with similar lifetimes. For the analysis of the average lifetime in each cell (whole cell or cell cytoplasm), the regions of interest in every frame were selected and the average g and s values calculated (36). The data analysis was always performed using SimFCS, and statistical significance was estimated with t test using OriginPro 8 (OriginLab Corporation, Northampton, MA, USA).
Spectral data analysis
Phasor transformations are used to transform the spectral changes occurring at each pixel in a spectral image acquired into a phasor plot as described below. The phasor plot shows the spectral properties of each pixel as a function of the coordinates of that pixel in a 360° circle, in which the angle is associated with the wavelength of the spectral maximum and the distance of the pixel from 0 with the fluorescence intensity. This idea was first proposed by Fereidouni et al. (37), and spectral phasor transformation was adapted from the equations proposed for the phasor-FLIM approach (32).
RESULTS
NADH is the main autofluorescence source in HEK293 cells
We first identified NADH as the main contributor to the autofluorescence signal observed at 460 nm in live cells upon excitation at 740 nm. Autofluorescence at 460 nm using excitation at 740 nm is an established method to detect variations in NADH and NAD+ relative amounts and in general to monitor cellular and mitochondrial metabolism (36, 38–42). However, to exclude the contribution of other fluorescent sources, we explored other regions of the autofluorescence absorption spectrum. As reported in Supplemental Fig. S1, exciting cell samples at different wavelengths (720, 760, 800, and 850 nm) did not lead to any increase in the detected signal, ruling out the possibility of a large contribution to the fluorescence from flavins or lipofuscins, which have large 2-photon absorption spectra at longer wavelengths (43, 44). The emission maxima we measured in HEK293 cells upon 2-photon excitation at 740 nm were at 460 nm, which corresponds to the NADH emission maximum. Therefore, we concluded that the lifetime changes described below are mainly attributable to variations in NADH lifetime.
NADH lifetime variation in cell models for aS aggregation
Although NADH fluorescence intensity variations are dependent on its concentration, the NADH fluorescence lifetime and emission spectrum line shapes do not suffer from this limitation, which is a high source of variability when studying living cells. For this reason, we chose to characterize NADH fluorescence in terms of its lifetime in our aS aggregation cell models. The phasor transformations applied to the fluorescence lifetime measurement method allowed us to identify and quantify free and bound NADH at a single pixel resolution (32). The free and bound NADH equilibrium was studied in HEK293 cells in which aS was overexpressed (HEK293-aS). However, because aS overexpression does not necessarily lead to the formation of large inclusions that resemble LBs, we also reproduced another well-established cellular aggregation model (17). aS aggregation was triggered within cells by introducing fragments of preformed aS fibrils (seeds) in cell cytoplasm (HEK293-seeds). As control, we used HEK293 cells transfected with the empty vector (HEK293-empty). Supplemental Fig. S2 shows HEK293-aS (on the left) and HEK293-seeds (on the right) stained with an antibody against aS and imaged with a fluorescence wide-field microscope (Fig. S2A) and a confocal fluorescence microscope (Fig. S2B). aS oligomers and small aggregates are present in aS-overexpressing cells (11–13, 18, 45), but their dimensions are below the optical resolution of these microscopy techniques. In fact, in vitro measurements for aS oligomers were performed with different techniques and showed that oligomeric species are typically between 5 and 50 nm (10). Conversely, larger aS inclusions are clearly observed in the cytoplasm of the cells treated with seeds. These large aggregates are LB-like, based on the fibrillar aS presence, aS phosphorylation, and ubiquitination (17).
We used the phasor approach to FLIM (32), to identify and quantify the ratio of free:bound NADH intrinsic autofluorescence in relation to aS overexpression and aggregation in living cells. The phasor approach to FLIM produces a phasor plot where the fluorescence emission decay at each pixel of an image is represented in a 2-dimensional histogram of coordinates (g and s), in which every molecular species can be identified by its position (36). NADH has either a short or long lifetime component depending on whether it is free or protein bound. In cells, protein-bound NADH is characterized by a complex multiexponential lifetime decay that has been related to its binding to different enzymes, such as malate dehydrogenase and LDH (38). More importantly, phasor FLIM of NADH has been demonstrated to be a robust method to evaluate free and bound NADH fractions in living cells and tissues (36, 42).
In Fig. 1A, the autofluorescence intensities for HEK293-empty, HEK293-aS cells, and HEK293-seeds are shown. The phasor transformation of the FLIM image was performed to obtain the g and s coordinates of each pixel in the phasor plot (32). Figure 1C corresponds to the typical phasor FLIM signature from the multiexponential lifetime distribution of NADH in live cells (36). The wide lifetime distribution gives a characteristic elongated pattern that reflects a mixture of free and bound NADH. Figure 1B shows the relative concentration of free and bound NADH within the cells, according to the location of the FLIM phasor of these species (36). The FLIM map (Fig. 1B) uses a color scale to show the different relative concentrations of free-to-bound NADH through a lifetime-based discrimination (the longer lifetime in red, the shorter in blue).
Figure 1.
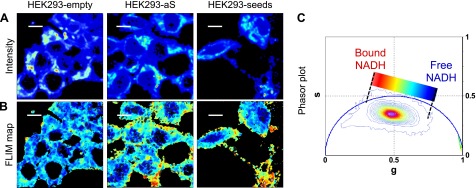
A) Two-photon fluorescence intensity images [color scale in arbitrary units (a.u.)] for HEK293 cells transfected with the empty vector (HEK293-empty; left panel), aS (HEK293-aS; middle panel), and aS plus seeding (HEK293-seeds; right panel). B) FLIM maps corresponding to the same region of interest of (A). The color scale represents different relative concentrations of free-to-bound NADH according to the linear cursor in the phasor plot (C). C) Phasor plot histogram represents the distribution of lifetimes in every pixel for 6 images for each sample. Color scale of the linear cursor goes from blue, corresponding to free NADH, to red, corresponding to bound NADH. Scale bars, 30 μm.
The NADH FLIM maps and the corresponding phasor plot (Fig. 1B, C, respectively) show a decrease in the value of the ratio free:bound NADH upon aS overexpression. An analogous variation is observed when aS-overexpressing cells are additionally treated with seeds. Several spots with higher concentrations of bound NADH (red/orange color in Fig. 1B, last panel ) are localized within the HEK293-aS cells, but they are absent in the control, meaning that this effect is induced by aS oligomerization or fibril formation. We ask whether this variation in NADH lifetime is due to a direct interaction of NADH molecules with aS aggregates or to an indirect effect due to aS aggregate-induced toxicity, which most likely affects mitochondria, or a combination of the 2. Further experiments on aS aggregation in the presence of NADH were performed in vitro to address this point and will be discussed later.
In Fig. 2, microscopy images of the 2 different aS aggregation conditions (HEK293-aS and HEK293-seeds) are presented with the corresponding phasor plot. The phasor FLIM distribution is characterized by a bimodal distribution of bound NADH (red and green cursors in the plot), which highlights different regions mainly at the cellular membrane. This result suggests the presence in the cell of multiple populations of NADH bound to different proteins and/or to the same protein in different aggregation states. Interestingly, bound NADH species having an increased lifetime are mainly localized in the cellular membranes.
Figure 2.

A) Zoomed-in fluorescence intensity images of a region of HEK293-aS and HEK293-seed cells. B) FLIM map corresponding to the phasor plot on the right (C), where the pixels selected with the green and the red cursors represent 2 different populations of NADH-bound species with longer lifetimes and localized at the membranes. Our interpretation suggests that these are the aS aggregates bound to NADH. Scale bars, 5 μm.
To quantify the difference in the NADH fingerprint at the single cell level, we calculated the cell phasor [i.e., the average values for the phasor plot coordinates g and s of each pixel in a cell (36)]. Figure 3 shows the average g and s coordinates for the cells overexpressing aS and for the control, both for the whole cell and for the cytoplasm (Fig. 3A, B, respectively). The average g and s values correspond to the average NADH lifetime in the whole cell or in the cell cytoplasm. Two populations can be identified in the scatter plot, and the difference in terms of g values is statistically significant, as shown via t test (P = 6.6 × 10⁻⁷). There is still an overlap between the 2 populations that is most likely due to those cells in the aS-transfected cell ensemble that are not overexpressing aS because the transfection efficiency is ∼30% for HEK293 cells transfected with pCDNA-aS in our experimental conditions.
Figure 3.

A and B) Scatter plot of the NADH cell phasor FLIM fingerprint from HEK293-empty and HEK293-aS cell samples. Each point represents the average phasor value corresponding to the average value of g and s coordinates, in an individual cell of the 2 samples, being g and s the coordinates of each pixel in the phasor plot. In (A), the average phasor value is calculated for the whole cell and, in (B), only for the cell cytoplasm. C and D) Scatter plot of the phasor FLIM signature of cells in the HEK293-empty and HEK293-seed samples. Each point is obtained as explained above, and (C) and (D) correspond to the analysis performed on whole cells or for cell cytoplasm, respectively.
The separation between the 2 populations is more significant in terms of g coordinates (P = 5.7 × 10⁻¹³), when the average lifetime is calculated only for pixels within the cytoplasm. The NADH fluorescence signal in the cytoplasm comes mainly from mitochondrial NADH, where its concentration is higher. Figure 3 shows the scatter plots for g and s coordinates of HEK293-seeds, for the whole cells (Fig. 3C) and the cell cytoplasm (Fig. 3D), compared to the control (HEK293-empty). The 2 populations of cells seem to be more similar than in the previous case, when HEK293-aS cells were compared to HEK293-empty. The t test showed a significant difference but gave a P = 0.003 for the whole-cell average NADH lifetime value, and P = 0.0004 for the values estimated for the cell cytoplasm. Moreover, the t test performed on the cell cytoplasm values for the 2 aS aggregation models (HEK293-aS and HEK293-seeds) is statistically significant (P < 0.001), suggesting that aS overexpression and the consequent oligomer formation in live cells affect bound and free NADH pools in a different way than for the scenario in which large inclusions are formed in the cells upon seed treatment.
In vitro characterization of free and bound NADH fractions in the presence of aggregated aS using phasor approach to FLIM
To investigate whether species having longer NADH fluorescence lifetimes (∼>3.2 ns), are present when NADH is incubated with monomeric aS or with aS aggregates, and whether the longer lifetime could derive from a direct interaction between NADH and aS, we performed an in vitro assay. NADH in solution, NADH and monomeric aS, NADH and LDH, and aS fibrils obtained in the presence of NADH were all imaged to evaluate NADH lifetime. FLIM analysis was performed on the 4 samples, and the results are summarized in Fig. 4. Free NADH (red cursor in the image) and LDH-NADH (green cursor) are located in the phasor plot as expected and as previously published (36). Monomeric aS (pink cursor in Fig. 4) does not induce a variation in NADH lifetime; conversely, a strong variation is caused by aS fibril formation (orange cursors in Fig. 4A). We suggest that an NADH molecule can be sequestered into an aS oligomeric species and amyloid fibrils, changing its fluorescence properties upon binding and/or coaggregation.
Figure 4.

A) In this phasor plot, the position of the lifetimes corresponding to different NADH-containing solutions is represented: free-NADH (red cursor) and NADH bound to LDH (green cursor) as references; monomeric aS (pink cursor) and NADH solution; and aS aggregated in the presence of NADH (orange cursor). Both the samples presenting aS show a variation in NADH fluorescence lifetime toward values corresponding to bound NADH. B) Phasor plot corresponding to aS aggregated in the presence of NADH solution; it shows a broadened distribution accounting for different molecular species, probably aS oligomers or aggregates that sequester NADH and change its fluorescence properties. C) NADH fluorescence intensity (color scale in a.u.) of aS aggregated in the presence of NADH solution is shown. D) In the selection map, the red pixels selected in the phasor plot with the red cursor represent the free NADH, whereas the orange pixels correspond to the large and bright aS aggregates in the intensity map with bound NADH. Scale bars, 30 μm.
Figure 4B shows the NADH lifetime distribution in the phasor plot obtained for the aS aggregated in the presence of NADH. Figure 4B also shows how the NADH-containing aggregating species in solution are characterized by a broad range of lifetimes, ranging from the value corresponding to free NADH to the one that was assigned to aS fibrils in Fig. 4A. Using the orange selection cursor in Fig. 4B, we highlighted the NADH bound to aS aggregates (Fig. 4D), which correspond to large brighter spots that we showed by TEM to be aS fibrils in the intensity image (Fig. 4C) (Supplemental Fig. S3: TEM images show micrometer-long aS fibrils whose morphology is typical of amyloid fibrils).
Spectral characterization of NADH fluorescence in the presence of aggregated aS
To further characterize the differences in NADH properties in the presence of monomeric aS or when aS is aggregated with NADH, we performed spectral phasor analysis. This method is based on the idea of transforming the information contained in a fluorescence spectrum of a single pixel in the spectral image into a coordinate to be plotted in an x-y axis system, namely the spectral phasor plot (37). The position of the point in the spectral phasor is associated with the wavelength at the maximum of the spectrum (the angle) and to the spectrum width, which is inversely related to the radial position of the phasor. As it is shown in Fig. 5A, the spectral distributions corresponding to NADH solution and to LDH-bound NADH can be easily distinguished in the spectral phasor plot, which is in good agreement with the fact that the spectrum maximum of NADH depends on its state (free or bound). Figure 5 reports also the spectral phasor plot (Fig. 5B) for NADH in solution with monomeric aS and for the sample containing aS aggregated in the presence of NADH (Fig. 5C). The distribution in the spectral phasor plot allows the determination of the emission maximum for each sample and the spectral width. For free NADH, λmax is 480.5 nm, and the width is 46.2 nm, whereas for NADH in the presence of monomeric aS, λmax is 481.5 nm with a width of 43.4 nm. In Fig. 5A, B, the spectral phasor plots include all the pixels from the image. Figure 5C presents values above an intensity threshold set to eliminate free NADH fluorescence signal to obtain a sharper pixel distribution in plot. This analysis allowed for calculating the spectrum maximum for NADH molecules that coaggregated with aS (i.e., λ is 476.6 and width is 47.5 nm). The shift of the spectrum maximum to a shorter wavelength in comparison to free NADH is in good agreement with what has been reported for the spectral variation of NADH upon binding to several proteins (46).
Figure 5.

Spectral phasor plot of free NADH in solution and LDH-bound NADH (A), monomeric aS mixed with NADH in solution (B), and of NADH aggregated with aS for 2 weeks, with the associated selection map (C). The 360° angle corresponds to the spectral range observed (from 416.32 to 727.65 nm), and the position of the pixel distribution in the spectral phasor plot corresponds to the maximum of the fluorescence spectra in each condition when fit with a Gaussian profile. In the case of NADH aggregated with aS, to obtain a less noisy pixel distribution in the spectral phasor, a threshold was selected to eliminate part of the contribution due to free NADH, and the pixels selected to obtain the estimated value for the maximum of NADH spectrum when NADH was aggregated with aS were those corresponding to the aS aggregates in the Selection map.
From these data, it is clear that aS oligomerization and aggregation in vitro cause a shift in the maximum fluorescence emission spectra of NADH.
NMR measurement of NADH bound to aS aggregation products
To independently validate NADH direct binding to aS aggregates, we performed in vitro NMR binding experiments using 2 different NMR ligand-based approaches. Different aliquots of a sample of recombinant aS (5 μM) were incubated in a thermoshaker at 37°C and 1000 rpm. 1H NMR spectra were recorded on aS aliquots at different incubation times to monitor protein signal. NADH was then added to these aS aliquots and WaterLOGSY (47), and R2 filter (transversal relaxation times) experiments (48) were run on the mixtures to monitor the binding ability of NADH (100 μM) to aS at the diverse protein aggregation stages.
Under the experimental conditions described above, NADH 1H NMR signal variation, both in the WaterLOGSY and R2 filter spectra, was observed only for samples after 12 days (T3) of protein incubation (Fig. 6), suggesting binding to the aggregation products of aS. Only the NMR signals in the 8.0–8.5 parts per million region, which correspond to the 2 ring protons of the adenine of the NADH molecule, are reported for clarity. For the samples after 22 days (T5) of protein incubation, a greater binding of NADH is observed, evidenced by a 2-fold decrease of the R2 filter signals and an almost complete disappearance of the WaterLOGSY signals. NADH added to aS incubated for 33 days (T7) is not bound.
Figure 6.

One-dimensional WaterLOGSY (left panel) and R2 filter (right panel) spectra recorded for NADH (100 μM) in the absence (black) or presence (red) of aS aliquots incubated (5 µM at 37°C at 1000 rpm) for different time periods: T0 (no incubation), T3 (12 days), T5 (22 days), and T7 (33 days).
The 1D 1H spectra recorded on the aS samples show that the protein folding is altered during incubation (Supplemental Fig. S4). To investigate the aggregation state of aS in the NMR samples, TEM images were collected from specimens prepared after recording NMR spectra. The presence of oligomeric species was observed for samples prepared from aS incubated for at least 1 week. The NMR samples obtained from aS incubated for 1 mo showed the presence of mature aS fibrillar structures (Supplemental Fig. S5).
There were 5 fluorinated molecules (see Materials and Methods) also mixed with aS at different incubation stages to determine whether any compound other than NADH could indiscriminately bind to aS (control). The presence of fluorine allowed us to detect the potential binding to aS through 19F NMR R2 filter experiments (49, 50), which are significantly more sensitive than the experiments based on proton detection. Two molecules bound to aS after 22 days (T5), similar to the behavior found for NADH, whereas 3 molecules bound after 33 days (T7). NADH binding is significantly reduced at this stage (Supplemental Fig. S6).
After 33 days (T7) of protein incubation, when fibrillar aS structures are seen in the TEM images, NADH binds poorly to aS compared to the binding to the protein incubated for 22 days (T5), when the fibrillar aS structures are less evident. The fluorinated species, however, bind to aS both after 22 and 33 days of protein incubation. The observed behavior supports the idea that NADH is able to significantly bind to aS in a state that precedes mature fibrils and large aggregate formation (12–22 days of protein incubation), whereas no binding of NADH can be observed when only monomeric aS is present or aS fibrils are at an advanced stage of formation. On the contrary, we observed binding of the nonspecific fluorinated compounds to aS only when the formation of the fibrils is advanced [i.e., it is most likely that the presence of aS fibrils favors an unspecific interaction of the planar fluorinated molecules with aS aggregates (Supplemental Fig. S6), whereas when monomeric does not bind the fluorinated molecules]. These observations are consistent with the structural homologies of these molecules with Thioflavin T (see Supplemental Fig. S7), a well-known intercalator of amyloid fibrils.
DISCUSSION
The difference in fluorescence lifetime of intracellular NADH has been used in the past to discriminate between the bound fraction (mainly in mitochondria) and the free NADH (mainly in the cytoplasm) of cells (36, 42, 51, 52). The data presented here show that the fluorescence properties of NADH in a cell allow us to use this molecule as an endogenous reporter for protein aggregation and/or oxidative stress. The rationale for this approach is that a decrease in the value of the free:bound NADH ratio in a living cell can be correlated with an increase in the value of the NAD+:NADH ratio (31), which in turn depends on, among others things, oxidative stress and mitochondrial damage.
Here, we observed an average increase in NADH lifetime in live cells upon aS overexpression. The HEK293-aS cellular model is characterized by the formation of aS oligomeric species, which cannot be detected with conventional microscopy techniques but can be observed using advanced imaging methods (11, 12, 18, 45).
To monitor aS overexpression and aggregation effects on cellular metabolism, we measured the NADH fluorescence lifetime in live cells. HEK293-aS cells in which aS is overexpressed presented an increased fraction of bound NADH, as detected from the increase in the average NADH lifetime compared to control cells. This potential probe of aS status in cells will now be discussed as to the possible mechanisms that govern its behavior.
A robust correlation has been described in the literature between aS oligomerization and oxidative stress (22, 53), but the cause-and-effect relationship between the protein oligomerization and the mechanism that leads to reactive oxygen species production is still not completely defined. Among the aS aggregation products, oxidative stress seems to be induced mainly by aS oligomers (22, 30, 53, 54). In our HEK293-aS cell model, the aS oligomeric forms cause a decrease in the NADH:NAD+ ratio, which is reflected in these measurements by the decrease of the free:bound NADH ratio. Accordingly, it was reported that oxidative stress (generated by H2O2) treatment can lead to a detectable effect on the free and bound NADH pool in live cells (52).
Another possible cause for the observed increase of oxidative stress in HEK293-aS is that aS oligomers directly damage mitochondria (23, 25) or act through indirect pathways leading to mitochondrial dysfunction (26–30). Alterations in mitochondrial function induced by aS oligomers may contribute to oxidative stress that again is measured here as a variation in the free:bound NADH ratio.
Although HEK293-aS cells present an increased number of aS and aS oligomeric species, HEK293-seed cells show large aS inclusions (fibrils) whose formation is triggered by seeds. These large LB-like aggregates (17) are clearly observed in confocal microscopy images (Supplemental Fig. S1). The difference between the free:bound NADH ratio in this model compared to the control HEK293-empty is barely statistically significant; however, the variation between the 2 cellular populations in terms of the free:bound NADH ratio is much lower than the value observed for HEK293-aS cells.
One possible reason for the observed differences between HEK293-aS and HEK293-seed models is that aS oligomeric species, formed upon aS overexpression and responsible for oxidative stress in the HEK293-aS model, are recruited by aS seeds to build fibrils and inclusions in HEK293-seeds. The recruiting reduces the number of aS oligomers in the cell cytoplasm of HEK293-seeds and could account for reduced oxidative stress compared to HEK293-aS cells.
A second possibility is that the measured increase of NADH fluorescence lifetime in the HEK293-aS model is ascribed to aS aggregates that directly bind NADH, causing an increase in NADH fluorescence lifetime as demonstrated for other protein-NADH complexes (55). To determine whether the variation in NADH fluorescence properties in HEK293-aS and/or HEK293-seeds may be due to the sequestration of NADH by aS oligomers or aggregates, we performed in vitro aS aggregation experiments in the presence of NADH. By applying phasor FLIM analysis to measurements performed in solution on aS fibrils obtained in the presence of NADH, we found bound NADH, which is associated with longer lifetime values that are in good agreement with the lifetimes measured in our cellular models for aS aggregation. Therefore, we suggest that bound NADH lifetime values observed in HEK293-seeds could be at least in part associated with fibril-bound NADH in live cells.
The spectral phasor approach applied to the study of the same sample showed that not only is NADH lifetime affected by aS aggregation, but so are the NADH spectra. In particular, there is a shift of 4 nm of the spectrum maximum toward shorter wavelengths, from 480.5 nm for the free NADH to 476.6 nm for the NADH-aS fibrils.
An independent piece of in vitro evidence that oligomeric/early fibrillar forms of aS are the species competent to bind NADH was provided by the NMR experiments that ruled out a direct interaction with the monomeric form, the late mature fibrils, or the large bundles of aS fibrils that can form in vitro at the latest stages of the aggregation process. The result obtained in vitro from analyzing aS aggregates is in agreement with the data presented by Büchner et al. (56), which reported a shift of the maximum NADH spectrum measured in brain slices of a murine model for Alzheimer’s disease (λmax, 459 nm) compared to free NADH in solution (λmax, 469 nm). In this APP23 mouse model, the NADH spectrum shift associated with an impairment of energy metabolism occurred in presymptomatic animals. As in our in vitro experiments, the NADH spectral property variation was assigned to the presence of amyloid-β aggregates. Another point that deserves mention in relation to the interpretation of the data is that amyloid-β oligomers have been reported to induce oxidative stress in the APP23 mouse model (57). An interesting hypothesis is that this oxidative stress may also contribute to the observed variation in the NADH spectrum in the APP23 mouse model because redox-active aS oligomers affected NADH fluorescence lifetime properties in our HEK293-aS. Overall, these observations suggest that the decrease in the free:bound NADH ratio (i.e., in the NADH:NAD+ ratio) may be a common feature of different neurodegenerative disorders associated with both oxidative stress and protein aggregation.
The results obtained in vitro support the hypothesis that the variation in NADH fluorescence properties observed in aS aggregation cellular models may be due to NADH sequestration by aS aggregates. However, aS overexpression in HEK293 cells leads to an average protein concentration that is on the order of 1 μM, and the seed concentration used to treat HEK293 cells is 1 μM, whereas the total NADH concentration in cells is expected to be in the range of millimolars. Given these concentration values, it seems implausible to completely ascribe the variation in NADH fluorescence lifetime in cells to the sequestration of NADH by aS aggregates, which are in lower concentration compared to NADH in live cells. The results obtained in vitro do not exclude that the observed variation in HEK293-seed cells may be partially due to a residual oxidative stress induced by a small fraction of aS oligomers not recruited by amyloid fibril formation.
Variations in NADH fluorescence intensity have been largely used to study cellular metabolism; however, the study of NADH fluorescence lifetime or spectral properties is definitely more reliable, being independent of absolute NADH concentration, sample absorption properties, and light scattering (42, 58, 59). Moreover, the phasor approach to FLIM and to spectral imaging provides a robust fit-free method for data analysis that allows for the first clear evaluation of NADH fluorescence property variation in a cellular model for aS oligomerization (HEK293-aS) and for LB-like formation (HEK293-seeds). As reported here, the in vitro deconstruction of the individual processes that contribute to the in-cell variation of NADH fluorescence properties is useful to prove their presence but does not allow us to reproduce the synergistic effects present in our aS cellular paradigm between aggregation and oxidative stress.
To conclude, the data reported here suggest that NADH autofluorescence properties could be used as label-free endogenous reporters to measure aS-associated oxidative stress as induced by aS oligomerization at early stages of the aggregation process in a cellular model and to measure aS aggregate formation, relying on the ubiquitous presence of the cofactor NADH.
Supplementary Material
Acknowledgments
The authors are very grateful to Professor Richard M. Magliozzo for his precise and insightful critical reading of the manuscript. Part of this work was done with support from U.S. National Institutes of Health Grants P41-GM103540 and P50-GM076516 (to E.G., S.J., and C.S.). The authors acknowledge “Fondazione Ing. Aldo Gini” for funding N.P. at the Laboratory for Fluorescence Dynamics (University of California, Irvine, Irvine, CA, USA).
Glossary
- aS
α-synuclein
- d1
delay time
- FBS
fetal bovine serum
- FLIM
fluorescence lifetime imaging microscopy
- HEK293
human embryonic kidney 293
- LB
Lewy body
- LDH
lactate dehydrogenase
- PD
Parkinson’s disease
- TEM
transmission electron microscopy
- WaterLOGSY
water-ligand observed via gradient spectroscopy
Footnotes
This article includes supplemental data. Please visit http://www.fasebj.org to obtain this information.
REFERENCES
- 1.Clayton D. F., George J. M. (1999) Synucleins in synaptic plasticity and neurodegenerative disorders. J. Neurosci. Res. 58, 120–129 [PubMed] [Google Scholar]
- 2.Clayton D. F., George J. M. (1998) The synucleins: a family of proteins involved in synaptic function, plasticity, neurodegeneration and disease. Trends Neurosci. 21, 249–254 [DOI] [PubMed] [Google Scholar]
- 3.Nemani V. M., Lu W., Berge V., Nakamura K., Onoa B., Lee M. K., Chaudhry F. A., Nicoll R. A., Edwards R. H. (2010) Increased expression of alpha-synuclein reduces neurotransmitter release by inhibiting synaptic vesicle reclustering after endocytosis. Neuron 65, 66–79 [DOI] [PMC free article] [PubMed] [Google Scholar]
- 4.Scott D. A., Tabarean I., Tang Y., Cartier A., Masliah E., Roy S. (2010) A pathologic cascade leading to synaptic dysfunction in alpha-synuclein-induced neurodegeneration. J. Neurosci. 30, 8083–8095 [DOI] [PMC free article] [PubMed] [Google Scholar]
- 5.Scott D., Roy S. (2012) α-Synuclein inhibits intersynaptic vesicle mobility and maintains recycling-pool homeostasis. J. Neurosci. 32, 10129–10135 [DOI] [PMC free article] [PubMed] [Google Scholar]
- 6.Burré J., Sharma M., Tsetsenis T., Buchman V., Etherton M. R., Südhof T. C. (2010) Alpha-synuclein promotes SNARE-complex assembly in vivo and in vitro. Science 329, 1663–1667 [DOI] [PMC free article] [PubMed] [Google Scholar]
- 7.Singleton A. B., Farrer M. J., Bonifati V. (2013) The genetics of Parkinson’s disease: progress and therapeutic implications. Mov. Disord. 28, 14–23 [DOI] [PMC free article] [PubMed] [Google Scholar]
- 8.Hirsch E., Graybiel A. M., Agid Y. A. (1988) Melanized dopaminergic neurons are differentially susceptible to degeneration in Parkinson’s disease. Nature 334, 345–348 [DOI] [PubMed] [Google Scholar]
- 9.Spillantini M. G., Schmidt M. L., Lee V. M., Trojanowski J. Q., Jakes R., Goedert M. (1997) Alpha-synuclein in Lewy bodies. Nature 388, 839–840 [DOI] [PubMed] [Google Scholar]
- 10.Plotegher N., Greggio E., Bisaglia M., Bubacco L. (2014) Biophysical groundwork as a hinge to unravel the biology of α-synuclein aggregation and toxicity. Q. Rev. Biophys. 47, 1–48 [DOI] [PubMed] [Google Scholar]
- 11.Outeiro T. F., Putcha P., Tetzlaff J. E., Spoelgen R., Koker M., Carvalho F., Hyman B. T., McLean P. J. (2008) Formation of toxic oligomeric alpha-synuclein species in living cells. PLoS One 3, e1867. [DOI] [PMC free article] [PubMed] [Google Scholar]
- 12.Roberti M. J., Jovin T. M., Jares-Erijman E. (2011) Confocal fluorescence anisotropy and FRAP imaging of α-synuclein amyloid aggregates in living cells. PLoS One 6, e23338 [DOI] [PMC free article] [PubMed] [Google Scholar]
- 13.Plotegher N., Gratton E., Bubacco L. (2014) Number and brightness analysis of alpha-synuclein oligomerization and the associated mitochondrial morphology alterations in live cells. Biochim. Biophys. Acta 1840, 2014–2024 [DOI] [PMC free article] [PubMed] [Google Scholar]
- 14.Kordower J. H., Chu Y., Hauser R. A., Freeman T. B., Olanow C. W. (2008) Lewy body-like pathology in long-term embryonic nigral transplants in Parkinson’s disease. Nat. Med. 14, 504–506 [DOI] [PubMed] [Google Scholar]
- 15.Luk K. C., Kehm V. M., Zhang B., O’Brien P., Trojanowski J. Q., Lee V. M. (2012) Intracerebral inoculation of pathological α-synuclein initiates a rapidly progressive neurodegenerative α-synucleinopathy in mice. J. Exp. Med. 209, 975–986 [DOI] [PMC free article] [PubMed] [Google Scholar]
- 16.Hansen C., Angot E., Bergström A. L., Steiner J. A., Pieri L., Paul G., Outeiro T. F., Melki R., Kallunki P., Fog K., Li J. Y., Brundin P. (2011) α-Synuclein propagates from mouse brain to grafted dopaminergic neurons and seeds aggregation in cultured human cells. J. Clin. Invest. 121, 715–725 [DOI] [PMC free article] [PubMed] [Google Scholar]
- 17.Luk K. C., Song C., O’Brien P., Stieber A., Branch J. R., Brunden K. R., Trojanowski J. Q., Lee V. M. (2009) Exogenous alpha-synuclein fibrils seed the formation of Lewy body-like intracellular inclusions in cultured cells. Proc. Natl. Acad. Sci. USA 106, 20051–20056 [DOI] [PMC free article] [PubMed] [Google Scholar]
- 18.Roberti M. J., Bertoncini C. W., Klement R., Jares-Erijman E. A., Jovin T. M. (2007) Fluorescence imaging of amyloid formation in living cells by a functional, tetracysteine-tagged alpha-synuclein. Nat. Methods 4, 345–351 [DOI] [PubMed] [Google Scholar]
- 19.McLean P. J., Kawamata H., Hyman B. T. (2001) Alpha-synuclein-enhanced green fluorescent protein fusion proteins form proteasome sensitive inclusions in primary neurons. Neuroscience 104, 901–912 [DOI] [PubMed] [Google Scholar]
- 20.Chinta S. J., Mallajosyula J. K., Rane A., Andersen J. K. (2010) Mitochondrial α-synuclein accumulation impairs complex I function in dopaminergic neurons and results in increased mitophagy in vivo. Neurosci. Lett. 486, 235–239 [DOI] [PMC free article] [PubMed] [Google Scholar]
- 21.Devi L., Raghavendran V., Prabhu B. M., Avadhani N. G., Anandatheerthavarada H. K. (2008) Mitochondrial import and accumulation of alpha-synuclein impair complex I in human dopaminergic neuronal cultures and Parkinson disease brain. J. Biol. Chem. 283, 9089–9100 [DOI] [PMC free article] [PubMed] [Google Scholar]
- 22.Esteves A. R., Arduíno D. M., Silva D. F., Oliveira C. R., Cardoso S. M. (2011) Mitochondrial dysfunction: the road to alpha-synuclein oligomerization in PD. Parkinsons Dis. 2011, 693761. [DOI] [PMC free article] [PubMed] [Google Scholar]
- 23.Nakamura K., Nemani V. M., Wallender E. K., Kaehlcke K., Ott M., Edwards R. H. (2008) Optical reporters for the conformation of alpha-synuclein reveal a specific interaction with mitochondria. J. Neurosci. 28, 12305–12317 [DOI] [PMC free article] [PubMed] [Google Scholar]
- 24.Cole N. B., Dieuliis D., Leo P., Mitchell D. C., Nussbaum R. L. (2008) Mitochondrial translocation of alpha-synuclein is promoted by intracellular acidification. Exp. Cell Res. 314, 2076–2089 [DOI] [PMC free article] [PubMed] [Google Scholar]
- 25.Nakamura K., Nemani V. M., Azarbal F., Skibinski G., Levy J. M., Egami K., Munishkina L., Zhang J., Gardner B., Wakabayashi J., Sesaki H., Cheng Y., Finkbeiner S., Nussbaum R. L., Masliah E., Edwards R. H. (2011) Direct membrane association drives mitochondrial fission by the Parkinson disease-associated protein alpha-synuclein. J. Biol. Chem. 286, 20710–20726 [DOI] [PMC free article] [PubMed] [Google Scholar]
- 26.Mak S. K., Tewari D., Tetrud J. W., Langston J. W., Schüle B. (2011) Mitochondrial dysfunction in skin fibroblasts from a Parkinson’s disease patient with an alpha-synuclein triplication. J. Parkinsons Dis. 1, 175–183 [DOI] [PubMed] [Google Scholar]
- 27.Kamp F., Exner N., Lutz A. K., Wender N., Hegermann J., Brunner B., Nuscher B., Bartels T., Giese A., Beyer K., Eimer S., Winklhofer K. F., Haass C. (2010) Inhibition of mitochondrial fusion by α-synuclein is rescued by PINK1, Parkin and DJ-1. EMBO J. 29, 3571–3589 [DOI] [PMC free article] [PubMed] [Google Scholar]
- 28.Butler E. K., Voigt A., Lutz A. K., Toegel J. P., Gerhardt E., Karsten P., Falkenburger B., Reinartz A., Winklhofer K. F., Schulz J. B. (2012) The mitochondrial chaperone protein TRAP1 mitigates α-Synuclein toxicity. PLoS Genet. 8, e1002488 [DOI] [PMC free article] [PubMed] [Google Scholar]
- 29.Xie W., Chung K. K. (2012) Alpha-synuclein impairs normal dynamics of mitochondria in cell and animal models of Parkinson’s disease. J. Neurochem. 122, 404–414 [DOI] [PubMed] [Google Scholar]
- 30.Nakamura K. (2013) α-Synuclein and mitochondria: partners in crime? Neurotherapeutics 10, 391–399 [DOI] [PMC free article] [PubMed] [Google Scholar]
- 31.Bird D. K., Yan L., Vrotsos K. M., Eliceiri K. W., Vaughan E. M., Keely P. J., White J. G., Ramanujam N. (2005) Metabolic mapping of MCF10A human breast cells via multiphoton fluorescence lifetime imaging of the coenzyme NADH. Cancer Res. 65, 8766–8773 [DOI] [PubMed] [Google Scholar]
- 32.Digman M. A., Caiolfa V. R., Zamai M., Gratton E. (2008) The phasor approach to fluorescence lifetime imaging analysis. Biophys. J. 94, L14–L16 [DOI] [PMC free article] [PubMed] [Google Scholar]
- 33.Tosatto L., Andrighetti A. O., Plotegher N., Antonini V., Tessari I., Ricci L., Bubacco L., Dalla Serra M. (2012) Alpha-synuclein pore forming activity upon membrane association. Biochim. Biophys. Acta 1818, 2876–2883 [DOI] [PubMed] [Google Scholar]
- 34.Hwang T. L., Shaka A. J. (1995) Water suppression that works. Excitation sculpting using arbitrary wave-forms and pulsed-field gradients. J. Magn. Reson. A 112, 275–279 [Google Scholar]
- 35.Dalvit C., Ramage P., Hommel U. (1998) Heteronuclear X-filter 1H PFG double-quantum experiments for the proton resonance assignment of a ligand bound to a protein. J. Magn. Reson. 131, 148–153 [DOI] [PubMed] [Google Scholar]
- 36.Stringari C., Cinquin A., Cinquin O., Digman M. A., Donovan P. J., Gratton E. (2011) Phasor approach to fluorescence lifetime microscopy distinguishes different metabolic states of germ cells in a live tissue. Proc. Natl. Acad. Sci. USA 108, 13582–13587 [DOI] [PMC free article] [PubMed] [Google Scholar]
- 37.Fereidouni F., Bader A. N., Gerritsen H. C. (2012) Spectral phasor analysis allows rapid and reliable unmixing of fluorescence microscopy spectral images. Opt. Express 20, 12729–12741 [DOI] [PubMed] [Google Scholar]
- 38.Yu Q., Heikal A. A. (2009) Two-photon autofluorescence dynamics imaging reveals sensitivity of intracellular NADH concentration and conformation to cell physiology at the single-cell level. J. Photochem. Photobiol. B 95, 46–57 [DOI] [PMC free article] [PubMed] [Google Scholar]
- 39.Heikal A. A. (2010) Intracellular coenzymes as natural biomarkers for metabolic activities and mitochondrial anomalies. Biomarkers Med. 4, 241–263 [DOI] [PMC free article] [PubMed] [Google Scholar]
- 40.Chance B., Cohen P., Jobsis F., Schoener B. (1962) Intracellular oxidation-reduction states in vivo. Science 137, 499–508 [DOI] [PubMed] [Google Scholar]
- 41.Stringari C., Sierra R., Donovan P. J., Gratton E. (2012) Label-free separation of human embryonic stem cells and their differentiating progenies by phasor fluorescence lifetime microscopy. J. Biomed. Opt. 17, 046012 [DOI] [PMC free article] [PubMed] [Google Scholar]
- 42.Stringari C., Edwards R. A., Pate K. T., Waterman M. L., Donovan P. J., Gratton E. (2012) Metabolic trajectory of cellular differentiation in small intestine by Phasor Fluorescence Lifetime Microscopy of NADH. Sci. Rep. 2, 568 [DOI] [PMC free article] [PubMed] [Google Scholar]
- 43.Zipfel W. R., Williams R. M., Christie R., Nikitin A. Y., Hyman B. T., Webb W. W. (2003) Live tissue intrinsic emission microscopy using multiphoton-excited native fluorescence and second harmonic generation. Proc. Natl. Acad. Sci. USA 100, 7075–7080 [DOI] [PMC free article] [PubMed] [Google Scholar]
- 44.Keller J. N., Dimayuga E., Chen Q., Thorpe J., Gee J., Ding Q. (2004) Autophagy, proteasomes, lipofuscin, and oxidative stress in the aging brain. Int. J. Biochem. Cell Biol. 36, 2376–2391 [DOI] [PubMed] [Google Scholar]
- 45.Klucken J., Outeiro T. F., Nguyen P., McLean P. J., Hyman B. T. (2006) Detection of novel intracellular alpha-synuclein oligomeric species by fluorescence lifetime imaging. FASEB J. 20, 2050–2057 [DOI] [PubMed] [Google Scholar]
- 46.Palero J. A., Bader A. N., de Bruijn H. S., der Ploeg van den Heuvel Av., Sterenborg H. J., Gerritsen H. C. (2011) In vivo monitoring of protein-bound and free NADH during ischemia by nonlinear spectral imaging microscopy. Biomed. Opt. Express 2, 1030–1039 [DOI] [PMC free article] [PubMed] [Google Scholar]
- 47.Dalvit C., Pevarello P., Tatò M., Veronesi M., Vulpetti A., Sundström M. (2000) Identification of compounds with binding affinity to proteins via magnetization transfer from bulk water. J. Biomol. NMR 18, 65–68 [DOI] [PubMed] [Google Scholar]
- 48.Dalvit C., Flocco M., Stockman B. J., Veronesi M. (2002) Competition binding experiments for rapidly ranking lead molecules for their binding affinity to human serum albumin. Comb. Chem. High Throughput Screen. 5, 645–650 [DOI] [PubMed] [Google Scholar]
- 49.Dalvit C., Flocco M., Veronesi M., Stockman B. J. (2002) Fluorine-NMR competition binding experiments for high-throughput screening of large compound mixtures. Comb. Chem. High Throughput Screen. 5, 605–611 [DOI] [PubMed] [Google Scholar]
- 50.Dalvit C., Fagerness P. E., Hadden D. T., Sarver R. W., Stockman B. J. (2003) Fluorine-NMR experiments for high-throughput screening: theoretical aspects, practical considerations, and range of applicability. J. Am. Chem. Soc. 125, 7696–7703 [DOI] [PubMed] [Google Scholar]
- 51.Wright B. K., Andrews L. M., Markham J., Jones M. R., Stringari C., Digman M. A., Gratton E. (2012) NADH distribution in live progenitor stem cells by phasor-fluorescence lifetime image microscopy. Biophys. J. 103, L7–L9 [DOI] [PMC free article] [PubMed] [Google Scholar]
- 52.Stringari C., Nourse J. L., Flanagan L. A., Gratton E. (2012) Phasor fluorescence lifetime microscopy of free and protein-bound NADH reveals neural stem cell differentiation potential. PLoS One 7, e48014 [DOI] [PMC free article] [PubMed] [Google Scholar]
- 53.Freeman D., Cedillos R., Choyke S., Lukic Z., McGuire K., Marvin S., Burrage A. M., Sudholt S., Rana A., O’Connor C., Wiethoff C. M., Campbell E. M. (2013) Alpha-synuclein induces lysosomal rupture and cathepsin dependent reactive oxygen species following endocytosis. PLoS One 8, e62143 [DOI] [PMC free article] [PubMed] [Google Scholar]
- 54.Cremades N., Cohen S. I., Deas E., Abramov A. Y., Chen A. Y., Orte A., Sandal M., Clarke R. W., Dunne P., Aprile F. A., Bertoncini C. W., Wood N. W., Knowles T. P., Dobson C. M., Klenerman D. (2012) Direct observation of the interconversion of normal and toxic forms of α-synuclein. Cell 149, 1048–1059 [DOI] [PMC free article] [PubMed] [Google Scholar]
- 55.Jameson D. M., Thomas V., Zhou D. M. (1989) Time-resolved fluorescence studies on NADH bound to mitochondrial malate dehydrogenase. Biochim. Biophys. Acta 994, 187–190 [DOI] [PubMed] [Google Scholar]
- 56.Büchner M., Huber R., Sturchler-Pierrat C., Staufenbiel M., Riepe M. W. (2002) Impaired hypoxic tolerance and altered protein binding of NADH in presymptomatic APP23 transgenic mice. Neuroscience 114, 285–289 [DOI] [PubMed] [Google Scholar]
- 57.Tamagno E., Bardini P., Guglielmotto M., Danni O., Tabaton M. (2006) The various aggregation states of beta-amyloid 1-42 mediate different effects on oxidative stress, neurodegeneration, and BACE-1 expression. Free Radic. Biol. Med. 41, 202–212 [DOI] [PubMed] [Google Scholar]
- 58.Vergen J., Hecht C., Zholudeva L. V., Marquardt M. M., Hallworth R., Nichols M. G. (2012) Metabolic imaging using two-photon excited NADH intensity and fluorescence lifetime imaging. Microsc. Microanal. 18, 761–770 [DOI] [PMC free article] [PubMed] [Google Scholar]
- 59.Yaseen M. A., Sakadžić S., Wu W., Becker W., Kasischke K. A., Boas D. A. (2013) In vivo imaging of cerebral energy metabolism with two-photon fluorescence lifetime microscopy of NADH. Biomed. Opt. Express 4, 307–321 [DOI] [PMC free article] [PubMed] [Google Scholar]
Associated Data
This section collects any data citations, data availability statements, or supplementary materials included in this article.