

Abstract
Obesity is an increasingly prevalent disease regulated by genetic and environmental factors. Emerging studies indicate that immune cells, including monocytes, granulocytes and lymphocytes, regulate metabolic homeostasis and are dysregulated in obesity1,2. Group 2 innate lymphoid cells (ILC2s) can regulate adaptive immunity3,4 and eosinophil and alternatively-activated macrophage responses5, and were recently identified in murine white adipose tissue (WAT)5 where they may act to limit the development of obesity6. However, ILC2s have not been identified in human adipose tissue, and the mechanisms by which ILC2s regulate metabolic homeostasis remain unknown. Here, we identify ILC2s in human WAT and demonstrate that decreased ILC2 responses in WAT are a conserved characteristic of obesity in humans and mice. Interleukin (IL)-33 was found to be critical for the maintenance of ILC2s in WAT and in limiting adiposity in mice by increasing caloric expenditure. This was associated with recruitment of uncoupling protein 1 (UCP1)+ beige adipocytes in WAT, a process known as beiging or browning that regulates caloric expenditure7–9. IL-33-induced beiging was dependent on ILC2s, and IL-33 treatment or transfer of IL-33-elicited ILC2s was sufficient to drive beiging independently of the adaptive immune system, eosinophils or IL-4 receptor signaling. We found that ILC2s produce methionine-enkephalin peptides that can act directly on adipocytes to upregulate Ucp1 expression in vitro and that promote beiging in vivo. Collectively, these studies indicate that in addition to responding to infection or tissue damage, ILC2s can regulate adipose function and metabolic homeostasis in part via production of enkephalin peptides that elicit beiging.
Group 2 innate lymphoid cells (ILC2s) respond to the cytokine interleukin (IL)-333,10,11, and both IL-33 and ILC2s have been implicated in the regulation of metabolic homeostasis in mice5,6,12. To address whether ILCs are present in human WAT or dysregulated in obese patients, we obtained abdominal subcutaneous WAT from non-obese human donors and identified a lineage (Lin)-negative cell population that expresses CD25 (IL-2Rα) and CD127 (IL-7Rα) (Fig. 1a, Supplemental Fig. S1a). This cell population expressed GATA binding protein 3 (GATA-3) and the IL-33 receptor (IL-33R) (Fig. 1b), consistent with ILC2s in other human tissues13,14. A Lin− CD25+ CD127+ cell population that expresses GATA-3 and IL-33R was also identified in epididymal (E)-WAT of mice (Fig. 1c–d). These cells were developmentally dependent on Inhibitor of DNA binding 2 (Id2), Transcription factor 7 (TCF-7) and the common gamma chain (γc) and produced the effector cytokines IL-5 and IL-13 (Supplemental Fig. S2b–e), similar to murine ILC2s as described previously3,5,10,11,14,15.
Figure 1. Human and murine white adipose tissue contains group 2 innate lymphoid cells that are dysregulated in obesity.

(a) Identification of lineage (Lin)-negative CD25+ CD127+ innate lymphoid cells (ILCs) in human abdominal subcutaneous white adipose tissue (WAT). Pre-gated on live CD45+ Lin− cells that lack CD3, CD5, TCRαβ, CD19, CD56, CD11c, CD11b, CD16, and FcεRIα. (b) Histograms of GATA-3 and IL-33R expression by human WAT ILCs (line). Shaded histogram, isotype control. (c) Identification of Lin− CD25+ CD127+ ILCs in murine epididymal (E)-WAT. Pre-gated on live CD45+ Lin− cells that lack CD3, CD5, CD19, NK1.1, CD11c, CD11b and FcεRIα. (d) Histograms of GATA-3 and IL-33R expression by murine E-WAT ILCs (line). Shaded histogram, isotype control. (e) Representative plots and (f) frequencies of human WAT ILC2s from donors stratified into non-obese (body mass index [BMI]<30.0 kg/m2, n=7) and obese (BMI≥30.0 kg/m2, n=7) groups. (g) Representative plots and frequencies of murine E-WAT ILC2s from mice fed a control diet (CD, 10% kcal fat, n=5) or high fat diet (HFD, 45% kcal fat, n=4) for 12 weeks. (h) Numbers of murine ILC2s/gram E-WAT in mice fed a CD (n=8) or HFD (n=6) for 12 weeks. Student’s t-test, *P<0.05, **P<0.01, ***P<0.001.
We compared ILC2 frequencies in abdominal subcutaneous WAT from non-obese versus obese donors (Supplemental Table S1). WAT from obese donors exhibited decreased frequencies of ILC2s compared to non-obese controls (Fig. 1e–f). The obese group was enriched in older females compared to the non-obese group, but age and sex did not explain the difference in ILC2 frequencies between obese and non-obese donors (Supplemental Fig. S1f–g). To test whether ILC2s in WAT are also dysregulated in murine obesity, mice were fed a control diet (CD) or high fat diet (HFD). HFD-induced obese mice exhibited decreased frequencies and numbers of ILC2s in E-WAT compared to CD-fed controls (Fig. 1g–h). Together, these data suggest that decreased ILC2 populations in WAT is a conserved characteristic of obesity in mice and humans.
We employed IL-33-deficient mice to test whether endogenous IL-33 regulates ILC2 responses and the development of obesity. Il33−/− mice exhibited decreased basal frequencies and numbers of ILC2s in E-WAT and inguinal (i)WAT compared to Il33+/+ controls (Fig. 2a–c, Supplemental Fig. S2a), and expression of IL-5 and IL-13 by WAT ILC2s was decreased in Il33−/− mice compared to controls (Supplemental Fig. S2b). Notably, when fed a normal diet, mice lacking IL-33 gained more weight, accumulated more E-WAT and iWAT and had increased adipocyte size and whole-body adiposity compared to controls (Fig. 2d–f, Supplemental Fig. S2c). In addition, Il33−/− mice exhibited dysregulated glucose homeostasis as evidenced by fasting euglycemic hyperinsulinemia, increased HOMA-IR values and impaired glucose and insulin tolerance (Supplemental Fig. S2d–h). Together, these results indicate that endogenous IL-33 is required to maintain normal ILC2 responses in WAT and to limit the development of spontaneous obesity.
Figure 2. IL-33 critically regulates ILC2 responses in white adipose tissue and limits adiposity.
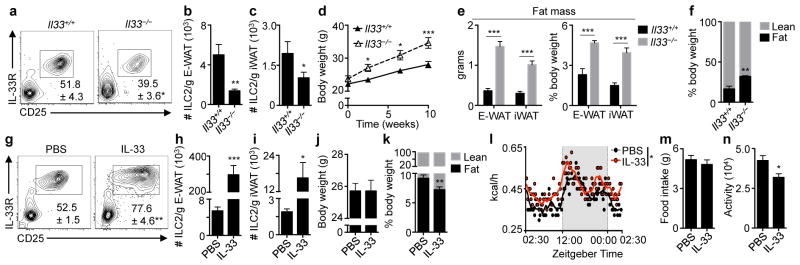
(a–f) Il33+/+ (n=6) or Il33−/− (n=5) mice were fed a low fat diet (10% kcal fat) for 12 weeks starting at 7 weeks of age. (a) Frequencies and (b) numbers of live CD45+ Lin− CD25+ IL-33R+ ILC2s in epididymal (E)-WAT. Plots pre-gated on CD45+ Lin− cells that lack CD3, CD5, CD19, NK1.1, CD11c, CD11b and FcεRIα. (c) Numbers of ILC2s in inguinal (i)WAT. (d) Body weight, first 10 weeks of feeding. (e) Absolute and relative E-WAT and iWAT weights. (f) Body composition. (g–n) Wildtype mice were treated with phosphate buffered saline (PBS, n=10) or recombinant murine IL-33 (12.5 μg/kg/day, n=12) by intraperitoneal injection for 7 days. (g) Frequencies and (h) numbers of ILC2s in E-WAT. (i) Numbers of ILC2s in iWAT. (j) Body weight and (k) body composition. (l) Caloric expenditure over a 24-hour period, days 6-to-7 of treatment. Non-shaded area, lights on. Shaded area, lights off. (m) Food intake and (n) total activity (beam breaks) over the 24-hour period in (L). Student’s t-test or ANOVA with repeated measures. *P<0.05, **P<0.01, ***P<0.001.
In contrast, wildtype mice treated with recombinant murine (rm)IL-33 exhibited increased accumulation ILC2s in E-WAT and iWAT (Fig. 2g–i). Although body weight did not differ between groups (Fig. 2j), mice treated with rmIL-33 had decreased adiposity and increased lean mass compared to controls (Fig. 2k). Remarkably, HFD-fed mice treated with rmIL-33 displayed increased E-WAT ILC2 numbers in association with decreased body weight and fat mass and improved glucose homeostasis compared to HFD-fed mice treated with PBS (Supplemental Fig. S3a–f). These beneficial metabolic effects are consistent with studies showing a protective role for IL-33 in obesity12 and may be related to obesity-associated pathologies such as atherosclerosis that are limited by IL-33.16
To examine the mechanisms by which IL-33 regulates adiposity, we assessed energy homeostasis in control and rmIL-33-treated mice. Treatment of mice with rmIL-33 for 7 days resulted in increased caloric expenditure compared to controls (Fig. 2l). Food intake was unchanged following chronic rmIL-33 treatment (Fig. 2m), and the absence of hyperphagia in the setting of increased caloric expenditure appeared to be related to decreased activity (Fig. 2n, Supplemental Fig. S4a). However, rmIL-33 did not appear to have direct suppressive effects on food intake or activity levels (Supplemental Fig. S4b–d). These data suggest that increased caloric expenditure following 7 days of rmIL-33 could not be explained by the thermic effect of food or physical activity levels but was regulated by other physiologic processes.
An emerging cell type that is critical for regulating caloric expenditure is the beige adipocyte (also known as brite, brown-like or inducible brown adipocyte)7,9,17,18. These specialized adipocytes produce heat by uncoupling energy substrate oxidation from ATP synthesis7,17,18, a thermogenic process that expends calories and is dependent on Uncoupling protein 1 (UCP1)8,17. Previous work has linked brown and beige adipocyte function to the prevention of weight gain in mice and humans9,19–21. To test whether IL-33 regulates beiging, we examined WAT morphology of Il33+/+ versus Il33−/− mice. iWAT from Il33+/+ mice exhibited unilocular white adipocytes with interspersed paucilocular beige adipocytes that have multiple small lipid droplets and increased UCP1+ cytoplasm (Fig. 3a). In contrast, iWAT from Il33−/− mice had scant beige adipocytes (Fig. 3b) and increased white adipocyte size compared to controls (Fig. 3a–b, Supplemental Fig. S2c). Expression of Ucp1 was also lower in iWAT of Il33−/− mice compared to controls (Fig. 3c), suggesting that IL-33 may be a critical regulator of beiging. Consistent with this, mice treated with rmIL-33 exhibited increased UCP1+ beige adipocytes and elevated expression of Ucp1 mRNA in E-WAT and iWAT (Fig. 3d–f) compared to controls, indicating that IL-33 can promote beiging of WAT. Notably, the stimulatory effect of rmIL-33 treatment on UCP1 expression was restricted to WAT and was not observed in brown adipose tissue (BAT) (Supplemental Fig. S5a–e).
Figure 3. IL-33 and ILC2s contribute to beiging of white adipose tissue.

(a–c) Il33+/+ (n=6) or Il33−/− (n=5) mice were fed a low fat diet (10% kcal fat) for 12 weeks starting at age 7 weeks. Uncoupling protein 1 (UCP1) immunohistochemistry (IHC) in iWAT from (a) Il33+/+ or (b) Il33−/− mice. Scale bars, 100 μm. (c) Ucp1 transcript levels in iWAT. (d–f) Wildtype mice were treated with PBS or recombinant murine IL-33 (12.5 μg/kg/day) by intraperitoneal injection for 7 days. (d) E-WAT and (e) iWAT UCP1 IHC. Scale bars, 100 μm. (f) Ucp1 transcript levels in E-WAT and iWAT. (g–k) Sort-purified CD45.1+ ILC2s (105) from E-WAT of IL-33-treated mice were transferred into 12-week-old CD45.2+ wildtype recipients by subcutaneous and intraperitoneal injection daily for 4 days (PBS, n=8; ILC2, n=8 except panel K). (g) Representative plots identifying donor and recipient ILC2s. Plots pre-gated on live CD45+ Lin− CD25+ IL33R+ cells. Lineage cocktail: CD3, CD5, CD19, NK1.1, CD11c, CD11b and FcεRIα. (h) Total numbers of ILC2s per gram iWAT. (i) iWAT UCP1 IHC, bar 100 μm. (j) Ucp1 expression in iWAT. (k) iWAT oxygen consumption. PBS, n=14; ILC2, n=15. (l–m) Sort-purified congenic CD45.1+ ILC2s (105) from E-WAT of IL-33-treated mice were transferred into Rag2−/− γc−/− mice once by intraperitoneal injection. ILC2-sufficient Rag2−/− mice, ILC2-deficient Rag2−/− γc−/− mice and ILC2-reconstituted Rag2−/− γc−/− mice were treated with PBS or recombinant murine IL-33 (12.5 μg/kg/day) by intraperitoneal injection for 7 days (n=4 mice/group). (l) ILC2 numbers per gram E-WAT. (m) Ucp1 expression in E-WAT. Student’s t-test or two-way ANOVA. *P<0.05, **P<0.01, ***P<0.001.
To test whether IL-33-elicited ILC2s promote beiging, congenic CD45.1+ ILC2s from E-WAT of IL-33-treated donor mice were sort-purified and transferred into wildtype CD45.2+ recipient mice (Supplemental Fig. S6a). CD45.1+ donor ILC2s could be identified in iWAT (Fig. 3g) and E-WAT (Supplemental Fig. S6b) of mice that received ILC2s but not control mice that received PBS, and total ILC2 numbers were significantly increased in iWAT of mice receiving CD45.1+ ILC2s compared to controls (Fig. 3h). Transferred ILC2s could not be identified in BAT, mesenteric lymph nodes or lung (Supplemental Fig. S6b), indicating selective accumulation of WAT-derived ILC2s in WAT of recipient mice. Transfer of ILC2s was associated with increased UCP1+ beige adipocytes, augmented expression of Ucp1 and elevated oxygen consumption in iWAT (Fig. 3i–k).
To test whether IL-33 promotes beiging of WAT in an ILC2-dependent manner, we treated ILC2-deficient Rag2−/− γc−/− mice with IL-33 in the presence or absence of adoptively transferred congenic ILC2s (Supplemental Fig. S6c). Rag2−/− γc−/− mice supported accumulation and IL-33-induced population expansion of transferred E-WAT-derived ILC2s in host E-WAT (Fig. 3l, Supplemental Fig. S6d). IL-33 treatment increased expression of Ucp1 in E-WAT of ILC2-sufficient Rag2−/− controls but not ILC2-deficient Rag2−/− γc−/− mice treated with IL-33 (Fig. 3m). Strikingly, rmIL-33-induced increases in expression of Ucp1 and beiging were restored in ILC2-reconstituted Rag2−/− γc−/− mice (Fig. 3m, Supplemental Fig. S6e). Collectively, these results indicate that IL-33-induced beiging of WAT requires a γc-dependent cell population and that ILC2s are sufficient to rescue this defect, suggesting that IL-33-induced beiging is critically dependent on ILC2s.
ILC2s have been shown to promote the eosinophil/IL-4Rα/alternatively-activated macrophage (AAMac) pathway that can elicit beiging through IL-4Rα-dependent production of norepinephrine by AAMacs5,22–24. In addition, regulatory T (Treg) cells in WAT are known to be critical for regulating glucose homeostasis in mice25 and are increased following rmIL-33 treatment (Supplemental Fig. S3g–h). Therefore, we sought to test whether the IL-33/ILC2 pathway could promote beiging in the absence of eosinophils, IL-4Rα or the adaptive immune system. Remarkably, delivery of rmIL-33 to DblGata1 (eosinophil-deficient), Il4ra−/− or Rag2−/− mice elicited beiging of WAT (Fig. 3m, Supplemental Fig. S7a–f), and transfer of IL-33-elicited ILC2s to DblGata1, Il4ra−/− or Rag1−/− mice resulted in accumulation of ILC2s in iWAT and recruitment of UCP1+ beige adipocytes (Supplemental Fig. S7g–l). Therefore, while eosinophils, AAMacs and adaptive immune cells may contribute to optimal beiging under some physiologic settings, these data indicate that the IL33/ILC2 axis can promote beiging independently of the eosinophil/IL-4Rα/AAMac pathway and the adaptive immune system.
Obesity is associated with both decreased ILC2s (Fig. 1) and defective beige adipocytes5,9,21. To address whether ILC2s produce factors that could directly regulate beiging, we employed genome-wide transcriptional profiling of ILC2s versus group 3 ILCs (ILC3s) to compare gene expression enrichment scores of 69 genes previously linked to human obesity (Supplemental Table S2)26,27. This identified one gene, proprotein convertase subtilisin/kexin type 1 (Pcsk1) (also known as prohormone convertase 1 [PC1]), to be significantly enriched in ILC2s but not ILC3s (Fig. 4a, P<0.01). PCSK1 is an endopeptidase involved in processing some prohormones into active forms28, and loss-of-function mutations in both mice and humans are associated with increased susceptibility to obesity and decreased caloric expenditure29. The most differentially expressed PCSK1 target in ILC2s versus ILC3s was Proenkephalin A (Penk) (Fig. 4b), which encodes endogenous opioid-like peptides such as methionine-enkephalin (MetEnk). Production of MetEnk by ILC2s was confirmed by flow cytometric analysis of sort-purified ILC2s (Fig. 4c). Following IL-33 stimulation, ILC2 production of MetEnk peptides was increased (Fig. 4d). In vivo delivery of MetEnk peptides into wildtype mice elicited UCP1+ beige adipocytes, upregulated expression of Ucp1 and increased oxygen consumption in iWAT (Fig. 4e–g), indicating the formation of functional beige fat. Consistent with this, MetEnk treatment decreased iWAT mass (Fig. 4h). These changes were not associated with increased expression of Il-4 or Il-13 (Fig. 4i) or altered eosinophil or AAMac numbers in iWAT (Fig. 4j).
Figure 4. ILC2s produce methionine-enkephalin, a peptide that promotes beige fat formation.

(a) Gene expression enrichment analyses of 69 obesity-associated genes in ILC2s (x-axis) versus ILC3s (y-axis). Genes significantly enriched in one cell type but not the other are red. (b) Differential expression of PCSK1 target genes in ILC2s vs ILC3s. (c) Intracellular staining of MetEnk (black line) or rabbit IgG isotype control (shaded histogram) in ILC2s sort-purified from E-WAT and re-stimulated in vitro with IL-2 and IL-7 (10 ng/mL) for 4 days. (d) MetEnk mean fluorescence intensity (MFI) in sort-purified E-WAT ILC2s re-stimulated in vitro with IL-2 and IL-7 (10 ng/mL) with or without IL-33 (30 ng/mL) for 4 days. Isotype control MFI for each group was subtracted before calculating relative expression. Shown are averages from 4 independent experiments, each representing pooled cells from n=3–5 mice and measured in duplicate or triplicate. (e–j) Wildtype mice were treated with PBS (n=7) or MetEnk (n=9) by subcutaneous injection (10 mg/kg/day) for 5 days. (e) Uncoupling protein 1 (UCP1) immunohistochemistry (IHC) in inguinal white adipose tissue (iWAT). Scale bars, 100 μm. (f) iWAT Ucp1 expression, (g) oxygen consumption, (h) relative mass, (i) Il4 and Il13 expression and (j) numbers of eosinophils (Eos, live CD45+ SiglecF+) and alternatively activated macrophages (AAMacs, live CD45+ SiglecF− F4/80+ CD206+) per gram of adipose. (k) Il33 and Penk mRNA and (l) Ogfr and Oprd1 mRNA in iWAT vs brown adipose tissue (BAT), n=8. (m–n) Stromal vascular fraction (SVF) cells from (m) iWAT or (n) BAT of 4-week-old C57BL/6 mice were differentiated into adipocytes for 2 days, treated with PBS or 50 μM MetEnk from days 2–8 and harvested on day 8 (iWAT: n=7 PBS, n=8 MetEnk; BAT: n=6 PBS, n=6 MetEnk). Student’s t-test or ANOVA, *P<0.05, ***P<0.001.
Gene expression analyses in wildtype mice at steady state indicated that Il33 and Penk expression levels were increased in iWAT compared to BAT (Fig. 4k). In addition, expression of the MetEnk receptor δ1 opioid receptor (Oprd1) was higher in iWAT compared to BAT, whereas expression of the other known MetEnk receptor Opioid growth factor receptor (Ogfr) was lower in iWAT compared to BAT (Fig. 4l), suggesting that there may be tissue-specific effects of MetEnk in iWAT compared to BAT. Consistent with this, MetEnk stimulation induced Ucp1 expression in cultured primary adipocytes from iWAT (Fig. 4m) but not BAT (Fig. 4n). Taken together, these results identify that ILC2s express MetEnk that can directly promote beiging of WAT (Supplemental Fig. S8).
Collectively, these data provide the first demonstration that dysregulated ILC2 responses in WAT are a conserved feature of obesity in humans and mice and that the IL-33/ILC2 axis regulates metabolic homeostasis by eliciting beiging of white adipose tissue. Production of enkephalin peptides is a previously unrecognized effector mechanism employed by ILC2s to regulate metabolic homeostasis. From an evolutionary perspective, coupling ILC2-dependent innate immune effector functions with the maintenance of systemic metabolic homeostasis could provide a rapid, integrated multi-organ response that allows mammals to surmount multiple environmental challenges including infection, nutrient stress or changes in temperature. Given that impaired beige adipocyte function is associated with increased weight gain and obesity in mice9,19 and that activity of brown/beige17,30 adipose tissue is dysregulated in obese patients20,21, targeting the IL-33/ILC2/beiging pathway could represent a new approach for treating obesity and obesity-associated diseases.
METHODS
Mice
C57BL/6, CD45.1+ C57BL/6, Rag1−/− and DblGata1 (Balb/c background) mice were obtained from Jackson Labs. Rag2−/−, Rag2−/− cy−/−, Il33+/+, Balb/c and Il4ra−/− (Balb/c background) mice were obtained from Taconic. Il33−/− mice were provided by Amgen Inc via Taconic. Id2−/− bone marrow chimeras14 and Tcf7−/− mice15 were generated as described previously. Unless otherwise noted, all mice were on a C57BL/6 background. All mice were males and had ad libitum access to food and water and were maintained in a specific pathogen free facility with a 12h:12h light:dark cycle. Animals were randomly assigned to groups of n=3–5 mice per group per experiment, and at least two independent experiments were performed throughout. In all in vivo experiments, a single technical replicate per mouse was performed except in glucose homeostasis tests described below, in which 2–4 technical replicates were performed per mouse for each time point. For all in vitro experiments, 2–3 technical replicates were performed in each independent experiment. Sample sizes in each independent experiment were selected to have power of at least 90% using published sample size/power formulas31. Studies were not blinded. All experiments were carried out under the guidelines of the Institutional Animal Care and Use Committee at the University of Pennsylvania.
Human samples
Subcutaneous white adipose tissue (S-WAT) from the abdominal region was obtained from human donors via the New York Human Organ Donor Network (NYODN) and via the Cooperative Human Tissue Network (CHTN) Eastern Division, University of Pennsylvania. Donor characteristics are summarized in Supplemental Table S1. NOYDN samples were from recently deceased organ donors at the time of organ acquisition for clinical transplantation through an approved research protocol and MTA with the NYODN. All NYODN donors were free of cancer and were Hepatitis B, Hepatitis C, and HIV-negative. Tissues were collected after the donor organs were flushed with cold preservation solution and clinical procurement process was completed. Samples from CHTN were collected from non-deceased adults undergoing panniculectomies, and were harvested from discarded connective tissue by CHTN staff. All human samples from NYODN and CHTN were stored in DMEM on ice or at 4°C for 24–48 hours before processing. Donors were defined as non-obese if their body mass index (BMI) was < 30.0 kg/m2 (n=7) or obese if their BMI was ≥ 30.0 kg/m2 (n=7). Sample sizes per group were selected to have power >95% using published sample size/power formulas31. There were no differences in the proportion of donors from NYODN or CHTN between non-obese and obese groups (Supplemental Table S1). ILC2 frequencies were also compared for all characteristics shown in Supplemental Table S1, and those characteristics that had a P-value < 0.10 were interrogated to test whether they could explain the differences in ILC2 frequencies observed between non-obese vs obese donors. The human samples from NYODN do not qualify as “human subjects” research, as confirmed by the Columbia University IRB, and the human samples from CHTN were de-identified and were not obtained for the specific purpose of these studies and therefore are not considered “human subjects” research.
Diet-induced obesity
Where indicated, mice were fed a control diet (CD, 10% kcal fat, Research Diets, New Brunswick, New Jersey) or high fat diet (HFD, 45% or 60% kcal fat as indicated, Research Diets) for the indicated period of time starting at 6–8 weeks of age. CD and HFD were gamma-irradiated (10–20 kGy). In all experiments that did not employ HFD or CD, mice were fed a standard autoclavable rodent chow (5% kcal fat, 5010, Lab Diets, St. Louis, Missouri).
In vivo cytokine and enkephalin peptide treatments
Mice were administered 12.5 μg/kg carrier-free recombinant murine IL-33 (rmIL-33, R&D Systems, Minneapolis, Minnesota) in sterile phosphate buffered saline (PBS) by intraperitoneal (i.p.) injection for 7 days at the indicated dose. In HFD studies, mice were treated with 12.5 μg/kg recombinant murine IL-33 or PBS once every 4 days by i.p. injection. In some studies, mice were treated with a previously reported32 dose of 10 mg/kg [Met5] Enkephalin acetate salt hydrate (MetEnk, amino acid sequence YGGFM, ≥95.0% purity by HPLC, Sigma Aldrich, St. Louis, MO) in PBS or with PBS alone by bilateral subcutaneous injection near the iWAT daily for 5 days (approximately 200 μL per side). MetEnk or vehicle injections were performed under isoflurane anesthesia.
Sort-purification and transfer of ILC2s
E-WAT was harvested from male CD45.1+ C57BL/6 mice that received daily injections of rmIL-33 (12.5 μg/kg) for 7 days by intraperitoneal injection. Live CD45+ Lin− CD25+ IL-33R+ ILC2s were sort-purified using an Aria Cell Sorter (BD) to ≥98% purity, and 105 ILC2s were immediately transferred to the indicated recipient mice by intraperitoneal injection (5 × 10⁴ cells) and by subcutaneous injection near iWAT (5 × 10⁴ cells split evenly for bilateral injections). Daily transfers were performed for 4 consecutive days, and tissues were harvested on day 5. In ILC2 reconstitution experiments involving Rag2−/− γc−/− recipient mice, 105 ILC2s were transferred by a single intraperitoneal injection, and the next day mice were treated with PBS or rmIL-33 (12.5 μg/kg) by daily intraperitoneal injection for 7 days.
In vivo metabolic phenotyping
Mice were single-housed in an OxyMax Comprehensive Laboratory Animal Monitoring System (CLAMS, Columbus Instruments, Columbus, Ohio) for 24 hours. Mice were acclimated to the CLAMS cages for 24 hours before measurements commenced. Fat mass and adiposity were measured by 1H-nuclear magnetic resonance (NMR) spectroscopy. For glucose tolerance tests, mice were fasted overnight for 14–16 hours and injected with 2 g/kg D-glucose by i.p. injection. Blood glucose values were measured just prior to injection (time 0) and at 20, 40, 60, 90 and 120 min post-injection. For insulin tolerance tests, mice were fasted for 4–6h and then injected with bovine insulin (0.5 U/kg). Blood glucose values were measured just prior to injection (time 0) and at 20, 40 and 60 min post-injection. To measure fasting blood glucose and insulin concentrations, mice were fasted overnight for 14–16 hours, and blood glucose values were measured followed by collection of approximately 20–30 μL blood for serum insulin concentration determination using the Ultra Sensitive Mouse Insulin ELISA Kit (Crystal Chem). Homeostatic model assessment of insulin resistance (HOMA-IR) index values were calculated as described previously33. All blood glucose measurements were performed using FreeStyle Lite handheld glucometer (Abbot) in duplicate or triplicate.
Histologic analysis
Tissues were fixed in 4% paraformaldehyde in PBS for at least 48 hours at 4°C and embedded in paraffin before cutting 5 μm sections and staining with hematoxylin and eosin (H&E) or performing immunohistochemistry (IHC) with rabbit anti-UCP1 antibody (Abcam, ab10983). For IHC, rehydrated sections were microwaved in 10 mM citric acid buffer (pH 6.0) for antigen retrieval, and endogenous peroxidases were quenched with 3% hydrogen peroxide. Sections were blocked with Avidin D, biotin and protein blocking agent in sequential order followed by application of the anti-UCP1 antibody (1:500). A biotinylated anti-rabbit antibody was used as a secondary antibody. Horseradish peroxidase-conjugated ABC reagent was applied, and then DAB reagent was used to develop the signal before counterstaining in hematoxylin and dehydrating the sections in preparation for mounting. Stained sections were visualized and photographed using a Nikon E600 brightfield microscope.
Adipocyte area quantification
Inguinal white adipose tissue (iWAT) sections were H&E stained and imaged at 40X magnification. White adipocyte area was calculated using ImageJ software by drawing ellipses circumscribing white adipocytes. The scale was set to 8 pixels per micron based on the pixel length of a 100 μm scale bar at 40X magnification. Two-to-three images, each from a different area of a given sample, were captured per animal. Adipocyte area was measured in 10–20 adipocytes per image (25–40 adipocytes per mouse) and averaged on a per mouse basis.
Isolation of immune cells and flow cytometry
Murine epididymal white adipose tissue (E-WAT), inguinal WAT (iWAT) or brown adipose tissue (BAT) or human subcutaneous abdominal WAT were harvested and digested with 0.1% collagenase type II (Sigma-Aldrich, USA) at 37°C with shaking at 200 rpm for 60–90 min. Digested tissues were filtered through a 70 μm nylon mesh and centrifuged at 500 x g for 5 min. Floating adipocytes were removed, and the stromal vascular fraction (SVF) pellet was resuspended in red blood cell lysis buffer (ACK RBC Lysis Buffer). Recovered cells were washed and stained with live/dead stain (Molecular Probes) followed by standard surface staining for flow cytometric analysis with fluorochrome-conjugated antibodies. Murine cells were stained with combinations of the following antibodies: anti-mouse CD45-eFluor 605NC (clone 30-F11), CD45.1-eFluor 450 (A20), CD45.2-AlexaFluor 700 (104), F4/80-eFluor 450 (BM8), CD3e-PerCP-Cy5.5 (145-2C11), CD5-PerCP-Cy5.5 (53-7.3), CD19-PerCP-Cy5.5 (1D3), NK1.1-PerCP-Cy5.5 (PK136), CD11c-PerCP-Cy5.5 (N418), FcεRIα-FITC (MAR-1), Foxp3-FITC (FJK-16s), GATA-3-PE (TWAJ) and CD25-PE-Cy7 (clone PC61.5) from eBioscience (San Diego, CA); CD11b-PE-Texas Red (M1/70.15) from Life Technologies (Grand Island, NY); CD90.2-Alexa Fluor 700 (30-H12) and CD4-Brilliant Violet-650 (RM4-5) from BioLegend (San Diego, CA); SiglecF-PE (E50-2440) and CD3e-PE-CF594 (145-2C11) from BD Biosciences (San Jose, CA); IL-33R-biotin (T1/S2, clone DJ8) from MD Bioproducts (St. Paul, MN); CD206-Alexa Fluor 647 (MR5D3) from AbD Serotec (Raleigh, NC); and Streptavidin-APC from eBioscience. Foxp3, GATA-3 and CD206 staining was performed following fixation and permeabilization with the Foxp3 Staining Buffer Set (eBioscience). Human cells were stained with anti-human GATA-3-PE (TWAJ), TCRαβ-PerCP-Cy5.5 (IP26), CD5-PerCP-Cyanin5.5 (L17F12), CD19-Alexa Fluor 700 (HIB19), CD11c-Alexa Fluor 700 (3.9), CD127-eFluor 780 (eBioRDR5), CD45-eFluor 605NC (HI30), FcεRIα-biotin (AER-37) and Streptavidin-eFluor 650NC from eBioscience; CD56-Alexa Fluor 700 (B159), CD16 (3G8), CD3 (SP34-2) and CD25-PE-Cy7 (M-A251) from BD Pharmingen; CD11b-PE-Texas Red (M1/70.15) from Life Technologies; and ST2L-FITC from MD Bioproducts. Stained cells were acquired on a BD LSRII flow cytometer (BD Biosciences), and data were analyzed using FlowJo software version 9.6.4 (Tree Star, Inc.).
Intracellular cytokine analysis
To examine ILC2 effector cytokine production, single cell suspensions of E-WAT or iWAT SVF were stimulated for 4 hours ex vivo with PMA (100 ng/mL) and ionomycin (1 ng/mL) in the presence of Brefeldin A (10 μg/mL) (all from Sigma-Aldrich) in a 37°C incubator (5% CO2). Cells were then surface stained, fixed and permeabilized using Cyto Fix/Perm (BD Pharmingen) according to manufacturer’s instructions before intracellular staining for IL-5 (APC-IL-5, clone TRFK5, eBioscience) and IL-13 (PE-IL-13, eBio13A, eBioscience). Monensin (1:1500) was also used for intracellular staining with rabbit anti-mouse MetEnk (bs-1759R, Bioss USA, Woburn, MA) or rabbit anti-mouse IgG (Isotype control, Bioss USA) followed by staining with goat anti-rabbit PE (sc-3739, Santa Cruz Biotechnology, Dallas, TX)
Real-time PCR
Adipose tissues were snap-frozen in TRIzol (Invitrogen) and homogenized using a Tissue Lyser (Qiagen). RNA was isolated from the aqueous phase using the RNeasy kit (Qiagen) in accordance with the manufacturer’s instructions. cDNA was synthesized from 1.0 μg RNA using Superscript II Reverse Transcriptase (Invitrogen) and oligo(dT) (Invitrogen). Real-time PCR was performed using SYBR Green technology (Applied Biosystems) with previously published primer sequences for murine Ucp117 and Qiagen Quantitect real-time PCR primers for β-actin, Il33, Penk, Oprd1 and Ogfr. Reactions were run on the 7500 Fast Real-Time PCR System (Applied Biosystems) or the QuantStudio 6 Flex Real-Time PCR System (Applied Biosystems). Results were normalized to the housekeeping gene β-actin, and the ΔΔCt method was employed for all real-time PCR analyses.
Microarrays and ILC2 vs ILC3 gene enrichment analyses
Microarray analyses (~25,000 genes) were performed using previously published microarray datasets (GEO GSE46468)14. In brief, Lin− CD90+ CD25+ IL-33R+ ILC2s from the lung (4 biological replicates each comprising 6 pooled lungs) and Lin− CD90+ CD25+ CD4+ ILC3s from the spleen (4 biological replicates each comprising 10 pooled spleens) were sorted using a FACS Aria (BD) directly into TRIzol LS (Invitrogen) at a purity of >97% (1.5–2.0 × 10⁴ cells/replicate). mRNA was isolated, amplified, labeled and hybridized to Affymetrix GeneChip (Mouse Gene 1.0 ST) as described previously14. Gene expression Z-scores were calculated for each of 69 obesity-associated genes in ILC2s or ILC3s (see Supplemental Table S2 for a complete list of genes). Genes that were significantly enriched compared to the average gene expression level of the entire microarray dataset) in one cell population (Z > 1.96) but not the other were considered to be differentially enriched in that cell population.
Tissue oxygen consumption
A ~20 mg biopsy of iWAT was isolated from directly below the lymph node and minced in PBS containing 2% BSA, 1.1 mM sodium pyruvate and 25 mM glucose. Samples were placed in an MT200A Respirometer Cell (Strathkelvin), and oxygen consumption was measured for approximately 5 min. Oxygen consumption rates were normalized to minced tissue weight.
Primary adipocyte culture
iWAT or BAT was dissected from 4 week-old C57BL/6 mice (n=5 per experiment, pooled) and digested as described above. Stromal vascular fraction (SVF) cells were plated in 12-well CellBind plates and adherent cells were grown to confluence. Cells were differentiated into adipocytes as previously described34. Briefly, cells were cultured for 2 days with 850 nM insulin, 1 nM T3, 1 μM rosiglitazone, 125 nM indomethacin (125 μM for BAT primary adipocytes), 0.5 mM isobutylmethylxanthine (IBMX) and 1 μM dexamethasone in adipocyte culture media (DMEM:F12 [50:50] supplemented with 10% heat-inactivated FBS, penicillin, streptomycin and L-glutamine). Cells were then maintained in adipocyte culture media supplemented with 850 nM insulin and 1 nM T3 with either PBS or 50 μM MetEnk for 6 days, with fresh media replacement every 2 days. Cells were harvested on day 8 in TRIzol.
Statistical analyses
Data are expressed as mean ± standard error of the mean (SEM). Statistical significance was determined for Normally-distributed data by using the two-tailed Student’s t test or a one-way or two-way analysis of variance (ANOVA) followed by Sidak or Tukey post-hoc tests. If variance differed between groups, the appropriate statistical correction was applies (e.g. Welch’s correction). Correlation analyses were conducted using Pearson linear regression. Proportions among human samples were compared by Chi-squared tests. Significance was set at P<0.05. Statistical analyses were performed with Prism 6 (GraphPad Software, Inc.) or SPSS Statistics version 22 (IBM).
Supplementary Material
(a) Gating strategy to identify human ILCs. Stromal vascular fraction (SVF) cells from human abdominal subcutaneous white adipose tissues (WAT) were isolated and subjected to flow cytometric analyses. First plot pre-gated on singlets. Lineage cocktail 1 (Lin1): CD3, CD5, TCRαβ. Lineage cocktail 2 (Lin2): CD19, CD56, CD11c, CD16. ILCs are identified as Lin-negative cells that are CD25+ CD127+. Plots shown are from an obese donor. (b–e) SVF cells from murine epididymal (E)-WAT were isolated and subjected to flow cytometric analyses. ILCs were defined as live CD45+ Lin− CD25+ CD127+ cells. The lineage (Lin) cocktail included CD3, CD5, CD19, NK1.1, CD11c, CD11b and FcεRIα. Comparison of Lin− CD25+ CD127+ cells in E-WAT of (b) Id2+/+ versus Id2−/− bone marrow chimeras, (c) Tcf7+/+ versus Tcf7−/− mice and (d) Rag2−/− versus Rag2−/− γc−/−mice. N=3–8 mice per group from 2 independent experiments. (e) E-WAT SVF cells from C57BL/6 mice were treated with PMA (100 ng/mL) and ionomycin (1 μg/mL) in the presence of Brefeldin A (10 μg/mL) for 4h and stained for ILCs. Live CD45+ Lin− CD25+ CD127+ cells were pre-gated, and IL-5 and IL-13 protein levels were assessed. Plot shown is representative of n=12 mice from 3 independent experiments. (f) Human WAT ILC2 frequencies were compared in the 7 youngest donors (36.0 +/− 3.5 years old) versus the 7 oldest donors (55.9 +/− 1.9 years old). (g) Human WAT ILC2 frequencies in female non-obese donors with body mass index (BMI) ≥30.0 kg/m2 versus female obese donors with BMI =30.0 kg/m2. Student’s t-test. **P<0.01, ***P<0.001.
Il33+/+ (n=6) or Il33−/− (n=5) mice were fed a low fat diet (10% kcal fat) for 12 weeks starting at 7 weeks of age. (a) Representative plots and frequencies of live CD45+ Lin− CD25+ IL-33R+ ILC2s in epididymal (E)-WAT (data are from Figure 2A) and iWAT. Plots pre-gated on CD45+ Lin− cells that lack CD3, CD5, CD19, NK1.1, CD11c, CD11b and FcεRIα. (b) Frequencies of IL-5+ IL-13− and IL-5+ IL- 13+ ILC2s in E-WAT and iWAT of wildtype and IL-33-deficient mice. E-WAT stromal vascular fraction cells were treated with PMA (100 ng/mL) and ionomycin (1 μg/mL) in the presence of Brefeldin A (10 μg/mL) for 4h prior to staining for ILC2s and intracellular cytokines. Pre-gated on CD45+ Lin− CD25+ IL33R+ ILC2s. (c) Inguinal white adipose tissue (iWAT) sections were H&E stained and imaged at 40X magnification. Adipocyte area was calculated from 25–40 adipocytes total from 2–3 images per mouse. (d) 16-hour fasting blood glucose concentrations. (e) 16-hour fasting serum insulin concentrations. (f) Homeostatic model assessment of insulin resistance (HOMA-IR) index values. (g) Glucose tolerance test with 2 g/kg glucose following a 16-hour fast. (h) Insulin tolerance test with 0.5 U/kg insulin following a 5-hour fast. For panels a–f, groups were compared using Student’s t-test, *P<0.05, ***P<0.001. For panels g–h, a two-way ANOVA with repeated measures was performed followed by Tukey post-hoc test. *P<0.05, **P<0.01, ***P<0.001. Data shown are from a single cohort and are representative of 2 independent experiments. Sample sizes are biological replicates.
Male C57BL/6 mice were placed on a control diet (CD) or HFD (60% kcal fat) at age 8 weeks. On the first day of feeding, CD mice were treated with PBS and HFD mice were treated with PBS or recombinant murine (rm)IL-33 (12.5 μg/kg) once every 4 days by intraperitoneal injection for 4 weeks. (a) E-WAT ILC2 numbers per gram of adipose, (b) body weight, (c) relative E-WAT weight and (d) relative iWAT weight at week 4. (e) 16-hour fasting blood glucose concentrations and (f) glucose tolerance testing during week 3. (g) Frequencies and representative plots of E-WAT Tregs defined as live CD45+ CD3+ CD4+ Foxp3+ cells. Plots are gated on live CD45+ CD3+ CD4+ cells, and numbers are the percentage of CD4+ T cells that are Foxp3+ Tregs. (h) Numbers of Treg cells per gram of adipose. All panels include n=10 mice per group from 2 independent cohorts, except panel A which includes n=16 CD PBS and n=18 HFD PBS from 4 independent cohorts. Panels a–e, One-way ANOVA with Tukey post-hoc test,* P<0.05, **P<0.01, ***P<0.001. Panel f, Two-way ANOVA with repeated measures, ***P<0.001 comparing CD PBS vs HFD PBS, ^^^P<0.001 comparing HFD PBS vs HFD IL-33.
(a) Male C57BL/6 mice were treated with PBS or recombinant murine (rm)IL-33 (12.5 μg/kg) daily for 7 days (PBS n=10, rmIL-33, n=12). Over a 24 hour period between days 6 and 7, food intake and ambulatory activity were measured over 15 min intervals. The average difference in food intake or ambulatory activity between PBS- and rmIL-33-treated mice was calculated for each 15 min interval, and the differences in food intake and ambulatory activity were related by linear regression. Solid line, best-fit line. Dashed curves, upper and lower 95% confidence intervals around the best-fit line. (b–d) Male C57BL/6 mice were treated with PBS or recombinant murine (rm)IL-33 (12.5 μg/kg) once and monitored for the first 3 hours post-treatment using CLAMS cages (n=4/group). (b) Energy expenditure, (c) food intake and (d) ambulatory activity (beam breaks) were measured over of the first 3 hours post-treatment. Student’s t-test. ***P<0.001.
C57BL/6 male mice (10 weeks old) were treated with PBS (n=8) or IL-33 (12.5 μg/kg, n=8) daily by intraperitoneal injection for 7 days. (a) Representative plots and frequencies of Lin− CD25+ IL-33R+ ILC2s in interscapular BAT. Gated on live CD45+ Lin− cells. (b) Numbers of ILC2s per gram of BAT. (c) Ucp1 expression in BAT by real-time PCR. (d) UCP1 immunohistochemistry of BAT at 10X magnification. Scale bars, 100 μm. (e) 40X magnification of panel D. Scale bars, 100 μm. Student’s t-test, *<0.05, ***P<0.001.
(a) Experimental design for panels a–b. Live CD45+ Lin− CD25+ IL-33R+ ILC2s were sort-purified from E-WAT of CD45.1+ mice treated with 12.5 μg/kg recombinant murine (rm)IL-33 daily for 7 days by intraperitoneal injection. PBS (n=8) or ILC2s (1 × 10⁵ total, n=8) were transferred to CD45.2+ recipient mice daily for 4 days by subcutaneous injection near iWAT (5 × 10⁴ ILC2s, split evenly bilaterally) and intraperitoneal injection (5 × 10⁴ ILC2s). Tissues were harvested on day 5 for analyses. (b) Donor and recipient ILC2s in E-WAT, brown adipose tissue (BAT), mesenteric lymph nodes (mLN) and lung. iWAT ILC2 plots from this experiment are shown in main Figure 3g. Pre-gated on Live CD45+ Lin− CD25+ IL-33R+ ILC2s. Donor ILC2s are defined as CD45.1+ CD45.2−, whereas recipient ILC2s are defined as CD45.1− CD45.2+. Representative plots shown. Frequencies represent percent of ILC2s that are recipient or donor cells. Student’s t-test, ***P<0.001. (c) Experimental design for panels c–e. Sort-purified CD45.1+ ILC2s (105) from E-WAT of IL-33-treated mice (as described above) were transferred into Rag2−/− γc−/− recipients by a single intraperitoneal injection. ILC2-sufficient Rag2−/− mice, ILC2-deficient Rag2−/− γc−/− mice and ILC2-reconstituted Rag2−/− γc−/− mice were treated with PBS or rmIL-33 (12.5 μg/kg) by intraperitoneal injection daily for 7 days. This experimental design corresponds to main Figure 3l–m. (d) Representative plots of live CD45.1+ Lin− CD25+ IL33R+ ILC2s in E-WAT. Blue, recipient cells. Red, donor cells. Lineage cocktail includes CD3, CD5, CD19, NK1.1, CD11c, CD11b and FcεRIα. (e) iWAT UCP1 IHC, bar 100 μm. ANOVA with Tukey post-hoc test, ***P<0.001.
(a–f) Wildtype (Balb/c), DblGata1 mice that lack eosinophils or Il4ra−/− mice that have dysregulated alternatively activated macrophages (AAMacs) (both mutant strains on a Balb/c background) were treated with PBS or recombinant murine (rm)IL-33 (12.5 μg/kg) daily by intraperitoneal injection for 7 days. (a) iWAT ILC2 numbers per gram of adipose and (b) iWAT UCP1 immunohistochemistry (IHC) in Balb/c mice. (c) iWAT ILC2 numbers per gram of adipose and (d) iWAT UCP1 IHC in DblGata1 mice. (e) iWAT ILC2 numbers per gram of adipose and (f) iWAT UCP1 IHC in Il4ra−/− mice. (g–h) Live CD45+ Lin− CD25+ IL-33R+ ILC2s were sort-purified from E-WAT of C57BL/6 mice treated with rmIL-33 (12.5 μg/kg) daily for 5–7 days by intraperitoneal injection to Rag1−/− mice on a C57BL/6 background. ILC2s (1 × 10⁵ total) were transferred to recipient mice daily for 4 days by subcutaneous injection. (g) iWAT ILC2 numbers per gram of adipose and (h) iWAT UCP1 IHC. (i–l) Live CD45+ Lin− CD25+ IL-33R+ ILC2s were sort-purified from E-WAT of Balb/c mice treated with rmIL-33 (12.5 μg/kg) daily for 5–7 days by intraperitoneal injection. ILC2s (1 × 10⁵ total) were transferred to recipient mice daily for 4 days by subcutaneous injection. (i) iWAT ILC2 numbers per gram of adipose and (j) iWAT UCP1 IHC in DblGata1 recipients. (k) iWAT ILC2 numbers per gram of adipose and (l) iWAT UCP1 IHC in Il4ra−/− recipients. Student’s t-test, *P<0.05. Data are from n=3–6 mice per group pooled over 2–3 independent experiments. Scale bars, 100 μm.
Interleukin (IL)-33 acts on group 2 innate lymphoid cells (ILC2s) to upregulate production of the effector molecules IL-5, IL-13 and enkephalin peptides. ILC2-derived IL-5 promotes eosinophil homeostasis in WAT, and eosinophils in turn produce IL-4 to sustain alternatively activated macrophages (AAMacs) in WAT. ILC2-derived IL-13 can also promote AAMac responses. In the setting of chronic exposure to a cold environment, eosinophil-derived IL-4 stimulates AAMacs to produce catecholamines such as norepinephrine, which acts directly on beige adipocytes to upregulate uncoupling protein 1 (UCP1) expression and promote. Although it remains unknown whether ILC2-derived IL-5 and IL-13 contribute to cold stress-induced beiging, ILC2-derived enkephalin peptides can act directly on beige adipocytes to upregulate UCP1. This results in increased energy expenditure and decreased adiposity that may counteract weight gain. In the setting of obesity, IL-33 expression in WAT is increased, however WAT ILC2s are paradoxically decreased in both mice and humans, suggesting that the IL-33/ILC2 axis is dysregulated in obesity. This may impede the ability of ILC2s to contribute to the function of beige fat, resulting in a vicious cycle that promotes weight gain.
Acknowledgments
The authors wish to thank members of the Artis laboratory for the critical reading of this manuscript. Research in the Artis lab is supported by the National Institutes of Health (AI061570, AI074878, AI095466, AI095608, AI102942, and AI097333 to D.A.), the Burroughs Wellcome Fund Investigator in Pathogenesis of Infectious Disease Award (D.A.) and Crohn’s & Colitis Foundation of America (D.A.). Additional funding was provided by NIH F30-AI112023 (J.R.B.), T32-AI060516 (J.R.B.), T32-AI007532 (L.A.M.), KL2-RR024132 (B.S.K.), DP5OD012116 (G.F.S.), P01AI06697 (D.L.F.), F31AG047003 (J.J.T.) and DP2OD007288 (P.S.) and by the Searle Scholars Award (P.S.). We thank Mitchell A. Lazar (University of Pennsylvania) for invaluable scientific and technical advice, Dirk E. Smith (Amgen Inc.) for providing Il33−/− mice, Ananda Goldrath (University of California, San Diego) for providing Id2−/− chimeras, and Avinash Bhandoola (University of Pennsylvania, National Cancer Institute) for providing Tcf7−/− mice. We also thank the Mouse Phenotyping, Physiology & Metabolism Core at the Diabetes Research Center (DRC) of the Institute for Diabetes, Obesity & Metabolism (IDOM) as well as the Penn Diabetes Endocrine Research Center Grant (P30DK19525). In addition, we thank the Matthew J. Ryan Veterinary Hospital Pathology Lab, the Penn Microarray Facility, and the Mucosal Immunology Studies Team (MIST) of the NIH NIAID for shared expertise and resources. The authors would also like to thank the Abramson Cancer Center Flow Cytometry and Cell Sorting Resource Laboratory for technical advice and support. The ACC Flow Cytometry and Cell Sorting Shared Resource is partially supported by NCI Comprehensive Cancer Center Support Grant (#2-P30 CA016520). This work was supported by the NIH/NIDDK P30 Center for Molecular Studies in Digestive and Liver Diseases (P30-DK050306), its pilot grant program and scientific core facilities (Molecular Pathology and Imaging, Molecular Biology, Cell Culture and Mouse), as well as the Joint CHOP-Penn Center in Digestive, Liver and Pancreatic Medicine and its pilot grant program. In addition, we would like to acknowledge and thank the New York Organ Donor Network, the Cooperative Human Tissue Network-Eastern Division and especially the donors and their families. We apologize to colleagues whose work we were unable to quote due to space constraints.
Footnotes
AUTHOR CONTRIBUTIONS
J.R.B., B.S.K., S.A.S., R.R.S., L.A.M., G.F.S., K.L., P.S. and D.A. designed and performed the research and/or provided advice and technical expertise. J.J.T. and D.L.F. provided human tissues. J.R.B. and D.A. analyzed the data and wrote the manuscript.
The authors declare no competing financial interests.
References
- 1.Lumeng CN, Saltiel AR. Inflammatory links between obesity and metabolic disease. Journal of Clinical Investigation. 2011;121:2111–2117. doi: 10.1172/JCI57132. [DOI] [PMC free article] [PubMed] [Google Scholar]
- 2.Osborn O, Olefsky JM. The cellular and signaling networks linking the immune system and metabolism in disease. Nature medicine. 2012;18:363–374. doi: 10.1038/nm.2627. [DOI] [PubMed] [Google Scholar]
- 3.Moro K, et al. Innate production of T(H)2 cytokines by adipose tissue-associated c-Kit(+)Sca-1(+) lymphoid cells. Nature. 2010;463:540–544. doi: 10.1038/nature08636. [DOI] [PubMed] [Google Scholar]
- 4.Halim TY, et al. Group 2 innate lymphoid cells are critical for the initiation of adaptive T helper 2 cell-mediated allergic lung inflammation. Immunity. 2014;40:425–435. doi: 10.1016/j.immuni.2014.01.011. [DOI] [PMC free article] [PubMed] [Google Scholar]
- 5.Molofsky AB, et al. Innate lymphoid type 2 cells sustain visceral adipose tissue eosinophils and alternatively activated macrophages. The Journal of experimental medicine. 2013;210:535–549. doi: 10.1084/jem.20121964. [DOI] [PMC free article] [PubMed] [Google Scholar]
- 6.Hams E, Locksley RM, McKenzie AN, Fallon PG. Cutting Edge: IL-25 Elicits Innate Lymphoid Type 2 and Type II NKT Cells That Regulate Obesity in Mice. Journal of immunology. 2013 doi: 10.4049/jimmunol.1301176. [DOI] [PMC free article] [PubMed] [Google Scholar]
- 7.Harms M, Seale P. Brown and beige fat: development, function and therapeutic potential. Nature medicine. 2013;19:1252–1263. doi: 10.1038/nm.3361. [DOI] [PubMed] [Google Scholar]
- 8.Shabalina IG, et al. UCP1 in Brite/Beige Adipose Tissue Mitochondria Is Functionally Thermogenic. Cell reports. 2013;5:1196–1203. doi: 10.1016/j.celrep.2013.10.044. [DOI] [PubMed] [Google Scholar]
- 9.Cohen P, et al. Ablation of PRDM16 and Beige Adipose Causes Metabolic Dysfunction and a Subcutaneous to Visceral Fat Switch. Cell. 2014;156:304–316. doi: 10.1016/j.cell.2013.12.021. [DOI] [PMC free article] [PubMed] [Google Scholar]
- 10.Price AE, et al. Systemically dispersed innate IL-13-expressing cells in type 2 immunity. Proceedings of the National Academy of Sciences of the United States of America. 2010;107:11489–11494. doi: 10.1073/pnas.1003988107. [DOI] [PMC free article] [PubMed] [Google Scholar]
- 11.Neill DR, et al. Nuocytes represent a new innate effector leukocyte that mediates type-2 immunity. Nature. 2010;464:1367–1370. doi: 10.1038/nature08900. [DOI] [PMC free article] [PubMed] [Google Scholar]
- 12.Miller AM, et al. Interleukin-33 induces protective effects in adipose tissue inflammation during obesity in mice. Circulation research. 2010;107:650–658. doi: 10.1161/CIRCRESAHA.110.218867. [DOI] [PMC free article] [PubMed] [Google Scholar]
- 13.Mjosberg JM, et al. Human IL-25- and IL-33-responsive type 2 innate lymphoid cells are defined by expression of CRTH2 and CD161. Nature immunology. 2011;12:1055–1062. doi: 10.1038/ni.2104. [DOI] [PubMed] [Google Scholar]
- 14.Monticelli LA, et al. Innate lymphoid cells promote lung-tissue homeostasis after infection with influenza virus. Nature immunology. 2011;12:1045–1054. doi: 10.1031/ni.2131. [DOI] [PMC free article] [PubMed] [Google Scholar]
- 15.Yang Q, et al. T cell factor 1 is required for group 2 innate lymphoid cell generation. Immunity. 2013;38:694–704. doi: 10.1016/j.immuni.2012.12.003. [DOI] [PMC free article] [PubMed] [Google Scholar]
- 16.Miller AM, et al. IL-33 reduces the development of atherosclerosis. The Journal of experimental medicine. 2008;205:339–346. doi: 10.1084/jem.20071868. [DOI] [PMC free article] [PubMed] [Google Scholar]
- 17.Wu J, et al. Beige adipocytes are a distinct type of thermogenic fat cell in mouse and human. Cell. 2012;150:366–376. doi: 10.1016/j.cell.2012.05.016. [DOI] [PMC free article] [PubMed] [Google Scholar]
- 18.Rosen ED, Spiegelman BM. What we talk about when we talk about fat. Cell. 2014;156:20–44. doi: 10.1016/j.cell.2013.12.012. [DOI] [PMC free article] [PubMed] [Google Scholar]
- 19.Feldmann HM, Golozoubova V, Cannon B, Nedergaard J. UCP1 ablation induces obesity and abolishes diet-induced thermogenesis in mice exempt from thermal stress by living at thermoneutrality. Cell metabolism. 2009;9:203–209. doi: 10.1016/j.cmet.2008.12.014. [DOI] [PubMed] [Google Scholar]
- 20.Carey AL, et al. Ephedrine activates brown adipose tissue in lean but not obese humans. Diabetologia. 2013;56:147–155. doi: 10.1007/s00125-012-2748-1. [DOI] [PubMed] [Google Scholar]
- 21.Saito M, et al. High incidence of metabolically active brown adipose tissue in healthy adult humans: effects of cold exposure and adiposity. Diabetes. 2009;58:1526–1531. doi: 10.2337/db09-0530. [DOI] [PMC free article] [PubMed] [Google Scholar]
- 22.Qiu Y, et al. Eosinophils and type 2 cytokine signaling in macrophages orchestrate development of functional beige fat. Cell. 2014;157:1292–1308. doi: 10.1016/j.cell.2014.03.066. [DOI] [PMC free article] [PubMed] [Google Scholar]
- 23.Wu D, et al. Eosinophils sustain adipose alternatively activated macrophages associated with glucose homeostasis. Science. 2011;332:243–247. doi: 10.1126/science.1201475. [DOI] [PMC free article] [PubMed] [Google Scholar]
- 24.Liu PS, et al. Reducing RIP140 Expression in Macrophage Alters ATM Infiltration, Facilitates White Adipose Tissue Browning, and Prevents High-Fat Diet–Induced Insulin Resistance. Diabetes. 2014;63:4021–4031. doi: 10.2337/db14-0619. [DOI] [PMC free article] [PubMed] [Google Scholar]
- 25.Feuerer M, et al. Lean, but not obese, fat is enriched for a unique population of regulatory T cells that affect metabolic parameters. Nature medicine. 2009;15:930–939. doi: 10.1038/nm.2002. [DOI] [PMC free article] [PubMed] [Google Scholar]
- 26.McCarthy MI. Genomics, type 2 diabetes, and obesity. The New England journal of medicine. 2010;363:2339–2350. doi: 10.1056/NEJMra0906948. [DOI] [PubMed] [Google Scholar]
- 27.Walley AJ, Asher JE, Froguel P. The genetic contribution to non-syndromic human obesity. Nature reviews Genetics. 2009;10:431–442. doi: 10.1038/nrg2594. [DOI] [PubMed] [Google Scholar]
- 28.Seidah NG, Sadr MS, Chretien M, Mbikay M. The multifaceted proprotein convertases: their unique, redundant, complementary, and opposite functions. The Journal of biological chemistry. 2013;288:21473–21481. doi: 10.1074/jbc.R113.481549. [DOI] [PMC free article] [PubMed] [Google Scholar]
- 29.Lloyd DJ, Bohan S, Gekakis N. Obesity, hyperphagia and increased metabolic efficiency in Pc1 mutant mice. Human molecular genetics. 2006;15:1884–1893. doi: 10.1093/hmg/ddl111. [DOI] [PubMed] [Google Scholar]
- 30.Sharp LZ, et al. Human BAT possesses molecular signatures that resemble beige/brite cells. PloS one. 2012;7:e49452. doi: 10.1371/journal.pone.0049452. [DOI] [PMC free article] [PubMed] [Google Scholar]
- 31.Brestoff JR, Van den Broeck J. Study Size Planning. In: Van den Broeck Jan, Brestoff Jonathan R., editors. Epidemiology: Principles and Practical Guidelines. Dordrecht: Springer Science+Business Media; 2013. pp. 137–155. [Google Scholar]
- 32.Zagon IS, Rahn KA, Bonneau RH, Turel AP, McLaughlin PJ. Opioid growth factor suppresses expression of experimental autoimmune encephalomyelitis. Brain Res. 2010;15:154–161. doi: 10.1016/j.brainres.2009.11.026. [DOI] [PubMed] [Google Scholar]
- 33.Matthews DR, et al. Homeostasis model assessment: insulin resistance and beta-cell function from fasting plasma glucose and insulin concentrations in man. Diabetologia. 1985;28:412–419. doi: 10.1007/BF00280883. [DOI] [PubMed] [Google Scholar]
- 34.Seale P, et al. Prdm16 determines the thermogenic program of subcutaneous white adipose tissue in mice. J Clin Invest. 2011;121:96–105. doi: 10.1172/JCI44271. [DOI] [PMC free article] [PubMed] [Google Scholar]
Associated Data
This section collects any data citations, data availability statements, or supplementary materials included in this article.
Supplementary Materials
(a) Gating strategy to identify human ILCs. Stromal vascular fraction (SVF) cells from human abdominal subcutaneous white adipose tissues (WAT) were isolated and subjected to flow cytometric analyses. First plot pre-gated on singlets. Lineage cocktail 1 (Lin1): CD3, CD5, TCRαβ. Lineage cocktail 2 (Lin2): CD19, CD56, CD11c, CD16. ILCs are identified as Lin-negative cells that are CD25+ CD127+. Plots shown are from an obese donor. (b–e) SVF cells from murine epididymal (E)-WAT were isolated and subjected to flow cytometric analyses. ILCs were defined as live CD45+ Lin− CD25+ CD127+ cells. The lineage (Lin) cocktail included CD3, CD5, CD19, NK1.1, CD11c, CD11b and FcεRIα. Comparison of Lin− CD25+ CD127+ cells in E-WAT of (b) Id2+/+ versus Id2−/− bone marrow chimeras, (c) Tcf7+/+ versus Tcf7−/− mice and (d) Rag2−/− versus Rag2−/− γc−/−mice. N=3–8 mice per group from 2 independent experiments. (e) E-WAT SVF cells from C57BL/6 mice were treated with PMA (100 ng/mL) and ionomycin (1 μg/mL) in the presence of Brefeldin A (10 μg/mL) for 4h and stained for ILCs. Live CD45+ Lin− CD25+ CD127+ cells were pre-gated, and IL-5 and IL-13 protein levels were assessed. Plot shown is representative of n=12 mice from 3 independent experiments. (f) Human WAT ILC2 frequencies were compared in the 7 youngest donors (36.0 +/− 3.5 years old) versus the 7 oldest donors (55.9 +/− 1.9 years old). (g) Human WAT ILC2 frequencies in female non-obese donors with body mass index (BMI) ≥30.0 kg/m2 versus female obese donors with BMI =30.0 kg/m2. Student’s t-test. **P<0.01, ***P<0.001.
Il33+/+ (n=6) or Il33−/− (n=5) mice were fed a low fat diet (10% kcal fat) for 12 weeks starting at 7 weeks of age. (a) Representative plots and frequencies of live CD45+ Lin− CD25+ IL-33R+ ILC2s in epididymal (E)-WAT (data are from Figure 2A) and iWAT. Plots pre-gated on CD45+ Lin− cells that lack CD3, CD5, CD19, NK1.1, CD11c, CD11b and FcεRIα. (b) Frequencies of IL-5+ IL-13− and IL-5+ IL- 13+ ILC2s in E-WAT and iWAT of wildtype and IL-33-deficient mice. E-WAT stromal vascular fraction cells were treated with PMA (100 ng/mL) and ionomycin (1 μg/mL) in the presence of Brefeldin A (10 μg/mL) for 4h prior to staining for ILC2s and intracellular cytokines. Pre-gated on CD45+ Lin− CD25+ IL33R+ ILC2s. (c) Inguinal white adipose tissue (iWAT) sections were H&E stained and imaged at 40X magnification. Adipocyte area was calculated from 25–40 adipocytes total from 2–3 images per mouse. (d) 16-hour fasting blood glucose concentrations. (e) 16-hour fasting serum insulin concentrations. (f) Homeostatic model assessment of insulin resistance (HOMA-IR) index values. (g) Glucose tolerance test with 2 g/kg glucose following a 16-hour fast. (h) Insulin tolerance test with 0.5 U/kg insulin following a 5-hour fast. For panels a–f, groups were compared using Student’s t-test, *P<0.05, ***P<0.001. For panels g–h, a two-way ANOVA with repeated measures was performed followed by Tukey post-hoc test. *P<0.05, **P<0.01, ***P<0.001. Data shown are from a single cohort and are representative of 2 independent experiments. Sample sizes are biological replicates.
Male C57BL/6 mice were placed on a control diet (CD) or HFD (60% kcal fat) at age 8 weeks. On the first day of feeding, CD mice were treated with PBS and HFD mice were treated with PBS or recombinant murine (rm)IL-33 (12.5 μg/kg) once every 4 days by intraperitoneal injection for 4 weeks. (a) E-WAT ILC2 numbers per gram of adipose, (b) body weight, (c) relative E-WAT weight and (d) relative iWAT weight at week 4. (e) 16-hour fasting blood glucose concentrations and (f) glucose tolerance testing during week 3. (g) Frequencies and representative plots of E-WAT Tregs defined as live CD45+ CD3+ CD4+ Foxp3+ cells. Plots are gated on live CD45+ CD3+ CD4+ cells, and numbers are the percentage of CD4+ T cells that are Foxp3+ Tregs. (h) Numbers of Treg cells per gram of adipose. All panels include n=10 mice per group from 2 independent cohorts, except panel A which includes n=16 CD PBS and n=18 HFD PBS from 4 independent cohorts. Panels a–e, One-way ANOVA with Tukey post-hoc test,* P<0.05, **P<0.01, ***P<0.001. Panel f, Two-way ANOVA with repeated measures, ***P<0.001 comparing CD PBS vs HFD PBS, ^^^P<0.001 comparing HFD PBS vs HFD IL-33.
(a) Male C57BL/6 mice were treated with PBS or recombinant murine (rm)IL-33 (12.5 μg/kg) daily for 7 days (PBS n=10, rmIL-33, n=12). Over a 24 hour period between days 6 and 7, food intake and ambulatory activity were measured over 15 min intervals. The average difference in food intake or ambulatory activity between PBS- and rmIL-33-treated mice was calculated for each 15 min interval, and the differences in food intake and ambulatory activity were related by linear regression. Solid line, best-fit line. Dashed curves, upper and lower 95% confidence intervals around the best-fit line. (b–d) Male C57BL/6 mice were treated with PBS or recombinant murine (rm)IL-33 (12.5 μg/kg) once and monitored for the first 3 hours post-treatment using CLAMS cages (n=4/group). (b) Energy expenditure, (c) food intake and (d) ambulatory activity (beam breaks) were measured over of the first 3 hours post-treatment. Student’s t-test. ***P<0.001.
C57BL/6 male mice (10 weeks old) were treated with PBS (n=8) or IL-33 (12.5 μg/kg, n=8) daily by intraperitoneal injection for 7 days. (a) Representative plots and frequencies of Lin− CD25+ IL-33R+ ILC2s in interscapular BAT. Gated on live CD45+ Lin− cells. (b) Numbers of ILC2s per gram of BAT. (c) Ucp1 expression in BAT by real-time PCR. (d) UCP1 immunohistochemistry of BAT at 10X magnification. Scale bars, 100 μm. (e) 40X magnification of panel D. Scale bars, 100 μm. Student’s t-test, *<0.05, ***P<0.001.
(a) Experimental design for panels a–b. Live CD45+ Lin− CD25+ IL-33R+ ILC2s were sort-purified from E-WAT of CD45.1+ mice treated with 12.5 μg/kg recombinant murine (rm)IL-33 daily for 7 days by intraperitoneal injection. PBS (n=8) or ILC2s (1 × 10⁵ total, n=8) were transferred to CD45.2+ recipient mice daily for 4 days by subcutaneous injection near iWAT (5 × 10⁴ ILC2s, split evenly bilaterally) and intraperitoneal injection (5 × 10⁴ ILC2s). Tissues were harvested on day 5 for analyses. (b) Donor and recipient ILC2s in E-WAT, brown adipose tissue (BAT), mesenteric lymph nodes (mLN) and lung. iWAT ILC2 plots from this experiment are shown in main Figure 3g. Pre-gated on Live CD45+ Lin− CD25+ IL-33R+ ILC2s. Donor ILC2s are defined as CD45.1+ CD45.2−, whereas recipient ILC2s are defined as CD45.1− CD45.2+. Representative plots shown. Frequencies represent percent of ILC2s that are recipient or donor cells. Student’s t-test, ***P<0.001. (c) Experimental design for panels c–e. Sort-purified CD45.1+ ILC2s (105) from E-WAT of IL-33-treated mice (as described above) were transferred into Rag2−/− γc−/− recipients by a single intraperitoneal injection. ILC2-sufficient Rag2−/− mice, ILC2-deficient Rag2−/− γc−/− mice and ILC2-reconstituted Rag2−/− γc−/− mice were treated with PBS or rmIL-33 (12.5 μg/kg) by intraperitoneal injection daily for 7 days. This experimental design corresponds to main Figure 3l–m. (d) Representative plots of live CD45.1+ Lin− CD25+ IL33R+ ILC2s in E-WAT. Blue, recipient cells. Red, donor cells. Lineage cocktail includes CD3, CD5, CD19, NK1.1, CD11c, CD11b and FcεRIα. (e) iWAT UCP1 IHC, bar 100 μm. ANOVA with Tukey post-hoc test, ***P<0.001.
(a–f) Wildtype (Balb/c), DblGata1 mice that lack eosinophils or Il4ra−/− mice that have dysregulated alternatively activated macrophages (AAMacs) (both mutant strains on a Balb/c background) were treated with PBS or recombinant murine (rm)IL-33 (12.5 μg/kg) daily by intraperitoneal injection for 7 days. (a) iWAT ILC2 numbers per gram of adipose and (b) iWAT UCP1 immunohistochemistry (IHC) in Balb/c mice. (c) iWAT ILC2 numbers per gram of adipose and (d) iWAT UCP1 IHC in DblGata1 mice. (e) iWAT ILC2 numbers per gram of adipose and (f) iWAT UCP1 IHC in Il4ra−/− mice. (g–h) Live CD45+ Lin− CD25+ IL-33R+ ILC2s were sort-purified from E-WAT of C57BL/6 mice treated with rmIL-33 (12.5 μg/kg) daily for 5–7 days by intraperitoneal injection to Rag1−/− mice on a C57BL/6 background. ILC2s (1 × 10⁵ total) were transferred to recipient mice daily for 4 days by subcutaneous injection. (g) iWAT ILC2 numbers per gram of adipose and (h) iWAT UCP1 IHC. (i–l) Live CD45+ Lin− CD25+ IL-33R+ ILC2s were sort-purified from E-WAT of Balb/c mice treated with rmIL-33 (12.5 μg/kg) daily for 5–7 days by intraperitoneal injection. ILC2s (1 × 10⁵ total) were transferred to recipient mice daily for 4 days by subcutaneous injection. (i) iWAT ILC2 numbers per gram of adipose and (j) iWAT UCP1 IHC in DblGata1 recipients. (k) iWAT ILC2 numbers per gram of adipose and (l) iWAT UCP1 IHC in Il4ra−/− recipients. Student’s t-test, *P<0.05. Data are from n=3–6 mice per group pooled over 2–3 independent experiments. Scale bars, 100 μm.
Interleukin (IL)-33 acts on group 2 innate lymphoid cells (ILC2s) to upregulate production of the effector molecules IL-5, IL-13 and enkephalin peptides. ILC2-derived IL-5 promotes eosinophil homeostasis in WAT, and eosinophils in turn produce IL-4 to sustain alternatively activated macrophages (AAMacs) in WAT. ILC2-derived IL-13 can also promote AAMac responses. In the setting of chronic exposure to a cold environment, eosinophil-derived IL-4 stimulates AAMacs to produce catecholamines such as norepinephrine, which acts directly on beige adipocytes to upregulate uncoupling protein 1 (UCP1) expression and promote. Although it remains unknown whether ILC2-derived IL-5 and IL-13 contribute to cold stress-induced beiging, ILC2-derived enkephalin peptides can act directly on beige adipocytes to upregulate UCP1. This results in increased energy expenditure and decreased adiposity that may counteract weight gain. In the setting of obesity, IL-33 expression in WAT is increased, however WAT ILC2s are paradoxically decreased in both mice and humans, suggesting that the IL-33/ILC2 axis is dysregulated in obesity. This may impede the ability of ILC2s to contribute to the function of beige fat, resulting in a vicious cycle that promotes weight gain.