

ABSTRACT
The enteropathogenic bacterium Shigella flexneri uses a type 3 secretion apparatus (T3SA) to transfer proteins dubbed translocators and effectors inside host cells, inducing bacterial uptake and subsequent lysis of the entry vacuole. Once in the cytoplasm, the outer membrane protein IcsA induces actin polymerization, enabling cytoplasmic movement and cell-to-cell spread of bacteria. During this infectious process, S. flexneri is targeted by ATG8/LC3. The effector IcsB was proposed to inhibit LC3 recruitment by masking a region of IcsA recognized by the autophagy pathway component ATG5. The effector VirA, a GTPase-activating protein (GAP) for Rab1, was also shown to prevent LC3 recruitment. However, the context of LC3 recruitment around S. flexneri is not fully understood. Here, we show that LC3 is recruited specifically around secreting bacteria that are still present in vacuoles formed during entry and cell-to-cell spread. While LC3 recruitment occurs around a small proportion of intracellular wild-type bacteria, the icsB, virA, and icsB virA mutants display incremental defaults in escape from LC3-positive vacuoles formed during cell-to-cell spread. Our results indicate that IcsB and VirA act synergistically to allow bacteria to escape from LC3-positive vacuoles by acting at or in the immediate vicinity of the vacuole membrane(s). We also demonstrate that LC3 is recruited around bacteria still present in the single-membrane entry vacuole, in a manner akin to that seen with LC3-associated phagocytosis. Our results indicate that LC3 recruitment occurs around bacteria still, or already, in membrane compartments formed during entry and cell-to-cell spread, and not around bacteria free in the cytoplasm.
IMPORTANCE
The targeting of S. flexneri by LC3 is a classic example of the targeting of foreign cytoplasmic particles by autophagy (so-called “xenoautophagy”). It is often assumed that LC3 is recruited around bacteria present in the cytoplasm through the formation of canonical double-membrane autophagosomes. Our results indicate that LC3 is recruited around the entry vacuole composed of a single membrane as in the case of LC3-associated phagocytosis. Effectors IcsB and VirA had been implicated in the blocking of LC3 recruitment, but it was not known if they acted on the same or distinct LC3-recruiting pathways. Our results indicate that LC3 is recruited exclusively around bacteria present in vacuoles formed during entry and cell-to-cell spread and that both IcsB and VirA intervene at the latter stage to facilitate bacterial escape. Our report reconciles several findings and may have broad implications for our understanding of the specific targeting of bacterial pathogens by LC3.
INTRODUCTION
Autophagy is a cellular homeostasis process characterized by the entrapping of cytoplasmic content into double-membrane compartments dubbed autophagosomes. Fusion of the latter with late endosome/lysosome compartments (LE/Ly) leads to the formation of autophagolysosomes whose complex biochemical contents are degraded into their simpler biochemical constituents (e.g., amino acids, glucids and lipids, etc.) to be reused by the cell. The study of macroautophagy using amino acid or growth factor starvation led to the identification of the principal proteins implicated in canonical autophagosome biogenesis. In addition, specialized autophagy pathways have been described, including noncanonical autophagy-related processes that are independent of some core components of canonical autophagy and selective autophagy targeting specific organelles or, in the case of so-called “xenoautophagy,” foreign intracellular particles such as viruses and bacteria. Proteins of the family ATG8/MAP1LC3 (LC3) are implicated in every type of autophagy and are used as markers of autophagosome membranes (1, 2). LC3 is also recruited in the xenoautophagy of many intracellular bacterial pathogens, including Shigella flexneri, Salmonella enterica, Burkholderia pseudomallei, Listeria monocytogenes, group A Streptococcus, and Staphylococcus aureus, to facilitate fusion of bacterium-containing vacuoles with LE/Ly and to create a hostile environment for pathogens (2, 3). Noncanonical autophagy pathways have been implicated in several cases of xenoautophagy (2, 4). For example, intracellular B. pseudomallei is targeted by LC3-associated phagocytosis (LAP), consisting in the recruitment of LC3 directly to the bacterium-containing vacuole formed during entry (5).
S. flexneri is an enteropathogenic Gram-negative bacterium and the etiologic agent of bacterial dysentery. The intracellular infection cycle of S. flexneri includes the induction of the initial uptake (entry) of extracellular bacteria by epithelial cells in a manner akin to phagocytosis, through the delivery of bacterial translocators and effectors by its type 3 secretion apparatus (T3SA) (6) (step 1); the rupture of the entry vacuole, which requires the translocators IpaB and IpaC and potentially other effectors (7–9) and is detectable by galectin-3 (Gal-3) recruitment (10, 11) (step 2); the proliferation of bacteria in the cytoplasm of infected cells (step 3); and the cell-to-cell spread of bacteria (step 4), consisting in (i) the movement of bacteria in the cytoplasm promoted by the outer membrane protein IcsA (also known as VirG) inducing the actin polymerization at one pole of the bacterium (12) and (ii) the encountering of motile bacteria with the plasma membrane (PM), which induces (iii) the formation of protrusions that are finger-like extensions of the PM of a given cell into a neighboring receiving cell (13–15) and (iv) the secondary uptake of protrusion-trapped bacteria by the receiving cell through the formation of a secondary vacuole that is subsequently ruptured (through the action of translocators and, potentially, other effectors) and detected by Gal-3 recruitment, as during entry, to allow bacteria to gain access to the cytoplasm of the receiving cell (15–17). The iteration of steps 3 and 4 leads to the progressive invasion of the epithelial cell monolayer in vitro or of the colonic mucosa in vivo. Transcription of a subset of effector-encoding genes is positively controlled by the activity of the T3SA (18). Using a transcription-based secretion activity reporter (TSAR) to detect recent T3SA activity of individual bacteria, we demonstrated that the T3SA is active during both the initial and the secondary uptakes, when bacteria are in close contact with the PM, but not in bacteria free in the cytoplasm (19).
S. flexneri has been shown to be targeted by LC3 and to escape autophagy through the action of its effectors IcsB and VirA (20, 21). Both icsB and virA mutants were more readily associated with LC3-positive compartments and displayed a lower multiplicity index than the wild-type (WT) strain at later time points after entry (i.e., >180 min). Nevertheless, an icsB mutant displayed no spreading defect in a plaque assay performed on a polarized cell monolayer, suggesting that it was still capable of escaping autophagy, at least to a certain extent (22). More recently, the cholesterol binding domain of IcsB was implicated in the escape of bacteria from LC3-positive membrane compartments (23), indicating that perturbations in the lipid composition of the membrane of the vacuole might be implicated in its disruption. VirA was shown to act as a GTPase-activating protein (GAP) for the small GTPase Rab1 (21). Rab1, initially implicated in vesicular transport between the endoplasmic reticulum and the Golgi apparatus (24), was also recently implicated in autophagy and found to be associated to phagosomes formed around inert particles (25, 26). However, it is not known whether IcsB and VirA act on the same or on distinct LC3-recruiting pathways or whether LC3 is recruited around bacteria that are free in the cytoplasm or are present in entry or secondary vacuoles.
Here, we investigated the context of LC3 recruitment around S. flexneri and the stage at which IcsB and VirA act to favor escape of bacteria from LC3-positive vacuoles. By analyzing LC3 recruitment around intracellular WT, icsB, virA, and icsB virA bacteria, monitoring expression of the TSAR, and detecting the secreted translocator IpaB in the vicinity of bacteria, we demonstrated that LC3 is recruited solely around secreting bacteria that are in vacuoles rather than around those that are in the host cell cytoplasm. Other evidence also indicated that IcsB and VirA act synergistically on or in the vicinity of the membrane of bacterium-containing vacuoles formed during cell-to-cell spread. Correlative light electron microscopy (CLEM) indicated that the entry vacuole targeted by LC3 is composed of a single membrane. These results suggest that S. flexneri is targeted by LAP following entry and, most probably, cell-to-cell spread.
RESULTS
LC3 is recruited around actively secreting Shigella flexneri bacteria present in membrane compartments formed during cell-to-cell spread.
To investigate the relationship between the T3SA activity of individual bacteria and the recruitment of LC3 around these bacteria during cell-to-cell spread, we used WT, icsB, and virA strains expressing both the green fluorescent protein (GFP) under the control of the T3SA activity-regulated ipaH7.8 promoter (p-ipaH7.8) dubbed the TSAR and the cyan fluorescent protein (CFP) variant Cerulean under the control of the constitutive rpsM promoter (p-rpsM) carried by the pTSAR1Ud2.1 reporter plasmid (19). Human colonic epithelial TC7 cell monolayers were infected for 240 min, fixed, labeled with anti-LC3 antibodies, and analyzed by confocal microscopy to evaluate simultaneously LC3 localization and the recent T3SA activity of individual bacteria (Fig. 1A). The graph in the inset of Fig. 1A shows the occurrence of LC3 labeling on at least three sides of a bacterium relative to the total number of intracellular bacteria for the WT (15.8 ± 6.2%), icsB (24.8 ± 8.7%), and virA (35.1 ± 4.5%) strains. For these three strains, most TSAR-negative (low secretion activity) bacteria were devoid of LC3 labeling and 30 to 60% of TSAR-positive (high secretion activity) bacteria were associated with LC3 labeling. Moreover, for the two mutants, the frequency of LC3-positive bacteria was increased in the subpopulation of TSAR-positive, but not TSAR-negative, bacteria. These results indicated that LC3 recruitment was occurring only around bacteria in which the T3SA was active or had been active recently.
FIG 1 .

LC3 is recruited around actively secreting Shigella flexneri bacteria present in membrane compartments formed during cell-to-cell spread. (A) Confocal microscopy analyses of LC3 labeling and WT, icsB, or virA bacteria harboring the pTSAR1Ud2.1 plasmid in TC7 cells at 240 min postchallenge (PC) and counterstained with DAPI. The graph in the inset shows the frequency of LC3-positive bacteria (n = 10). Arrowheads and arrows indicate poorly secreting (TSAR−) or highly secreting (TSAR+) LC3-negative and LC3-positive bacteria, respectively. The graph in the right panel shows the frequency of LC3 labeling around TSAR− or TSAR+ bacteria (n = 3). All histograms show mean values and standard deviations. A one-way analysis of variance (ANOVA) and Bonferroni’s posttests for pairwise comparison were performed in both graphs, except for comparison between the same strains in the right panel, where Student’s t tests for paired data were used (*, P < 0.05; **, P < 0.01; ***, P < 0.001; ****, P < 0.0001 [for all figures]). (B) Confocal microscopy analyses of LC3 and IpaB labeling in infected TC7 cells obtained as described for panel A. Arrowheads and arrows indicate prototypical IpaB-negative and IpaB-positive bacteria, respectively. The graph in the upper right panel shows the frequency of LC3 labeling around IpaB-negative or IpaB-positive bacteria (n = 3). The graph in the lower right panel shows the frequency of IpaB-negative or IpaB-positive bacteria among LC3-positive bacteria. Statistical tests were performed as described for panel A (see also Fig. S1 to S3 in the supplemental material).
Detection of GFP expressed from a promoter regulated by the T3SA activity lags the activation of the T3SA by ~15 min. Detection of secreted translocators in the vicinity of intracellular bacteria readily permits the identification of bacteria that are still retained in the membrane compartment in which the T3SA is or had been active (19). Labeling of IpaB and LC3 was performed on TC7 cells infected for 240 min (Fig. 1B). The fraction of IpaB-positive bacteria exhibiting LC3 labeling was increased for the icsB (49.7 ± 10.4%) and virA (61.3 ± 9.9%) strains compared to the WT (37.2 ± 3.4%) strain (Fig. 1B, graph in the upper panel). Consistent with results obtained with the TSAR (Fig. 1A), LC3 labeling of WT, icsB, and virA bacteria was associated with IpaB-positive (>95%) but not IpaB-negative (<6%) bacteria. Bacterial strains unable to move in the cytoplasm and, hence, unable to induce their secondary uptake into neighboring cells, such as the icsA, icsA icsB, and icsA virA mutants, exhibited a low level of TSAR expression and scarce and rarely colocalizing IpaB and LC3 labeling at 240 min postchallenge (PC) (see Fig. S1A in the supplemental material). IpaB and LC3 labeling were rarely observed on more than 2 sides of a given bacterium. These results supported the notion that LC3 labeling surrounding bacteria after escape from the entry vacuole was due to the recruitment of LC3 to the secondary vacuole formed during cell-to-cell spread. Following the initial uptake (60 min PC), when the T3SA is activated even in the absence of IcsA (19), there were no detectable differences in LC3 labeling between the WT, icsB, and virA strains and their cell-to-cell-spreading-deficient counterparts, the icsA, icsA icsB, and icsA virA strains (see Fig. S1B). Both IpaB and LC3 labeling were often observed on three or four sides of bacteria. These data confirmed the occurrence of an IcsA-independent recruitment of LC3 during entry (27). Although the icsB, virA, icsA icsB, and icsA virA mutants are similarly targeted by LC3 during the initial uptake, the absence of a noticeable increase in the frequency of LC3 recruitment around the cell-to-cell-spreading-deficient icsA icsB and icsA virA strains at a later time point (240 min PC) indicates that they are not strongly impaired in their ability to escape from the entry vacuole.
A strong occurrence of LC3 recruitment around IpaB-positive bacteria at 240 min PC was also observed in colonic sections of guinea pigs infected by WT bacteria constitutively expressing GFP (see Fig. S2 in the supplemental material). The colocalization of LC3 and IpaB was superior to that of LC3 and GFP (Pearson’s coefficients of 0.90 and 0.53, respectively). Thus, recruitment of LC3 around intracellular bacteria in which the T3SA is active, or had been recently active, occurs during an in vivo infection.
To test whether IcsB and VirA had an effect on the autophagy pathway upstream from the recruitment of LC3, we performed labeling of IpaB and Beclin-1 or ATG12 in cells infected by the WT, icsB, and virA strains at 240 min PC. For the three strains, the presence of Beclin-1 and ATG12 was strongly correlated with the presence of IpaB around individual bacteria (>90%), and there were no significant increases in the detection of these proteins in the vicinity of icsB and virA bacteria compared to WT bacteria (see Fig. S3 in the supplemental material).
Taken together, these results suggested that the mechanism of LC3 recruitment observed in cells infected by the icsB and virA mutants is the same as, albeit more efficient than, the one observed in cells infected by the WT strain. Hence, both IcsB and VirA seem to play a role in permitting escape from LC3-positive membrane compartments formed during cell-to-cell spread.
LC3-positive vacuoles containing icsB and virA bacteria are less destabilized and acquire the LE/Ly marker LAMP2 more readily.
Since the recruitment of LC3 occurred around bacteria located in membrane compartments formed during cell-to-cell spread, we wondered whether the increased occurrence of LC3 around icsB and virA bacteria, particularly when they were or had been recently secreting (Fig. 1A), was due to a longer residence time of these bacteria inside an intact membrane compartment. To test that hypothesis, Gal-3 labeling (Gal-3 is a marker of the disruption of bacterium-containing vacuoles [10, 11]) and LC3 labeling were performed on invaded TC7 cells at 240 min PC (Fig. 2A). For the three strains, approximately 10% of intracellular bacteria exhibited Gal-3 labeling. Within the LC3-positive bacterial subpopulation, there were fewer Gal-3-positive bacteria for the icsB (52.6 ± 14.3%) and virA (20.3 ± 3.4%) strains than for the WT (70.1 ± 11.6%) strain. The strong reduction in Gal-3 labeling of LC3-positive virA bacteria suggested that virA bacteria were less effective than WT and icsB bacteria at destabilizing the LC3-positive vacuoles surrounding them. Furthermore, the high proportion of WT bacteria labeled for both LC3 and Gal-3 suggested that the recruitments of these proteins were almost simultaneous and, therefore, that vacuoles surrounding WT bacteria were destabilized soon after they were formed.
FIG 2 .

LC3-positive vacuoles containing icsB and virA bacteria are less destabilized and acquire the LE/Ly marker LAMP2 more readily. (A) Confocal microscopy analyses of LC3 and galectin-3 (Gal-3) labeling and WT, icsB, or virA bacteria harboring the pTSAR1Ud2.1 plasmid in TC7 cells at 240 min postchallenge (PC) and counterstained with DAPI. The graph with gray bars shows the frequency of Gal-3-positive bacteria (n = 3). The graph with black bars shows the frequency of Gal-3-positive bacteria among LC3-positive bacteria (n = 3). One-way ANOVA and Bonferroni’s posttests for pairwise comparison were performed. (B) Confocal microscopy analyses of LC3 and LAMP2 labeling in infected TC7 cells obtained as described for panel A. The graph with gray bars shows the frequency of LAMP2-positive bacteria (n = 3). The graph with black bars shows the frequency of LAMP2-positive bacteria among LC3-positive bacteria (n = 3). The graph in the lower panel shows the correlation between LC3 and LAMP2 labeling around S. flexneri (Sf) bacteria based on the strain-to-strain variations. The statistical tests used were the same as those described for panel A. (C) Graph showing the average number of bacteria per LC3 and/or LAMP2 cluster for the WT, icsB, virA, and icsB virA bacteria (n = 3; 15 to 54 clusters were counted per replicate of the experiment) in TC7 cells at 240 min PC. (D) Plaque formation assays performed on confluent TC7 cell monolayers with the WT, icsB, virA, and icsB virA strains. The left panels show the plaques formed by each strain. The graph in the right panel indicates the average area of plaques formed by each strain (n = 3). A one-way ANOVA and Bonferroni’s posttests for pairwise comparison were performed (see also Fig. S4 in the supplemental material).
To test whether the longer residence time of icsB and virA mutants inside the vacuole was sufficient to increase fusion events of this compartment with LE/Ly, infected TC7 cells were labeled for both the lysosomal marker LAMP2 (28) and LC3 at 240 min PC (Fig. 2B). The frequency of LAMP2-positive bacteria in the total population was lower for the WT strain (5.2 ± 1.6%) than for the icsB (19 ± 10%) and virA (31.4 ± 0.8%) strains. Among the LC3-positive subpopulation, the frequencies of LAMP2-positive bacteria were increased drastically for icsB and virA strains (71.3 ± 8.5% and 72.2 ± 8.6%, respectively) compared to the WT strain (32.2 ± 12.9%). Furthermore, for each strain, the LAMP2 labeling was strongly correlated with the LC3 labeling in the total population (y = −11.1 + 1.34×, R = 0.99). These results indicated the strong correlation between the presence of bacteria in intact LC3-positive vacuoles and the acquisition of the LAMP2 LE/Ly marker by this membrane compartment.
Results presented above indicated that IcsB and VirA are playing a role at the same stage of the infectious cycle, i.e., following the secondary uptake, to restrain association of bacteria with LC3-positive vacuoles, suggesting that these effectors might act synergistically. To test this hypothesis, an icsB virA mutant was constructed and characterized and compared to the other strains. First, the observation of intracellular icsB virA bacteria by immunofluorescence performed on invaded TC7 cells at 240 min PC revealed the formation of large bacterial clusters that affected the intracellular distribution of this mutant compared to the WT strain (see Fig. S4A in the supplemental material). To compare the sizes of clusters formed by the various strains, we counted the number of adjacent bacteria surrounded by LC3 and/or LAMP2 labeling in TC7 cells at 240 min PC (see Fig. S4B). Compared to the WT strain, the numbers of bacteria present in the clusters formed by the icsB strain or by the virA and icsB virA strains were increased approximately 2-fold and 3-fold, respectively (Fig. 2C). This result indicated that icsB, virA, and icsB virA bacteria were incrementally retained within their secondary vacuole. Moreover, the frequency of LAMP2-positive and LC3-negative clusters was increased approximately 4-fold for the icsB virA mutant compared to the virA mutant, indicating that vacuoles containing icsB virA bacteria underwent a more sustained maturation than vacuoles formed by the virA mutant (see Fig. S4B). Accordingly, the frequency of vacuolar disruption measured by Gal-3 labeling was reduced approximately 2-fold for the icsB virA mutant (6.7 ± 1.1%) compared with the virA mutant (11.9 ± 2.0%) (P < 0.05, according to a Student’s t test for unpaired data). To determine if the larger bacterial clusters observed with the icsB virA mutant were the result of the replication of bacteria present in vacuoles, we used videomicroscopy to follow the association of icsB virA bacteria harboring pTSAR1Ud2.1 with mCherry-LC3A in TC7 cells from 120 min PC. The data revealed that clusters increased through bacterial divisions over the course of the observation (see Movie S1 and Movie S2). Bacteria could nevertheless occasionally escape the LC3-positive vacuoles (see Movie S2). These results suggested that the icsB virA mutant has a stronger cell-to-cell spread defect than the icsB and virA mutants. To test this hypothesis, a plaque assay was performed on confluent TC7 cells. The numbers of plaque-forming units were similar for all strains tested (see Fig. S4C), suggesting that the entry process, including escape from the entry vacuole, was not strongly affected in the mutants. Nevertheless, plaques formed by the icsB virA mutant were 3-fold smaller than those formed by the WT strain and the icsB and virA mutants (Fig. 2D). Taken together, these observations indicate that IcsB and VirA act synergistically to enable bacterial escape from LC3-positive vacuoles.
IcsB and VirA act locally to promote escape of bacteria from LC3-positive vacuoles.
The results presented above suggested that recruitment of LC3 to bacteria was occurring in the PM-derived compartment in which the T3SA was activated. To monitor LC3 recruitment, T3SA activation, and bacterial cytoplasmic movement in real time, we used live video microscopy of MK2 cells that were expressing mCherry-LC3A and infected with the WT strain harboring pTSAR1Ud2.1 (see Movie S3 in the supplemental material). In the representative example illustrated in Fig. 3A, where time 0 min (T0) is arbitrary, the LC3 signal increased from T5 up to T28 and decreased thereafter until it disappeared at one pole of the bacterium, presumably through vacuole lysis, at T44. Then, the bacterial movement in the cytoplasm resumed almost immediately. Detection of the TSAR started at T32, i.e., ~25 min after the appearance of the LC3 labeling, increased steadily, and reached a plateau at T64, i.e., ~22 min after the disappearance of the LC3 labeling. Due to the time required for maturation of GFP, there is an ~15 min delay between the activation of the T3SA-regulated promoter controlling expression of the GFP and the detection of the TSAR signal (19). Therefore, these observations suggest that effectors are secreted and function shortly after LC3 recruitment to promote vacuolar escape.
FIG 3 .

The effectors IcsB and VirA act locally to promote escape of bacteria from LC3-positive vacuoles. (A) Time lapse microscope images of MK2 cells transfected with a plasmid encoding mCherry-LC3A and infected with WT bacteria harboring pTSAR1Ud2.1 starting at 120 min PC (T0) (see Movie S1 in the supplemental material). The insets show magnified views of the mCherry-LC3 signal in the vicinity of the bacterium as delimited by the boxed areas. Note that for T46 the inset is rotated by 90° with respect to the corresponding boxed area. Insets were pseudocolored according to the mCherry-LC3 signal intensity (blue, low signal; red, high signal). The graph in the right panel shows the variation in TSAR and LC3 normalized pixel intensities through time for that bacterium. The dashed line indicates the time point at which the movement of the bacterium resumed. (B) Confocal microscopy analysis of VirA-Myc, LC3, and IpaB labeling in TC7 cells infected by the virA mutant harboring a plasmid encoding WT or Rab GAP-dead (R188K/Q280A) VirA-Myc at 240 min PC. The graph in the right panel shows the recruitment of LC3 around WT and GAP-dead VirA-Myc-positive bacteria (approximately 30 bacteria were considered for each strain). A Student’s t test for unpaired data with unequal variance was performed. (C) Confocal microscopy analysis of LAMP2 in TC7 cells coinfected with WT bacteria harboring pTSAR1Ud2.4s (p-rpsM-mCherry) and icsB virA bacteria harboring pTSAR1Ud2.1 (p-rpsM-Cerulean) at 240 min PC. Arrowheads and arrows indicate WT and icsB virA bacteria, respectively (see also Fig. S5 and Movie S3).
The role of IcsB and VirA in promoting bacterial escape from secondary vacuoles during cell-to-cell spread suggests that these effectors might act on or in the immediate vicinity of the membrane. To investigate where IcsB and VirA are located during infection, icsB and virA strains were complemented with plasmids encoding Myc-tagged versions of IcsB WT, VirA WT, or VirA R188K/Q280A devoid of GAP activity toward Rab1 (21) (see Fig. S5A in the supplemental material). Localization of LC3, IpaB, IcsB-Myc, and VirA-Myc was performed in invaded TC7 cells at 240 min PC (Fig. 3B; see also Fig. S5B). Most Myc-positive bacteria were IpaB positive (89%, 97%, and 97% for IcsB-Myc, VirA-Myc, and GAP-dead VirA-Myc, respectively). These Myc-positive bacteria were also frequently LC3 positive (19%, 44%, and 67% for IcsB-Myc, VirA-Myc, and GAP-dead VirA-Myc, respectively), consistent with a direct action of IcsB and VirA on LC3-positive vacuoles. A significantly larger amount of LC3 was associated with vacuoles labeled with the secreted GAP-dead variant of VirA than with the WT VirA (Fig. 3B, right panel), supporting the idea of a role for the GAP activity of VirA in promoting escape of bacteria from LC3-positive vacuoles.
To investigate whether IcsB and VirA act in the immediate vicinity of secreting bacteria, coinfection experiments performed with the WT strain and each of the icsB, virA, and icsB virA mutants were performed in TC7 cells. To differentiate the WT from the mutant strains, the WT strain harbored pTSAR1Ud2.1 encoding Cerulean under the control of p-rpsM and the icsB, virA, and icsB virA strains harbored pTSAR1Ud.4s encoding mCherry under the control of p-rpsM. Samples were processed for LAMP2 labeling at 240 min PC (Fig. 3C; see also Fig. S5C in the supplemental material). Within the same cell, icsB virA bacteria formed LAMP2-positive clusters as described above, while WT bacteria remained devoid of LAMP2 labeling. The sizes of the bacterial clusters formed by icsB virA in the context of coinfection and in regular infection were similar (see Fig. S5C). Similar results were obtained upon coinfections by the WT strain and the icsB or virA mutants (see Fig. S5C). These results indicated that the lack of production of IcsB or VirA by the mutants was not complemented in trans by IcsB and VirA produced by WT bacteria infecting the same cell, suggesting that these effectors exert their function in the immediate vicinity of the bacterium-containing vacuole.
LC3 is recruited to Shigella flexneri entry vacuoles composed of a single membrane.
The experiments whose results are presented above focused on the recruitment of LC3 on the secondary vacuoles formed during cell-to-cell spread. In this compartment, bacteria are surrounded by two cellular membranes, the PM of the cell from which the bacterium creates a protrusion and the PM of the cell in which the protrusion enters (13, 14, 19), in a process independent of canonical autophagy pathways. LC3 is also recruited during the entry process around secreting bacteria (see Fig. S1 in the supplemental material). To determine the number of membranes surrounding LC3- and TSAR-positive bacteria following entry of bacteria in epithelial cells, a correlative light and electron microscopy (CLEM) experiment was designed. TC7 cells were transfected with mCherry-LC3A and processed for observation 60 min PC by the WT or icsB virA strain (Fig. 4; see also Fig. S6). EM images obtained from cells infected by each strain demonstrated that secreting (TSAR-positive) bacteria were present in an LC3-positive compartment composed of a single membrane. This result strongly supported the hypothesis that LC3 is recruited to S. flexneri-containing vacuoles in a manner akin to that seen with LAP.
FIG 4 .
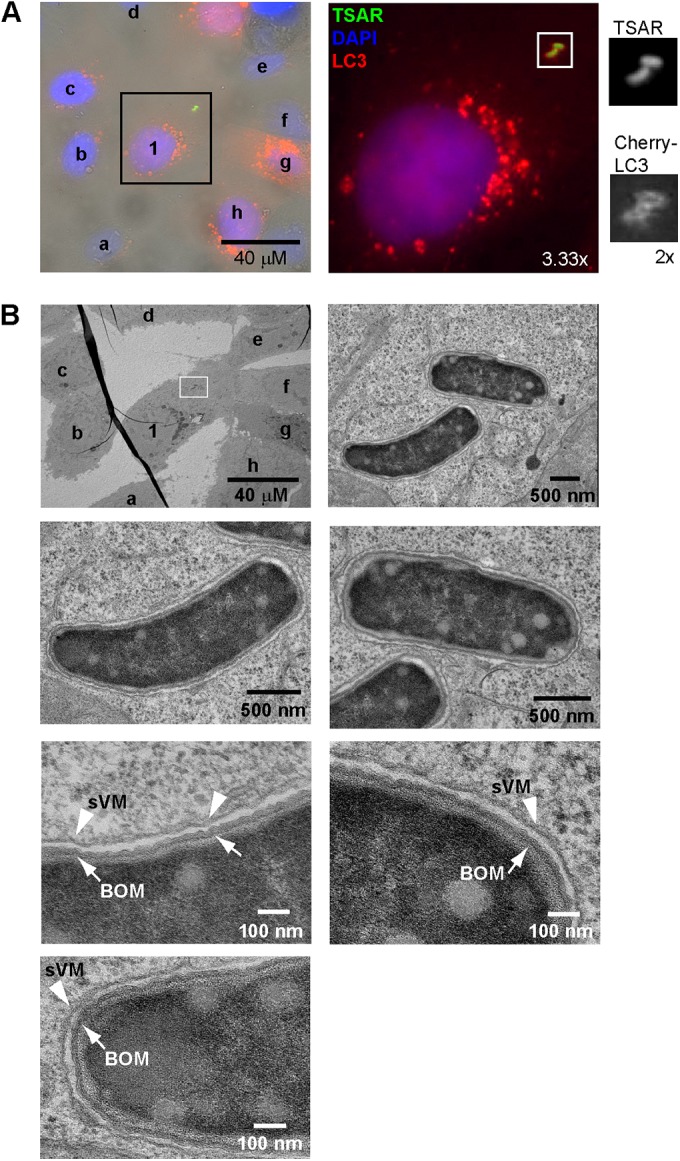
LC3 is recruited to Shigella flexneri entry vacuoles composed of a single membrane. (A) Light-fluorescence microscope images of TC7 cells transfected with a plasmid encoding mCherry-LC3A and infected with icsB virA bacteria harboring pTSAR1Ud2.1 at 60 min PC. TSAR-positive bacteria such as those in the boxed area were selected for observation by electron microscopy (EM). The number and letters indicate the cell of interest and its neighboring cells, respectively, and match the corresponding cells labeled in panel B. (B) Cells and bacteria in the region of interest indicated in panel A recovered from the corresponding grid and observed by EM. The bottom left panels display the membrane morphology of the slightly curved bacteria; the bottom right panels display the membrane morphology of the other bacterium in the field of interest. Arrows and arrowheads indicate the bacterial outer membrane (BOM) and the vacuolar membrane (sVM), respectively (see also Fig. S6 in the supplemental material).
DISCUSSION
Results presented here demonstrated that LC3 is recruited specifically around secreting bacteria that, as previously shown (19), are present exclusively in PM-derived membrane compartments formed during entry and cell-to-cell spread. This study also indicated that icsB, virA, and icsB virA mutants are more efficiently retained in LC3-positive vacuoles than the WT strain during cell-to-cell spread (240 min PC). The LC3-positive secondary vacuoles formed by the icsB, virA, and icsB virA mutants contained more bacteria, were less associated with Gal-3, and fused more readily with LE/Ly compartments than their counterparts formed by the WT strain. Furthermore, compared to the WT strain, the icsB and virA bacteria trapped in these membrane compartments were more frequently TSAR positive, suggesting that the mutants were residing for a longer period in membrane compartments endowed with an improved capacity to maintain their integrity and the T3SA activity. The strong spreading defect exhibited by the icsB virA mutant, compared to the icsB and virA mutants, is evidence that IcsB and VirA act in synergy, most likely on different targets. The idea of local action of IcsB and VirA is supported by the inability of WT bacteria to complement in trans icsB, virA, or icsB virA mutants infecting the same cell.
Does the mechanism leading to the recruitment of LC3 around intracellular S. flexneri correspond to classical autophagy, in which a cytoplasmic bacterium gets surrounded by two cellular membranes, or to a process of LAP operating on the membrane of an entry vacuole or of a secondary vacuole obtained by internalization of a protrusion by a neighboring cell? The observation that vacuoles labeled by LC3 upon entry of S. flexneri into epithelial cells are composed of a single membrane unambiguously indicates that LC3 recruitment at the membrane of the entry vacuole corresponds to LAP, as proposed previously (27). Since canonical autophagosomes and internalized protrusions are both limited by two cellular membranes, they cannot be distinguished on the basis of the number of membranes limiting these compartments. Through the use of conditional systems to control gene expression in intracellular bacteria, the T3SA and IpaB and IpaC were shown to be required for cell-to-cell spread (13, 14, 19). The compartment in which bacteria devoid of IpaB or IpaC were trapped was limited by two cellular membranes and contained a dense material interpreted as being composed of polymerized actin, suggesting that it corresponded to internalized protrusions (13, 14). Other works showed that an icsA mutant (unable to induce the formation of protrusions) was present in an LC3-positive compartment shortly after entry (27), but not at later time points (20). These observations were interpreted as an indication that there are two types of LC3 recruitment, an IcsA-independent recruitment following the initial uptake and an IcsA-dependent recruitment afterward (27). Detection of interactions between IcsA and both IcsB and ATG5, together with the absence of LC3 recruitment on an icsA icsB mutant, led to the proposal that IcsB prevents the binding of ATG5 to IcsA (VirG), thereby blocking subsequent steps in the autophagy pathway, including LC3 recruitment (20). However, at a late time point postentry (240 min PC), the absence of LC3 recruitment around icsA, icsA icsB, and icsA virA bacteria appeared to be mostly due to the inability of these mutants to induce secondary uptake events. Results presented here suggest the following model for the association of LC3 to intracellular bacteria (Fig. 5): LC3 is recruited onto S. flexneri-containing vacuoles formed upon uptake of both extracellular bacteria (during entry) and protrusions (during cell-to-cell spread); and IcsB and VirA facilitate escape from LC3-positive vacuoles formed during cell-to-cell spread by acting on or in the immediate vicinity of the membrane(s) of these vacuoles, destabilizing them and avoiding the fusion with LE/Ly that would reduce bacterial fitness and dissemination.
FIG 5 .

Scheme describing the role of the effectors IcsB and VirA in the escape of actively secreting S. flexneri from LC3-positive vacuoles formed in epithelial cells. Nonsecreting bacteria present in the extracellular medium come into contact with the host cell membrane, inducing their own uptake through secretion of translocators and effectors by the T3SA (step 1). LC3, translocators, and effectors, including IcsB and VirA, associate with the entry vacuole (step 2); the translocators IpaB and IpaC, with lesser contributions from other effectors, induce vacuole rupture (step 3), which allows bacteria to gain access to the cytoplasm, where the activity of the T3SA is turned off and bacteria replicate (step 4). Upon access to the cytoplasm of the infected cell, bacteria start forming actin comet tails using the IcsA outer membrane protein (step 5) and move in the cytoplasm to form protrusions (step 6), where the T3SA is reactivated. Bacteria that fail to form a protrusion, such as the icsA mutant, cannot induce secondary uptake events and their T3SA is not reactivated. Protrusions are taken up by neighboring cells, forming secondary vacuoles composed of a double membrane that is associated, similarly to the entry vacuole, with LC3, IcsB, VirA, and the translocators (step 7). However, IcsB and VirA play a more prominent role in the escape from the LC3-positive vacuole during secondary uptake compared to the initial uptake. In the WT strain, IcsB and VirA facilitate escape from the LC3-positive vacuole to access the cytoplasm and continue cell-to-cell spreading (step 7A). In contrast, the icsB virA mutant is defective in cell-to-cell spreading because it is not able to efficiently escape its LC3-positive vacuole that matures further, as indicated by acquisition of the LE/Ly marker (LAMP2) (step 7B).
Our results indicate that the icsB, virA, and icsB virA mutants are impaired in their ability to escape from the secondary, but not the entry, vacuole in polarized epithelial cells. These two vacuoles differ in several aspects, including the number of membranes limiting them (the entry vacuole is limited by one membrane, whereas the secondary vacuole is limited by two membranes) and the leaflet of the PM facing the bacterium (the outer leaflet in the entry vacuole and the inner leaflet in the secondary vacuole). The detailed mechanisms by which IcsB and VirA contribute to destabilizing bacterium-containing secondary vacuoles remain to be elucidated. The cholesterol binding property of IcsB and its proposed protease or acyltransferase activities (23, 29) and the GAP activities of VirA toward Rab1 (21) might be involved in either accelerating the disruption of the vacuole or blocking repair mechanisms of a vacuole destabilized by the insertion of translocators IpaB and IpaC. Depending on the cell type, the lipid and protein composition of the entry vacuole might affect the stability of its membrane and, hence, its sensitivity to different effectors. Even though IcsB and VirA do not appear to be required for escape of the entry vacuole in epithelial cells in vitro, they might be necessary for escape in other cell types.
Ubiquitin-receptor molecules such as p62/SQSTM1, NDP52, and optineurin have been implicated in the recognition of ubiquitin-decorated intracellular pathogens, including Salmonella enterica (serovar Typhimurium) and S. flexneri, and the ensuing recruitment of LC3 (11, 27, 30–33). The recruitment of p62 and NDP52 occurred specifically around bacteria present in a disrupted vacuolar compartment (11, 31, 34), suggesting that the genuine danger signal responsible for ubiquitin-receptor recruitment is the disruption of the vacuole. In the case of WT S. flexneri, we showed that LC3 was recruited to bacteria located in disrupted vacuoles, as indicated by the concomitant recruitment of Gal-3, rather than on cytosolic nonmotile bacteria. The decreased Gal-3 labeling among the subpopulation of LC3-positive bacteria in the icsB and virA mutants, compared to the WT strain, may not reflect a change in the mechanism of ubiquitin receptors or Gal-3 recruitment but may rather be the consequence of the diminished capacity of these mutants to escape from their secondary vacuoles. The formation of septin cages has emerged as a mechanism that could restrain cell-to-cell spread by retaining S. flexneri within LC3-positive compartments (35). IcsB was also implicated in the escape from septin cages associated with p62 and NDP52 (32, 35), suggesting that septins might also be recruited specifically around secreting S. flexneri. Further studies will be necessary to address the role of ubiquitin receptors and septins in LC3 recruitment around secreting bacteria.
LAP is increasingly implicated in the response to bacterial infections, including infections by Mycobacterium avium, S. Typhimurium, Yersinia tuberculosis, and B. pseudomallei (4, 36). In LAP, recruitment of LC3 was previously shown to increase fusion of phagosomes with LE/Ly, thus enhancing killing of ingested organisms (37, 38). LC3 recruitment in LAP is independent of Unc-51-like kinase 1 (ULK1), is activated by Toll-like receptors, and depends on the presence of a functional NADPH oxidase (2, 37–39). These specific properties distinguish LAP from canonical autophagy and, hence, may allow pharmacologically targeting infection-specific processes while keeping the core macroautophagy machinery intact.
MATERIALS AND METHODS
S. flexneri strains.
Shigella flexneri 5a strain M90T-Sm (GenBank accession no. CM001474.1) harboring the pWR100 virulence plasmid (GenBank accession no. AL391753.1) and a streptomycin resistance mutation was used as the wild-type (WT) strain (40). Mutant strains icsA-1 (FXS297) and icsB-2 (FXS299) were previously described (12, 22). The virA-3 (FXS570), icsA-1 virA-3 (FXS645), and icsB-2 virA-3 (FXS572) strains were generated from the WT, icsA-1, and icsB-2 mutants by allelic exchange (41). To construct the virA-3 mutant (FXS570), the cat gene was inserted between nucleotides 144656 and 145596 of virA (virA open reading frame [ORF] coordinates in pWR100, 144615 to 145817). The icsA-3 icsB-2 strain (FXS626) was also generated from the icsB-2 strain by allelic exchange. To construct the iscA-3 allele in the icsB-2 mutant, the cat gene was inserted between nucleotides 146685 and 149315 of icsA (icsA ORF coordinates in pWR100, 146346 to 149654).
Plasmids.
TSAR plasmids were described previously (19, 42). Briefly, pTSAR1Ud2.1 is a dual-promoter reporter system consisting in the gene encoding GFPsfm2 placed under the control of p-ipaH7.8, which is strongly upregulated when the T3SA is active, and the gene encoding the Cerulean (CFP variant) placed under the control of the constitutively active p-rpsM; pTSAR1Ud2.4s encodes mCherry in place of Cerulean. The coding sequences of effector genes icsB and virA were cloned through PacI and XbaI and through EcoRI and BamHI, respectively, into the pSU2.1tt plasmid, which is derived from pSU2718 by the addition of the transcription terminator of trpA upstream of the promoter of the effectors. IcsB was expressed from the lac promoter and VirA from its endogenous promoter (nucleotide coordinates in pWR100, 145818 to 145949) (43, 44). In the subcloning process, the sequence encoding a 2-amino-acid spacer (underlined) and the Myc tag (SGEQKLISEEDL) was introduced to the 3′ end of both coding sequences. To generate the GAP-dead variant (21), mutations corresponding to R188K and Q280A were introduced into virA using PCR-based mutagenesis. The resulting plasmids were named pSU2.1tt-IcsB-Myc and pSU2.1tt-VirA-Myc (WT and GAP-dead), respectively. The MAP1LC3A coding sequence was inserted between the NsiI and XhoI sites located in 3′ of the mCherry coding sequence in the pUBCΔ plasmid derived from pUB6/V5-His (Life Technologies) by the insertion of an alternative multiple-cloning site (MCS) and removal of the V5-His coding sequence and the two NsiI restriction sites occurring outside the MCS. The resulting chimeric gene encoding mCherry-MAP1LC3A was transcribed from the ubiquitin C promoter. The resulting plasmid was named pUBCΔ-mCherry-LC3A.
Immunofluorescence on infected cells.
Infections, fixation, and permeabilization of TC7 cells were performed as described previously (19, 42) (see Text S1 in the supplemental material). Samples were incubated with the primary antibodies overnight at 4°C. Rabbit polyclonal primary antibodies recognizing MAP1LC3A, MAP1LC3B, and MAP1LC3C (PM036; MBL International) were used. Since there is significant lot-to-lot variation associated with this antibody, experiments were mostly performed with lot 025, producing, for example, less nonspecific cross-reactivity with bacteria than lot 028; goat polyclonal primary antibodies recognizing the c-Myc tag (A190-104A; Bethyl Laboratories) were used; and mouse monoclonal antibodies recognizing galectin-3 (556904; BD Biosciences), LAMP2/CD107b (555803; BD Biosciences), and IpaB (H16 [45]) were used. Secondary antibodies conjugated to Alexa Fluor 568 and 647 (Life Technologies) were used and incubated with samples for 120 min at room temperature. Cells were usually counterstained with DAPI (4[prime],6-diamidino-2-phenylindole); Mowiol was used with DABCO (1,4-diazabicyclo[2.2.2]octane) (Sigma-Aldrich) as the mounting medium.
Plaque formation assay.
Plaque formation assays were performed as described previously (46). The area (A) of 8 to 10 plaques per strain for each experiment was obtained by measuring the diameter (d) of a circle encompassing each plaque scrutinized and was calculated as follows: A = π × (d/2)2.
Video microscopy.
MK2 and TC7 cells were plated in 35-mm-diameter glass-bottom dishes (reference no. 81158; IBIDI GmBH, Martinsried, Germany) coated with 50 µg/ml rat tail collagen (reference no. A1048301; Life Technologies) and 25 µg/ml fibronectin (reference no. F0895; Sigma-Aldrich), respectively, at 2 × 10⁵ cells per well. Cells were transfected 20 to 24 h later with 2.5 µg of a plasmid allowing expression of mCherry-LC3A using 5 µl of Lipofectamine 2000 (Life Technologies), following the protocol suggested by the supplier. Infections were performed with polylysine-coated WT or icsB virA bacteria harboring pTSAR1Ud2.1 (19), at a multiplicity of infection (MOI) of ~25, for 10 min at room temperature. Acquisitions of images were performed in Dulbecco’s modified Eagle’s medium (DMEMGFP-2; Evrogen, Moscow, Russian Federation) supplemented or not with 5% fetal bovine serum (FBS) and 10 µg/ml gentamycin and followed for 1 to 2 h (in general) at a rate of 1 image/min, under a controlled atmosphere (5% CO2 and 37°C). Arrows in Movie S2 in the supplemental material were introduced using Icy. Pseudocolored images were created using Rainbow red-green-blue (RGB) coloring in Fiji (ImageJ) Lookup Tables. Pixel intensities were measured using Fiji (ImageJ) region-of-interest (ROI) and Measure tools.
Correlative light and electron microscopy (CLEM).
TC7 cells were plated at 1.5 × 10⁵ to 2.0 × 10⁵ cells per well on 35-mm-diameter dishes with a glass bottom and grid (reference no. P35G-2-14-C-GRID; MatTek, Ashland, MA) coated with human serum fibronectin (Sigma-Aldrich). Coating was obtained by incubation of the coverslip with 25 mg/ml fibronectin–phosphate-buffered saline (PBS) for from 120 min to overnight and three washing steps with PBS and one with growth medium. Cells were transfected 20 to 24 h later with 2.5 µg of a plasmid expressing mCherry-LC3A from a ubiquitin promoter using 5 µl of Lipofectamine 2000 (Life Technologies) following the protocol suggested by the supplier. At 24 h later, cells were infected with polylysine-coated WT or icsB virA bacteria at a MOI of ~25 for 10 min at room temperature. The medium was replaced with prewarmed (37°C) chase medium, and cells were incubated for 30 min at 37°C under 5% CO2. The medium was again aspirated, replaced with chase medium supplemented with gentamicin (50 µg/ml), and incubated at 37°C under 5% CO2 for 25 min. Samples were then processed for fixation and light and electron microscopy as described previously (19) (see Text S1 in the supplemental material).
SUPPLEMENTAL MATERIAL
Supplemental Materials and Methods. Download
LC3 recruitment and T3SA activation are both induced in an IcsA-dependent manner during cell-to-cell spread and in an IcsA-independent manner during entry. (A) Confocal microscopy analysis of LC3 and IpaB labeling and icsA, icsA icsB, or icsA virA bacteria harboring the pTSAR1Ud2.1 plasmid (encoding GFPsfm2 under the control of the T3SA-regulated promoter p-ipaH78 [TSAR] and Cerulean under the control of the constitutive promoter p-rpsM [rpsM]) in T7 cells at 240 min postchallenge (PC) and counterstained with DAPI. (B) Confocal microscopy analyses of LC3 and IpaB labeling and WT, icsB, virA, icsA, icsA icsB, or icsA virA bacteria harboring the pTSAR1Ud2.1 plasmid at 60 min PC and counterstained with DAPI. Labeling colors in the overlays are as described for panel A. Download
LC3 is recruited around secreting bacteria in vivo. Confocal microscopy analysis of LC3 and IpaB labeling and WT S. flexneri expressing constitutively GFPmut3 from the pFPV25.1 plasmid in colon sections of guinea pigs at 240 min PC. In the lower panels, magnified views of the boxed region in each section are shown. The central panel shows the orthogonal view of the Z-stack reconstruction of the dashed box region in the leftmost section. The right panels show a magnified view of the region in the rightmost section. The bottom right panels display the Pearson’s coefficient for IpaB and GFP versus LC3 labeling. Download
Autophagy pathways components Beclin-1 and ATG12 acting upstream from LC3 are not more frequently recruited to icsB and virA mutants than to the WT strain. (A) Confocal microscopy analysis of Beclin-1 (Bcn1) and IpaB labeling and WT, icsB, and virA bacteria harboring the pTSAR1Ud2.1 plasmid in TC7 cells at 240 min PC and counterstained with DAPI. (B) Confocal microscopy analyses of ATG12 and IpaB labeling in infected TC7 cells obtained as described for panel B. (C) Graph indicating the frequency of Bcn1- or ATG12-positive bacteria (a minimum of 267 bacteria were counted per replicate of the experiment; n = 3). One-way ANOVA and Bonferroni’s posttests for pairwise comparison were performed for both types of labeling. Variations between strains for both labeling were all found to be not significant (ns; P > 0.05). Download
Properties of the bacterial clusters formed by the WT, icsB, virA, and icsB virA strains. (A) Confocal microscopy analyses of LC3 labeling and WT and icsB virA bacteria harboring the pTSAR1Ud2.1 plasmid in TC7 cells at 240 min postchallenge (PC). The images are maximal-intensity projections of 11 and 13 z-stacks, respectively, at intervals of 0.4 µm obtained with a 40× objective. Signals of p-rpsM-Cerulean and TSAR were both pseudocolored white to locate all bacteria. Samples were counterstained with DAPI to reveal the host cell nuclei. (B) Prototypical confocal microscopy images of LC3 and LAMP2 labeling and WT, icsB, virA, and icsB virA bacteria harboring the pTSAR1Ud2.1 plasmid in TC7 cells at 240 min PC used for the analysis of the number of bacteria per cluster. The graph in the upper right panel indicates the frequency of bacteria that are both LAMP2 -positive and LC3 -negative. A one-way ANOVA and Bonferroni’s posttests for pairwise comparison were performed. (C) Relative numbers of plaque-forming units formed by the WT, icsB, virA, and icsB virA strains compared to the icsA strain that is completely deficient in cell-to-cell spread (n = 3). A one-way ANOVA and Bonferroni’s posttests for pairwise comparison were performed. Variations between strains were not significant (P > 0.05). Download
Data confirming expression of IcsB-Myc and VirA-Myc and related to the transcomplementation of icsB, virA, and icsB virA mutants by the WT strain. (A) Immunoblot on total bacterial lysates of an icsB mutant harboring a plasmid encoding WT IcsB-Myc and a virA mutant harboring a plasmid encoding VirA (WT or Rab GAP-dead)-Myc. (B) Confocal microscopy analysis of IcsB-Myc, LC3, and IpaB labeling in TC7 cells infected by the icsB mutant harboring a plasmid encoding WT IcsB-Myc at 240 min PC. (C) Confocal microscopy analyses of LAMP2 labeling in TC7 cells coinfected with WT bacteria harboring pTSAR1Ud2.4s (p-rpsM-mCherry) and icsB, virA, or icsB virA bacteria harboring pTSAR1Ud2.1 (p-rpsM-Cerulean) at 240 min PC. The graph in the upper right panel shows the average number of bacteria per LAMP2 cluster for the icsB virA bacteria (n = 3; data reproduced from Fig. 2C) and for the icsB virA bacteria coinfecting with WT bacteria (n = 2; >15 clusters were counted in each replicate) TC7 cells at 240 min PC. A Student’s (unpaired) t test with equal variance was performed. Variations between conditions were not significant (P > 0.05). Download
The LC3-positive S. flexneri-containing vacuole is composed of a single membrane. Light-fluorescence microscope images of TC7 cells transfected with a plasmid encoding mCherry-LC3 and infected for 60 min with bacteria harboring pTSAR1Ud2.1 are shown. TSAR-positive bacteria such as those in the boxed area were selected for observation by electron microscopy (EM). Cells and bacteria in the region of interest were recovered from the corresponding grid and observed by EM. The “1” and the letters indicate the cell of interest and neighboring cells, respectively, in the light-fluorescence images and the corresponding EM images. Arrows and arrowheads indicate the bacterial outer membrane (BOM) and the vacuolar membrane (sVM), respectively. (A and B) WT bacteria. (C) icsB virA bacteria. Download
icsB virA bacteria replicate and remain inside mCherry-LC3A-positive vacuoles. The movie consists of time lapse videomicroscopy of icsB virA bacteria harboring the pTSAR1Ud2.1 plasmid and trapped in an mCherry-LC3A-positive membrane compartment in TC7 cells between 120 and 300 min PC; trapped bacteria replicated within this mCherry-LC3A-positive membrane compartment. Images were obtained with a light microscope equipped with light-emitting diodes (LEDs) as the light source at a rate of 1 per min. The movie shown here corresponds to 96 min of observation at the rate of 15 images/s. Download
icsB virA bacteria replicate and occasionally escape mCherry-LC3A-positive vacuoles. The movie consists of time lapse videomicroscopy of icsB virA bacteria harboring the pTSAR1Ud2.1 plasmid and trapped in an mCherry-LC3A-positive membrane compartment in TC7 cells between 120 and 300 min PC; bacteria replicated within this compartment and occasionally escaped from the mCherry-LC3A-positive membrane compartment as indicated by arrows. Images were obtained with a light microscope equipped with light-emitting diodes (LEDs) as the light source at a rate of 1 per min. The movie shown here corresponds to 180 min of observation at the rate of 7.5 images/s. Download
Bacteria found in an LC3-positive compartment are secreting. The movie consists of time lapse videomicroscopy of WT bacteria harboring the pTSAR1Ud2.1 plasmid and performing cell-to-cell spread in MK2 cells transfected with mCherry-LC3A. Images were obtained with a light microscope equipped with light-emitting diodes (LEDs) as the light source at a rate of 1 per min. The movie shown here corresponds to 70 min of observation at the rate of 5 images/s. This movie was used to extract the data shown in Fig. 3A. Download
ACKNOWLEDGMENTS
We thank Emanuelle Peret and Jean-Yves Tinevez of the PFID for microscopy training, Giulia Nigro and Ellen T. Arena for help with guinea pig experiments, Laurie Pinaud for the gift of the pSU2.1tt plasmid, Pamela Schnupf for careful reading of the manuscript, and Guy Tran Van Nhieu and his group for discussions and help.
F.-X.C.-V. was a CIHR, EMBO, Marie-Curie-IRG, and FRM fellow. P.J.S. is an HHMI Senior International Research Scholar. This work was supported by the ERC (P.J.S.; Advanced Grant no. 232798 and 339579) and AVIESAN (C.P.; project T3SS).
Footnotes
Citation Campbell-Valois F-X, Sachse M, Sansonetti PJ, Parsot C. 2015. Escape of actively secreting Shigella flexneri from ATG8/LC3-positive vacuoles formed during cell-to-cell spread is facilitated by IcsB and VirA. mBio 6(3):e02567-14. doi:10.1128/mBio.02567-14.
REFERENCES
- 1.He C, Klionsky DJ. 2009. Regulation mechanisms and signaling pathways of autophagy. Annu Rev Genet 43:67–93. doi: 10.1146/annurev-genet-102808-114910. [DOI] [PMC free article] [PubMed] [Google Scholar]
- 2.Huang J, Brumell JH. 2014. Bacteria-autophagy interplay: a battle for survival. Nat Rev Microbiol 12:101–114. doi: 10.1038/nrmicro3160. [DOI] [PMC free article] [PubMed] [Google Scholar]
- 3.Baxt LA, Garza-Mayers AC, Goldberg MB. 2013. Bacterial subversion of host innate immune pathways. Science 340:697–701. doi: 10.1126/science.1235771. [DOI] [PubMed] [Google Scholar]
- 4.Lai SC, Devenish RJ. 2012. LC3-associated phagocytosis (LAP): connections with host autophagy. Cells 1:396–408. doi: 10.3390/cells1030396. [DOI] [PMC free article] [PubMed] [Google Scholar]
- 5.Gong L, Cullinane M, Treerat P, Ramm G, Prescott M, Adler B, Boyce JD, Devenish RJ. 2011. The Burkholderia pseudomallei type III secretion system and BopA are required for evasion of LC3-associated phagocytosis. PLoS One 6:e17852. doi: 10.1371/journal.pone.0017852. [DOI] [PMC free article] [PubMed] [Google Scholar]
- 6.Cossart P, Sansonetti PJ. 2004. Bacterial invasion: the paradigms of enteroinvasive pathogens. Science 304:242–248. doi: 10.1126/science.1090124. [DOI] [PubMed] [Google Scholar]
- 7.Blocker A, Gounon P, Larquet E, Niebuhr K, Cabiaux V, Parsot C, Sansonetti P. 1999. The tripartite type III secretion of Shigella flexneri inserts IpaB and IpaC into host membranes. J Cell Biol 147:683–693. doi: 10.1083/jcb.147.3.683. [DOI] [PMC free article] [PubMed] [Google Scholar]
- 8.Zychlinsky A, Kenny B, Ménard R, Prévost MC, Holland IB, Sansonetti PJ. 1994. IpaB mediates macrophage apoptosis induced by Shigella flexneri. Mol Microbiol 11:619–627. doi: 10.1111/j.1365-2958.1994.tb00341.x. [DOI] [PubMed] [Google Scholar]
- 9.Mellouk N, Weiner A, Aulner N, Schmitt C, Elbaum M, Shorte SL, Danckaert A, Enninga J. 2014. Shigella subverts the host recycling compartment to rupture its vacuole. Cell Host Microbe 16:517–530. doi: 10.1016/j.chom.2014.09.005. [DOI] [PubMed] [Google Scholar]
- 10.Paz I, Sachse M, Dupont N, Mounier J, Cederfur C, Enninga J, Leffler H, Poirier F, Prevost MC, Lafont F, Sansonetti P. 2010. Galectin-3, a marker for vacuole lysis by invasive pathogens. Cell Microbiol 12:530–544. doi: 10.1111/j.1462-5822.2009.01415.x. [DOI] [PubMed] [Google Scholar]
- 11.Dupont N, Lacas-Gervais S, Bertout J, Paz I, Freche B, Van Nhieu GT, van der Goot FG, Sansonetti PJ, Lafont F. 2009. Shigella phagocytic vacuolar membrane remnants participate in the cellular response to pathogen invasion and are regulated by autophagy. Cell Host Microbe 6:137–149. doi: 10.1016/j.chom.2009.07.005. [DOI] [PubMed] [Google Scholar]
- 12.Bernardini ML, Mounier J, d’Hauteville H, Coquis-Rondon M, Sansonetti PJ. 1989. Identification of icsA, a plasmid locus of Shigella flexneri that governs bacterial intra- and intercellular spread through interaction with F-actin. Proc Natl Acad Sci U S A 86:3867–3871. doi: 10.1073/pnas.86.10.3867. [DOI] [PMC free article] [PubMed] [Google Scholar]
- 13.Schuch R, Sandlin RC, Maurelli AT. 1999. A system for identifying post-invasion functions of invasion genes: requirements for the Mxi-Spa type III secretion pathway of Shigella flexneri in intercellular dissemination. Mol Microbiol 34:675–689. doi: 10.1046/j.1365-2958.1999.01627.x. [DOI] [PubMed] [Google Scholar]
- 14.Page AL, Ohayon H, Sansonetti PJ, Parsot C. 1999. The secreted IpaB and IpaC invasins and their cytoplasmic chaperone IpgC are required for intercellular dissemination of Shigella flexneri. Cell Microbiol 1:183–193. doi: 10.1046/j.1462-5822.1999.00019.x. [DOI] [PubMed] [Google Scholar]
- 15.Sansonetti PJ, Mounier J, Prévost MC, Mège RM. 1994. Cadherin expression is required for the spread of Shigella flexneri between epithelial cells. Cell 76:829–839. doi: 10.1016/0092-8674(94)90358-1. [DOI] [PubMed] [Google Scholar]
- 16.Vasselon T, Mounier J, Hellio R, Sansonetti PJ. 1992. Movement along actin filaments of the perijunctional area and de novo polymerization of cellular actin are required for Shigella flexneri colonization of epithelial Caco-2 cell monolayers. Infect Immun 60:1031–1040. [DOI] [PMC free article] [PubMed] [Google Scholar]
- 17.Dragoi AM, Agaisse H. 2014. The serine/threonine kinase STK11 promotes Shigella flexneri dissemination through establishment of cell-cell contacts competent for tyrosine kinase signaling. Infect Immun 82:4447–4457. doi: 10.1128/IAI.02078-14. [DOI] [PMC free article] [PubMed] [Google Scholar]
- 18.Demers B, Sansonetti PJ, Parsot C. 1998. Induction of type III secretion in Shigella flexneri is associated with differential control of transcription of genes encoding secreted proteins. EMBO J 17:2894–2903. doi: 10.1093/emboj/17.10.2894. [DOI] [PMC free article] [PubMed] [Google Scholar]
- 19.Campbell-Valois FX, Schnupf P, Giulia N, Sachse M, Sansonetti PJ, Parsot C. 2014. A fluorescent reporter reveals on/off regulation of the type three secretion apparatus secretion activity during entry and cell-to-cell spreading of S. flexneri. Cell Host Microbe 15:177–189. doi: 10.1016/j.chom.2014.01.005. [DOI] [PubMed] [Google Scholar]
- 20.Ogawa M, Yoshimori T, Suzuki T, Sagara H, Mizushima N, Sasakawa C. 2005. Escape of intracellular Shigella from autophagy. Science 307:727–731. doi: 10.1126/science.1106036. [DOI] [PubMed] [Google Scholar]
- 21.Dong N, Zhu Y, Lu Q, Hu L, Zheng Y, Shao F. 2012. Structurally distinct bacterial TBC-like GAPs link Arf GTPase to Rab1 inactivation to counteract host defenses. Cell 150:1029–1041. doi: 10.1016/j.cell.2012.06.050. [DOI] [PubMed] [Google Scholar]
- 22.Rathman M, Jouirhi N, Allaoui A, Sansonetti P, Parsot C, Tran Van Nhieu G. 2000. The development of a FACS-based strategy for the isolation of Shigella flexneri mutants that are deficient in intercellular spread. Mol Microbiol 35:974–990. doi: 10.1046/j.1365-2958.2000.01770.x. [DOI] [PubMed] [Google Scholar]
- 23.Kayath CA, Hussey S, El hajjami N, Nagra K, Philpott D, Allaoui A. 2010. Escape of intracellular Shigella from autophagy requires binding to cholesterol through the type III effector, IcsB. Microbes Infect 12:956–966. doi: 10.1016/j.micinf.2010.06.006. [DOI] [PubMed] [Google Scholar]
- 24.Plutner H, Cox AD, Pind S, Khosravi-Far R, Bourne JR, Schwaninger R, Der CJ, Balch WE. 1991. Rab1b regulates vesicular transport between the endoplasmic reticulum and successive Golgi compartments. J Cell Biol 115:31–43. doi: 10.1083/jcb.115.1.31. [DOI] [PMC free article] [PubMed] [Google Scholar]
- 25.Campbell-Valois F-X, Trost M, Chemali M, Dill BD, Laplante A, Duclos S, Sadeghi S, Rondeau C, Morrow IC, Bell C, Gagnon E, Hatsuzawa K, Thibault P, Desjardins M. 2012. Quantitative proteomics reveals that only a subset of the endoplasmic reticulum contributes to the phagosome. Mol Cell Proteomics 11:M111.016378. doi: 10.1074/mcp.M111.016378. [DOI] [PMC free article] [PubMed] [Google Scholar]
- 26.Zoppino FC, Militello RD, Slavin I, Alvarez C, Colombo MI. 2010. Autophagosome formation depends on the small GTPase Rab1 and functional ER exit sites. Traffic 11:1246–1261. doi: 10.1111/j.1600-0854.2010.01086.x. [DOI] [PubMed] [Google Scholar]
- 27.Baxt LA, Goldberg MB. 2014. Host and bacterial proteins that repress recruitment of LC3 to Shigella early during infection. PLoS One 9:e94653. doi: 10.1371/journal.pone.0094653. [DOI] [PMC free article] [PubMed] [Google Scholar]
- 28.Huynh KK, Eskelinen EL, Scott CC, Malevanets A, Saftig P, Grinstein S. 2007. LAMP proteins are required for fusion of lysosomes with phagosomes. EMBO J 26:313–324. doi: 10.1038/sj.emboj.7601511. [DOI] [PMC free article] [PubMed] [Google Scholar]
- 29.Pei J, Grishin NV. 2009. The Rho GTPase inactivation domain in Vibrio cholerae MARTX toxin has a circularly permuted papain-like thiol protease fold. Proteins 77:413–419. doi: 10.1002/prot.22447. [DOI] [PMC free article] [PubMed] [Google Scholar]
- 30.Thurston TL, Ryzhakov G, Bloor S, von Muhlinen N, Randow F. 2009. The TBK1 adaptor and autophagy receptor NDP52 restricts the proliferation of ubiquitin-coated bacteria. Nat Immunol 10:1215–1221. doi: 10.1038/ni.1800. [DOI] [PubMed] [Google Scholar]
- 31.Thurston TL, Wandel MP, von Muhlinen N, Foeglein A, Randow F. 2012. Galectin 8 targets damaged vesicles for autophagy to defend cells against bacterial invasion. Nature 482:414–418. doi: 10.1038/nature10744. [DOI] [PMC free article] [PubMed] [Google Scholar]
- 32.Mostowy S, Sancho-Shimizu V, Hamon MA, Simeone R, Brosch R, Johansen T, Cossart P. 2011. p62 and NDP52 target intracytosolic Shigella and Listeria to different autophagy pathways. J Biol Chem 286:26987–26995. doi: 10.1074/jbc.M111.223610. [DOI] [PMC free article] [PubMed] [Google Scholar]
- 33.Wild P, Farhan H, McEwan DG, Wagner S, Rogov VV, Brady NR, Richter B, Korac J, Waidmann O, Choudhary C, Dötsch V, Bumann D, Dikic I. 2011. Phosphorylation of the autophagy receptor optineurin restricts salmonella growth. Science 333:228–233. doi: 10.1126/science.1205405. [DOI] [PMC free article] [PubMed] [Google Scholar]
- 34.Tattoli I, Sorbara MT, Vuckovic D, Ling A, Soares F, Carneiro LA, Yang C, Emili A, Philpott DJ, Girardin SE. 2012. Amino acid starvation induced by invasive bacterial pathogens triggers an innate host defense program. Cell Host Microbe 11:563–575. doi: 10.1016/j.chom.2012.04.012. [DOI] [PubMed] [Google Scholar]
- 35.Mostowy S, Bonazzi M, Hamon MA, Tham TN, Mallet A, Lelek M, Gouin E, Demangel C, Brosch R, Zimmer C, Sartori A, Kinoshita M, Lecuit M, Cossart P. 2010. Entrapment of intracytosolic bacteria by septin cage-like structures. Cell Host Microbe 8:433–444. doi: 10.1016/j.chom.2010.10.009. [DOI] [PubMed] [Google Scholar]
- 36.Ligeon LA, Moreau K, Barois N, Bongiovanni A, Lacorre DA, Werkmeister E, Proux-Gillardeaux V, Galli T, Lafont F. 2014. Role of VAMP3 and VAMP7 in the commitment of Yersinia pseudotuberculosis to LC3-associated pathways involving single- or double-membrane vacuoles. Autophagy 10:1588–1602. doi: 10.4161/auto.29411. [DOI] [PMC free article] [PubMed] [Google Scholar]
- 37.Sanjuan MA, Dillon CP, Tait SW, Moshiach S, Dorsey F, Connell S, Komatsu M, Tanaka K, Cleveland JL, Withoff S, Green DR. 2007. Toll-like receptor signalling in macrophages links the autophagy pathway to phagocytosis. Nature 450:1253–1257. doi: 10.1038/nature06421. [DOI] [PubMed] [Google Scholar]
- 38.Martinez J, Almendinger J, Oberst A, Ness R, Dillon CP, Fitzgerald P, Hengartner MO, Green DR. 2011. Microtubule-associated protein 1 light chain 3 alpha (LC3)-associated phagocytosis is required for the efficient clearance of dead cells. Proc Natl Acad Sci U S A 108:17396–17401. doi: 10.1073/pnas.1113421108. [DOI] [PMC free article] [PubMed] [Google Scholar] [Retracted]
- 39.Huang J, Huang J, Canadien V, Lam GY, Steinberg BE, Dinauer MC, Magalhaes MA, Glogauer M, Grinstein S, Brumell JH. 2009. Activation of antibacterial autophagy by NADPH oxidases. Proc Natl Acad Sci U S A 106:6226–6231. doi: 10.1073/pnas.0811045106. [DOI] [PMC free article] [PubMed] [Google Scholar]
- 40.Allaoui A, Sansonetti PJ, Parsot C. 1992. MxiJ, a lipoprotein involved in secretion of Shigella Ipa invasins, is homologous to YscJ, a secretion factor of the Yersinia Yop proteins. J Bacteriol 174:7661–7669. [DOI] [PMC free article] [PubMed] [Google Scholar]
- 41.Datsenko KA, Wanner BL. 2000. One-step inactivation of chromosomal genes in Escherichia coli K-12 using PCR products. Proc Natl Acad Sci U S A 97:6640–6645. doi: 10.1073/pnas.120163297. [DOI] [PMC free article] [PubMed] [Google Scholar]
- 42.Campbell-Valois FX, Schnupf P, Sansonetti PJ. 2014. Design of a transcription-based secretion activity reporter (TSAR) of the Type III secretion apparatus of Shigella flexneri and uses thereof. Bio Protoc 4:e1270 http://www.bio-protocol.org/e1270. [Google Scholar]
- 43.Mavris M, Sansonetti PJ, Parsot C. 2002. Identification of the cis-acting site involved in activation of promoters regulated by activity of the type III secretion apparatus in Shigella flexneri. J Bacteriol 184:6751–6759. doi: 10.1128/JB.184.24.6751-6759.2002. [DOI] [PMC free article] [PubMed] [Google Scholar]
- 44.Bongrand C, Sansonetti PJ, Parsot C. 2012. Characterization of the promoter, MxiE box and 5′ UTR of genes controlled by the activity of the type III secretion apparatus in Shigella flexneri. PLoS One 7:e32862. doi: 10.1371/journal.pone.0032862. [DOI] [PMC free article] [PubMed] [Google Scholar]
- 45.Barzu S, Nato F, Rouyre S, Mazie JC, Sansonetti P, Phalipon A. 1993. Characterization of B-cell epitopes on IpaB, an invasion-associated antigen of Shigella flexneri: identification of an immunodominant domain recognized during natural infection. Infect Immun 61:3825–3831. [DOI] [PMC free article] [PubMed] [Google Scholar]
- 46.Oaks EV, Wingfield ME, Formal SB. 1985. Plaque formation by virulent Shigella flexneri. Infect Immun 48:124–129. [DOI] [PMC free article] [PubMed] [Google Scholar]
Associated Data
This section collects any data citations, data availability statements, or supplementary materials included in this article.
Supplementary Materials
Supplemental Materials and Methods. Download
LC3 recruitment and T3SA activation are both induced in an IcsA-dependent manner during cell-to-cell spread and in an IcsA-independent manner during entry. (A) Confocal microscopy analysis of LC3 and IpaB labeling and icsA, icsA icsB, or icsA virA bacteria harboring the pTSAR1Ud2.1 plasmid (encoding GFPsfm2 under the control of the T3SA-regulated promoter p-ipaH78 [TSAR] and Cerulean under the control of the constitutive promoter p-rpsM [rpsM]) in T7 cells at 240 min postchallenge (PC) and counterstained with DAPI. (B) Confocal microscopy analyses of LC3 and IpaB labeling and WT, icsB, virA, icsA, icsA icsB, or icsA virA bacteria harboring the pTSAR1Ud2.1 plasmid at 60 min PC and counterstained with DAPI. Labeling colors in the overlays are as described for panel A. Download
LC3 is recruited around secreting bacteria in vivo. Confocal microscopy analysis of LC3 and IpaB labeling and WT S. flexneri expressing constitutively GFPmut3 from the pFPV25.1 plasmid in colon sections of guinea pigs at 240 min PC. In the lower panels, magnified views of the boxed region in each section are shown. The central panel shows the orthogonal view of the Z-stack reconstruction of the dashed box region in the leftmost section. The right panels show a magnified view of the region in the rightmost section. The bottom right panels display the Pearson’s coefficient for IpaB and GFP versus LC3 labeling. Download
Autophagy pathways components Beclin-1 and ATG12 acting upstream from LC3 are not more frequently recruited to icsB and virA mutants than to the WT strain. (A) Confocal microscopy analysis of Beclin-1 (Bcn1) and IpaB labeling and WT, icsB, and virA bacteria harboring the pTSAR1Ud2.1 plasmid in TC7 cells at 240 min PC and counterstained with DAPI. (B) Confocal microscopy analyses of ATG12 and IpaB labeling in infected TC7 cells obtained as described for panel B. (C) Graph indicating the frequency of Bcn1- or ATG12-positive bacteria (a minimum of 267 bacteria were counted per replicate of the experiment; n = 3). One-way ANOVA and Bonferroni’s posttests for pairwise comparison were performed for both types of labeling. Variations between strains for both labeling were all found to be not significant (ns; P > 0.05). Download
Properties of the bacterial clusters formed by the WT, icsB, virA, and icsB virA strains. (A) Confocal microscopy analyses of LC3 labeling and WT and icsB virA bacteria harboring the pTSAR1Ud2.1 plasmid in TC7 cells at 240 min postchallenge (PC). The images are maximal-intensity projections of 11 and 13 z-stacks, respectively, at intervals of 0.4 µm obtained with a 40× objective. Signals of p-rpsM-Cerulean and TSAR were both pseudocolored white to locate all bacteria. Samples were counterstained with DAPI to reveal the host cell nuclei. (B) Prototypical confocal microscopy images of LC3 and LAMP2 labeling and WT, icsB, virA, and icsB virA bacteria harboring the pTSAR1Ud2.1 plasmid in TC7 cells at 240 min PC used for the analysis of the number of bacteria per cluster. The graph in the upper right panel indicates the frequency of bacteria that are both LAMP2 -positive and LC3 -negative. A one-way ANOVA and Bonferroni’s posttests for pairwise comparison were performed. (C) Relative numbers of plaque-forming units formed by the WT, icsB, virA, and icsB virA strains compared to the icsA strain that is completely deficient in cell-to-cell spread (n = 3). A one-way ANOVA and Bonferroni’s posttests for pairwise comparison were performed. Variations between strains were not significant (P > 0.05). Download
Data confirming expression of IcsB-Myc and VirA-Myc and related to the transcomplementation of icsB, virA, and icsB virA mutants by the WT strain. (A) Immunoblot on total bacterial lysates of an icsB mutant harboring a plasmid encoding WT IcsB-Myc and a virA mutant harboring a plasmid encoding VirA (WT or Rab GAP-dead)-Myc. (B) Confocal microscopy analysis of IcsB-Myc, LC3, and IpaB labeling in TC7 cells infected by the icsB mutant harboring a plasmid encoding WT IcsB-Myc at 240 min PC. (C) Confocal microscopy analyses of LAMP2 labeling in TC7 cells coinfected with WT bacteria harboring pTSAR1Ud2.4s (p-rpsM-mCherry) and icsB, virA, or icsB virA bacteria harboring pTSAR1Ud2.1 (p-rpsM-Cerulean) at 240 min PC. The graph in the upper right panel shows the average number of bacteria per LAMP2 cluster for the icsB virA bacteria (n = 3; data reproduced from Fig. 2C) and for the icsB virA bacteria coinfecting with WT bacteria (n = 2; >15 clusters were counted in each replicate) TC7 cells at 240 min PC. A Student’s (unpaired) t test with equal variance was performed. Variations between conditions were not significant (P > 0.05). Download
The LC3-positive S. flexneri-containing vacuole is composed of a single membrane. Light-fluorescence microscope images of TC7 cells transfected with a plasmid encoding mCherry-LC3 and infected for 60 min with bacteria harboring pTSAR1Ud2.1 are shown. TSAR-positive bacteria such as those in the boxed area were selected for observation by electron microscopy (EM). Cells and bacteria in the region of interest were recovered from the corresponding grid and observed by EM. The “1” and the letters indicate the cell of interest and neighboring cells, respectively, in the light-fluorescence images and the corresponding EM images. Arrows and arrowheads indicate the bacterial outer membrane (BOM) and the vacuolar membrane (sVM), respectively. (A and B) WT bacteria. (C) icsB virA bacteria. Download
icsB virA bacteria replicate and remain inside mCherry-LC3A-positive vacuoles. The movie consists of time lapse videomicroscopy of icsB virA bacteria harboring the pTSAR1Ud2.1 plasmid and trapped in an mCherry-LC3A-positive membrane compartment in TC7 cells between 120 and 300 min PC; trapped bacteria replicated within this mCherry-LC3A-positive membrane compartment. Images were obtained with a light microscope equipped with light-emitting diodes (LEDs) as the light source at a rate of 1 per min. The movie shown here corresponds to 96 min of observation at the rate of 15 images/s. Download
icsB virA bacteria replicate and occasionally escape mCherry-LC3A-positive vacuoles. The movie consists of time lapse videomicroscopy of icsB virA bacteria harboring the pTSAR1Ud2.1 plasmid and trapped in an mCherry-LC3A-positive membrane compartment in TC7 cells between 120 and 300 min PC; bacteria replicated within this compartment and occasionally escaped from the mCherry-LC3A-positive membrane compartment as indicated by arrows. Images were obtained with a light microscope equipped with light-emitting diodes (LEDs) as the light source at a rate of 1 per min. The movie shown here corresponds to 180 min of observation at the rate of 7.5 images/s. Download
Bacteria found in an LC3-positive compartment are secreting. The movie consists of time lapse videomicroscopy of WT bacteria harboring the pTSAR1Ud2.1 plasmid and performing cell-to-cell spread in MK2 cells transfected with mCherry-LC3A. Images were obtained with a light microscope equipped with light-emitting diodes (LEDs) as the light source at a rate of 1 per min. The movie shown here corresponds to 70 min of observation at the rate of 5 images/s. This movie was used to extract the data shown in Fig. 3A. Download