

Abstract
Protein modification by glycosylation occurs through an essential biochemical pathway that produces mannosyl side chain substrates, which are covalently attached to proteins in the endoplasmic reticulum. We used DNA microarray analysis to characterize the cellular response to a conditional defect (pmi40-101) in the protein glycosylation pathway. Expression profiles were obtained from DNA microarrays containing essentially every gene from Saccharomyces cerevisiae. We validated the microarray analysis by examining the expression patterns of induced genes using transcriptional lacZ fusions. The major class of genes differentially expressed in the glycosylation mutant overlapped significantly with that of a starvation response and included those required for gluconeogenesis, the tricarboxylic acid and glyoxylate cycles, and protein and amino acid biosynthesis. Two mitogen-activated protein (MAP) kinase pathways were also activated in the mutant, the filamentous growth and protein kinase C pathways. Taken together, our results suggest that a checkpoint is activated in response to a protein glycosylation defect, allowing the cell to mount an adaptive response by the activation of multiple MAP kinase pathways.
Keywords: MAP kinase, signaling, filamentous growth, cell wall
Introduction
Glycosylation of proteins by mannose moiety side chain addition is a posttranslational modification that occurs in the endoplasmic reticulum and Golgi. The pathway responsible for producing these side chains and transferring them to target proteins is conserved throughout eukaryotes. Protein glycosylation is important for protein function (Spiro, 2002), protein folding (Ng et al., 2000), regulated secretion (Scheiffele and Fullekrug, 2000), and protein localization (Ohnishi et al., 2003; Watanabe et al., 2004). In addition, carbohydrate moieties of glycoproteins are structurally diverse, imparting specific biological information and regulation onto their cognate proteins.
A change in the rate of protein glycosylation causes several characterized responses, the best studied of which is the unfolded protein response (UPR; Chapman et al., 1998). In addition, defects in protein glycosylation influence secretion (Travers et al., 2000), cell integrity (Lee and Elion, 1999; Cullen et al., 2000), and the activation of cellular signaling pathways (Cullen et al., 2000). How a cell responds to a change in the glycosylation rate is not fully understood, but presumably the response results from communication between internal cellular signaling networks. Several genomic studies have been employed to characterize the response of cells to abrogation of one aspect of protein glycosylation, N-linked glycosylation, using the inhibitor tunicamycin (Travers et al., 2000; Lecca et al., 2004) or analyzing mutants partially defective for N-linked glycosylation (Klebl et al., 2001).
We previously isolated partial loss-of-function mutants defective in protein glycosylation in a genetic screen for altered expression of a mitogen-activated protein (MAP) kinase pathway-dependent reporter (Cullen et al., 2000). We also demonstrated that in such mutants activation of the MAP kinase pathway is required for viability, indicating that a defect in glycosylation leads to a compensatory cellular response (Cullen et al., 2000). One of the mutants we identified was defective in the PMI40 gene, which is required for the first committed step of protein glycosylation, the conversion of fructose 6-phosphate to mannose 6-phosphate (Smith et al., 1992). In the present study, we confirm and extend these studies by examining the glycosylation defect using a partial loss-of-function allele of PMI40, called pmi40-101 (Cullen et al., 2000). Expression profiling generated from this study demonstrates that genes encoding structural proteins of two MAP kinase pathways are induced in response to a glycosylation defect. Our data also show that cells defective for glycosylation exhibit a starvation-like response and show growth inhibition. Taken together, our results provide evidence for a checkpoint that is sensitive to the changes in the flux of protein glycosylation in the cell.
Materials and methods
Strains, plasmids, and microbiological techniques
The yeast strains used in this study are listed in Table 1. Integrated green fluorescent protein (GFP) fusions were made by PCR-based methods using plasmids provided by J. Pringle (University of North Carolina; Longtine et al., 1998). Gene disruptions and integrated promoter and protein fusions were confirmed by PCR analysis and by phenotype. GFP-tagged fusion proteins used in this study were functional as assessed by FUS1 reporter expression, invasive growth phenotypes, and viability of the pmi40-101 mutant. Yeast and bacterial strains were propagated using standard methods (Rose et al., 1990). Yeast peptone dextrose (YPD) and synthetic complete dextrose (SCD) media have been described (Rose et al., 1990). Yeast transformations were performed as described (Gietz et al., 1995). Bacterial transformations, bacterial DNA preparations and plasmid constructions were performed by standard methods (Sambrook et al., 1989). Strains harboring the pmi40-101 allele were maintained on medium containing 50 mM mannose unless otherwise stated.
Table 1.
Yeast strains used in this study
| Strain | Genotype | Reference |
|---|---|---|
| 1436 | Wild type | Cullen et al. (2000) |
| 1436–13 | ste4 pmi40-101 | Cullen et al. (2000) |
| 1004 | ste4 pmi40-101 ssk1 HOG1–GFP::KanMX6 | This study |
| 1006 | Σ1278b ssk1 HOG1–GFP::KanMX6 | This study |
Inductions and RNA isolation
Strain pmi40-101 (1436-13) was grown to stationary phase in YPD medium plus 50 mM mannose. Cells were harvested by centrifugation, washed twice in YPD, and resuspended in YPD (OD 0.5) or YPD plus 50 mM mannose (OD 0.2) medium prewarmed to 30 °C. Cells were incubated at 30 °C until the culture reached OD 0.8 (c. 4 h), at which point cells were harvested by centrifugation and stored at −80 °C. RNA was extracted from cells using hot acid phenol extraction followed by passage over an RNeasy Maxi column (Qiagen, Valencia, CA). Exogenous mannose is not thought to influence the growth rate of wild-type cells (Pitkanen et al., 2004).
Expression analysis
Expression profiles were obtained from microarray analysis performed at the Fred Hutchinson Cancer Research Center. Microarray construction, target labeling and hybridization protocols were performed as described (Fazzio et al., 2001). Microarrays were constructed by employing a set of c. 6200 ORF-specific PCR primer pairs (Research Genetics, Huntsville, AL). Individual PCR products were verified as unique via gel electrophoresis, purified, and mechanically ‘spotted’ onto polylysine-coated microscope slides using an Omni-Grid high-precision robotic gridder (GeneMachines, San Carlo, CA). cDNA targets were generated using a standard amino-allyl labeling protocol, where 30 μg each of ‘experimental’ and ‘reference’ total RNA was coupled to either Cy3 or Cy5 fluorophores. Targets were cohybridized to micro-arrays for 16 h at 63 °C and sequentially washed at room temperature in 1 × SSC and 0.03% sodium dodecyl sulfate (SDS) for 2 min, 1 × SSC for 2 min, 0.2 × SSC with agitation for 20 min, and 0.05 × SSC with agitation for 10 min. Arrays were immediately centrifuged until dry and scanned using a GenePix 4000 scanner (Axon Instruments, Union City, CA). Image analysis was performed using GenePix Pro 3.0.
Statistical analysis of the microarray data
For each array, background-subtracted spot intensities (red channel and green channel) were filtered and removed from further analysis if the spot intensity did not exceed 3 SD above the background signal in at least one channel. Red/green ratios were natural log transformed, and a logical regression normalization strategy (f = 0.67) was applied using S-Plus (MathSoft, Cambridge, MA) to correct for intra-array intensity-dependent ratio bias. Sample comparisons were independently replicated six times, each from a separate cell culture. Pairwise comparisons were made using CyberT (Baldi and Long, 2001) using a default window size of 101 and a confidence value of 6. Significance was determined by ranking the Bayesian P-values and using a false discovery rate methodology (FDR = 0.05) to account for multiple testing. A series of three ‘same vs. same’ hybridizations was performed using independent cultures, and the spot-level averaged normalized ratios were subtracted from the averaged normalized ratio of the six experimental replicates to correct for residual dye effects. A fold-change threshold of ≥1.5 was applied as an additional significance criterion, based in part on the expression pattern of known targets. This threshold was derived from ratios taken from the ‘same vs. same’ observations, where the threshold was set at four times the average SD value. Accordingly, any ORFs with a P-value that met the FDR = 0.05 criterion and where the normalized ratio was ≥1.5 were identified as differentially expressed. Heat maps were generated using the Eisen Cluster/Tree View Packge (Eisen et al., 1998).
Validation of microarray data by transcriptional fusions
Transcriptional (lacZ) fusions were constructed to a subset of genes that showed differential expression by DNA micro-array analysis. Plasmid V84 and plasmids containing filamentous growth pathway targets fused to lacZ for KSS1 (p2987), PGU1 (p2985), SVS1 (p3017) and YLR042c (p2988) were provided by C. Boone (University of Toronto; Roberts et al., 2000). Other gene fusions have also been described (Cullen et al., 2000, 2004). Reporter plasmids were transformed into the pmi40-101 strain, and beta;-galactosidase assays were performed in induced [yeast extract-peptone-dextrose (YEPD) medium] and uninduced (YEPD+50 mM mannose) conditions. Cells harboring the MSB2–lacZ reporter were assessed over multiple time points (2 h, 4 h, 8 h, and 16 h). Assays were performed from cell extracts derived from three separate trials, and the average of the values were expressed in Miller Units as previously described (Cullen et al., 2000). The resultant microarray data have been made available on the SGD Website (http://www.yeastgenome.org/).
Protein localization
Hog1-GFP localization was performed using a C-terminal Hog1–GFP fusion integrated at the HOG1 locus into a pmi40-101 ssk1 strain (1004) or an ssk1 strain in the filamentous background (1006). Cells were visualized by microscopy at ×100 using a fluorescein isothiocyanate (FITC) filter. Nuclei were visualized by 4,6-diamidino-2-phenylindole (DAPI) staining as previously described (Rose et al., 1990).
Microscopy
Differential-interference-contrast (DIC) and fluorescence microscopy using UV and FITC filter sets were performed using an Axioplan 2 microscope (Zeiss, Jena, Germany), a black and white Orca II digital camera (Hamamatsu, San Jose, CA), and the Openlab software program (Improvision, Coventry, UK).
Results and discussion
We turned to DNA microarray analysis (DeRisi et al., 1997) to better understand the cellular response to a protein glycosylation defect and to define the signaling pathways activated under this condition. We focused on the pmi40-101 mutant (Cullen et al., 2000), which exhibits a conditional glycosylation defect: when grown in the presence of mannose, no glycosylation defect is apparent; when grown in the absence of mannose, a glycosylation defect is evident (Smith et al., 1992; Cullen et al., 2000). Spotted cDNA microarrays (DeRisi et al., 1997; Lashkari et al., 1997) representing >96% of all yeast ORFs were used to monitor the changes in expression in the inducible glycosylation defect in the pmi40-101 mutant.
Expression analysis of a glycosylation mutant
cDNA sequences were prepared from the pmi40-101 mutant incubated in medium containing mannose, and compared to those obtained from incubation in medium lacking mannose at a 4 h time point, at which time significant MAP kinase activation occurs (data not shown). Six independent comparisons were performed, and most genes that had differential expression showed a highly correlative pattern between replicates. To validate the expression data, a statistical analysis was used in which variable signals were flagged and removed from the dataset. Significance was determined by a Bayesian method derived for microarray analysis (CyberT; Baldi and Long, 2001) and using an FDR methodology to account for multiple testing. Control hybridizations were performed and subtracted from the averaged normalized ratio of the experimental replicates to account for bye biases. We established a fold-change threshold of ≥1.5 as an additional significance criterion, based in part on the expression pattern of known induced targets. Only ORFs with a P-value that met the significance criterion and where the normalized ratio was ≥1.5 were identified as differentially expressed. The results of this analysis indicate differential induction of c. 740 ORFs, and repression of c. 440 ORFs was observed in the pmi40-101 mutant.
To validate the DNA microarray data, we analyzed a series of transcriptional fusions to a subset of the promoters that showed differential expression. beta;-Galactosidase assays were performed using promoter fusions carried in the pmi40-101 strain. All promoter fusions tested (SVS1, MSB2, FUS1, YLR042c, KSS1, FgTy1, FRE, and PGU1) showed a >2-fold induction of gene expression in mannose-limiting media (Fig. 1), indicating a strong correlation with the expression profile data. Databases containing annotated yeast genes (SGD, http://www.yeastgenome.org/) were used to classify the differentially expressed genes in the pmi40-101 mutant. Differentially induced gene sets fell into distinct functional classes, which were analyzed and compared with other genome-wide expression profiles. These results are summarized below.
Fig. 1.
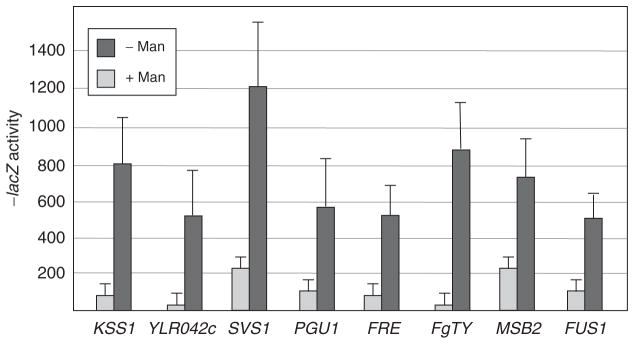
Verification of a subset of microarray targets using transcriptional reporter gene fusions. The pmi40-101 mutant (strain 1436-13) containing lacZ fusions to the denoted genes was incubated for 4 h in medium containing (light rectangles) or lacking (dark rectangles) 50 mM mannose. beta;-Galactosidase assays were performed as described. The average of two independent experiments is shown.
Unfolded protein response
Altered glycosylation of proteins in the endoplasmic reticulum triggers the UPR, resulting in the induction of an intracellular signaling pathway that functions to promote protein folding and degrade misfolded proteins (Chapman et al., 1998). Expression profiles using drug treatments that block N-linked glycosylation (Travers et al., 2000) or in mutants partially defective for N-linked glycosylation (Klebl et al., 2001) have identified a number of genes whose products contribute to the UPR. The expression profile of the pmi40-101 mutant showed that most of the genes that play a role in the UPR were induced. These genes include HAC1, which encodes the transcription factor (Mori et al., 2000), and a number of its targets, INO1, ERO1, KAR2, PDI1, OPI3, YET1, and DER1 (Table 2). In addition, genes encoding proteins that promote protein folding were differentially induced, including LHS1, MPD1, EUG1, and FKB2 (Fig. S1). Thus, as expected in a mutant defective for protein glycosylation, transcriptional targets of the UPR were induced.
Table 2.
Microarray analysis of UPR, nutrition, cell cycle, and glycosylation-related genes differentially expressed in the pmi40-101 mutant
| Gene name | Fold change | P-value | Process/function |
|---|---|---|---|
| UPR | |||
| INO1 | 10.7 | <0.001 | Inositol biosynthesis; inositol-1-phosphate synthase |
| ERO1 | 4.5 | <0.001 | Protein folding; disulfide bond formation in the endoplasmic reticulum |
| KAR2 | 3.0 | <0.001 | Secretion; BiP homolog; endoplasmic reticulum protein translocation |
| HAC1 | 3.0 | 0.038 | Transcription factor for UPR |
| PDI1 | 2.8 | <0.001 | Protein folding; protein disulfide isomerase |
| OPI3 | 2.2 | <0.001 | Phospholipid metabolism; phospholipid synthase |
| YET1 | 2.2 | <0.001 | Enoplasmic reticulum 25 kDa transmembrane protein |
| DER1 | 2.1 | <0.001 | Protein degradation, endoplasmic reticulum |
| Gluconeogenesis | |||
| PCK1 | 5.9 | <0.001 | Phosphoenolpyruvate carboxykinase; Cat8 target |
| MDH2 | 3.1 | <0.001 | Malate dehydrogenase; Cat8 target |
| LSC2 | 2.5 | <0.001 | Succinyl-CoA ligase |
| GLK1 | 2.3 | 0.001 | Glycolysis; glucokinase |
| CIT2 | 2.3 | <0.001 | Glyoxylate cycle; peroxisomal citrate synthase |
| NTH1 | 2.2 | <0.001 | Trehalose metabolism; α-trehalase |
| SFC1 | 2.1 | <0.001 | Transport; succinate–fumarate carrier; Cat8 target |
| IDP2 | 2.1 | <0.001 | Isocitrate dehydrogenase; Cat8 target |
| Hexose permease | |||
| HXT2 | 3.6 | <0.001 | High-affinity glucose transporter |
| HXT13 | 2.3 | 0.006 | Hexose transporter |
| HXT16 | 2.1 | <0.001 | Hexose transporter |
| Glycerol metabolism | |||
| GUT2 | 3.4 | <0.001 | Glycerol-3-phosphate dehydrogenase, mitochondrial |
| RHR2 | 2.2 | <0.001 | DL-glycerol-3-phosphatase |
| HOR2 | 2.2 | <0.001 | DL-glycerol-3-phosphatase |
| ATP synthesis | |||
| STF1 | 3.4 | <0.001 | ATPase stabilizing factor |
| STF2 | 2.9 | 0.001 | ATPase stabilizing factor |
| ATP3 | 2.0 | <0.001 | Mitochondrial F1F0 ATP synthase subunit |
| Amino acid biosynthesis | |||
| ARG3 | −2.0 | <0.001 | Arginine biosynthesis; ornithine carbamoyltransferase |
| CPA2 | −2.0 | <0.001 | Glutamate metabolism; carbamyl phosphate synthetase |
| HOM2 | −2.1 | <0.001 | Threonine and methionine biosynthesis |
| SAM3 | −2.1 | <0.001 | Transport, amino acid; S-adenosylmethionine permease |
| BAT2 | −2.4 | <0.001 | Branched-chain amino acid biosynthesis; transaminase |
| ARG1 | −3.0 | <0.001 | Arginine biosynthesis; arginosuccinate synthetase |
| Cell cycle | |||
| PCL1 | 3.3 | <0.001 | G1/S cyclin |
| CLN1 | 1.5 | 0.002 | G1/S cyclin |
| CLN2 | 1.9 | <0.001 | G1/S cyclin |
| CLN3 | 1.5 | 0.001 | G1/S cyclin |
| SIM1 | 2.4 | <0.001 | Cytoskeleton organization, control of DNA replication |
| HSL1 | 2.3 | <0.001 | G2/M; negative regulator of Swe1 kinase |
| PCL7 | 2.0 | <0.001 | Glycogen biosynthesis; CDK regulator |
| CLB2 | −2.1 | <0.001 | G2/M cyclin |
| CLB1 | −3.5 | <0.001 | G2/M cyclin |
| Glycosylation | |||
| AMS1 | 5.2 | <0.001 | Cell wall catabolism; vacuolar α-mannosidase |
| KTR2 | 4.3 | <0.001 | Protein glycosylation; putative mannosyltransferase |
Results are presented as fold changes in mRNA levels (≥2 and ≤−2). Gene descriptions are from the Saccharomyces Genome database (http://www.yeastgenome.org)
Environmental stress response (ESR)
The ESR in yeast is a general stress response resulting in the coordinated activation of independent stress-responsive pathways (Gasch et al., 2000). We considered the possibility that a defect in glycosylation induces this general stress response. Comparison of genes induced >2-fold in the pmi40-101 mutant with those induced >2-fold in the ESR showed only a 14% overlap for characterized ORFs (Fig. S2). Most of the overlapping genes encode proteins that play a role in the heat shock response (HSP42, SSE2, and HSP104), protein degradation (PRB1 and PMC1), and nutrition (GLK1, YDR516c, PDE1, GLC3, and NTH1). Therefore, although some ESR genes are induced in the pmi40-101 mutant, the transcriptional response was largely distinct from the ESR.
Nutritional pathways
A large subset of the differentially expressed genes in the pmi40-101 mutant are differentially expressed during the diauxic shift, which represents entry into stationary phase (DeRisi et al., 1997). In particular, the expression of genes required for gluconeogenesis was induced in the pmi40-101 mutant, including Cat8, which encodes a transcription factor for gluconeogenesis (Fig. S3) and the Cat8 targets PCK1, MDH2, IDP2, JEN1, and SFC1 (Table 2). Genes that are required for hexose transport, trehalose, glycogen and glycerol metabolism, the glyoxylate cycle, ATP synthesis and poor carbon source utilization also showed differential induction (Table 2 and Fig. S3). Likewise, some genes known to be controlled by glucose repression (e.g. INO1, PHO89, AMS1, PCK1, MDH2, IDP2, ACS1, HXT2, HXT16, and ADR1) were induced in the pmi40-101 mutant (Fig. S3).
The gene expression profile in the pmi40-101 mutant differs from that of the diauxic shift in several ways. Most genes encoding citric acid cycle enzymes are not affected in the pmi40-101 mutant (13/14), although they are reported to be induced during the diauxic shift (DeRisi et al., 1997). Similarly, the genes required for respiration are not induced in the pmi40-101 mutant but are induced during the diauxic shift (DeRisi et al., 1997). Indeed, genes encoding mitochondrial ribosomal proteins, mitochondrial protein import machinery and proteins known to be associated with respiration were modestly repressed in the pmi40-101 mutant (data not shown). On the other hand, genes that encode components of the protein glycosylation pathway itself and genes required for recycling mannosyl moieties (Table 2) were induced in the pmi40-101 mutant but not in the diauxic shift.
Upon nutrient limitation, coordinate repression of ribo-some biosynthetic genes occurs (Warner, 1999; Raught et al., 2001). We also observed that the expression of ribosome biosynthetic genes was modestly repressed in the pmi40-101 mutant (Fig. S3). The only exception was MPR8, which showed induced expression (Fig. S3). This is consistent with previous reports (Yale and Bohnert, 2001; Parveen et al., 2003) indicating a distinct regulatory function for the protein. Genes involved in amino acid biosynthesis were also repressed in the pmi40-101 mutant (Table 2 and Fig. S3).
Cell cycle
Cell growth and the cell cycle are coupled processes (Tapon et al., 2001). Many genes are cell cycle regulated, and their differential expression by DNA microarray analysis can be used to pinpoint changes in cell cycle progression (Futcher, 2000). We examined the expression profile of the pmi40-101 mutant for such a bias and found differential induction of G-associated transcripts, including the G1 cyclins (Levine et al., 1995) encoded by the CLN1, CLN2 and CLN3 genes, and the gene encoding the Pho85 G1 cyclin PCL1 (Table 2 and Fig. S1). Genes that control entry into the G2 phase of the cell cycle (Yeong et al., 2001) were repressed, including the cyclins CLB1 and CLB2 (Table 2 and Fig. S1). Delay in the G1 phase of the cell cycle is consistent with entry into stationary phase (Reinders et al., 1998) and with the slow growth defect and higher percentage of round, unbudded cells observed in the pmi40-101 mutant (data not shown). G1 delay is also consistent with the G1 arrest observed in cells containing misfolded proteins (Trotter et al., 2001). Delay in the G1 phase of the cell cycle indicates that a cell cycle checkpoint is initiated in the mutant in response to a glycosylation defect.
Defects in protein glycosylation activate the protein kinase C (PKC) and filamentous growth MAP kinase pathways
Activation of MAP kinase pathways can occur in response to a wide variety of cellular stresses. We examined the expression of known MAP kinase pathway targets to characterize the signaling response initiated in the pmi40-101 mutant. Comparison of the expression profile of the pmi40-101 mutant with targets of the cell wall integrity pathway (or PKC pathway) (Jung and Levin, 1999) revealed that 72% (18/25) of known PKC targets were induced in the pmi40-101 mutant (Table 3; Fig. S4). In addition, genes that encode components of that pathway, including the MAP kinase Mpk1 (Slt2), and transcription factor, Rlm1 (Jung et al., 2002), were modestly induced in the pmi40-101 mutant (Fig. S4).
Table 3.
Microarray analysis of MAP kinase targets differentially expressed in the pmi40-101 mutant
| Gene name | Fold change | P-value | Process/function |
|---|---|---|---|
| PKC | |||
| PRM5* | 12.9 | <0.001 | Pheromone-regulated protein, induced by PKC |
| YLR194C | 8.2 | <0.001 | Unknown |
| PIR3 | 4.5 | <0.001 | Cell wall organization and biogenesis |
| FKS2 | 4.3 | <0.001 | Cell wall biogenesis; 1,3-beta;-D-glucan synthase subunit |
| CRH1 | 4.1 | <0.001 | Cell wall biogenesis (putative); cell wall protein |
| PST1* | 3.2 | <0.001 | Secreted by regenerating protoplasts |
| HSP150 | 2.9 | <0.001 | Heat shock response; secreted glycoprotein of heat shock protein (HSP) family |
| DFG5 | 2.7 | <0.001 | Pseudohyphal growth |
| CIS3 | 2.6 | <0.001 | Unknown |
| SED1 | 2.4 | <0.001 | Cell surface glycoprotein |
| CHS3 | 2.2 | <0.001 | Cell wall biogenesis; chitin synthase III |
| SLT2 | 2.1 | <0.001 | MAP kinase for PKC pathway |
| Filamentous growth | |||
| SVS1 | 11.4 | <0.001 | Vanadate resistance |
| RTA1 | 5.6 | <0.001 | 7-Aminocholesterol resistance |
| YLR042C | 5.3 | <0.001 | Unknown |
| KTR2 | 4.3 | <0.001 | Protein glycosylation; putative mannosyltransferase |
| YLR414C | 3.2 | <0.001 | Unknown |
| YPS1 | 3.1 | <0.001 | Protein processing; GPI-anchored aspartic protease |
| MSB2 | 2.7 | <0.001 | Filamentous growth pathway; cell surface component |
| MPT5 | 2.2 | <0.001 | Cell wall organization and biogenesis |
| YOR248W | 2.2 | <0.001 | Unknown |
| KSS1 | 2.1 | <0.001 | MAP kinase for the filamentous growth pathway |
| DDR48 | 2.1 | <0.001 | Induced by DNA damage, heat shock, or osmotic stress |
| WSC2 | 2.0 | <0.001 | Cell wall biogenesis; α-1,4-glucan-glucosidase |
| FLO11 | – 9.6 | <0.001 | Flocculation, invasive growth; regulated by the MAP kinase and cAMP pathways |
| HOG | |||
| YDL223C | 2.3 | <0.001 | Cellular morphogenesis |
| RHR2 | 2.2 | <0.001 | Glycerol metabolism; DL-glycerol-3-phosphatase |
| HOR2 | 2.2 | <0.001 | Glycerol metabolism; DL-glycerol-3-phosphatase |
Results are presented as fold changes in mRNA levels (≥2 and ≤ −2). Gene descriptions are from the Saccharomyces Genome database (http://www.yeastgenome.org).
Target of both PKC and filamentous growth pathways.
GPI, glycosylphosphatidylinositol.
Activation of the PKC pathway can occur in response to integrity defects in the cell wall (Levin et al., 1994; Kamada et al., 1995). Comparison of the expression profile of the pmi40-101 mutant with an expression profile derived from cells defective for 1,3-beta;-glucan synthase (fks1; Terashima et al., 2000) showed a striking overlap: 91% (20/22) of the genes induced in an fks1 mutant were also induced in the pmi40-101 mutant (Fig. S4). Most of these genes also contain Rlm1-binding sites in their promoter regions (Terashima et al., 2000). The induced cell wall genes include those that encode cell wall constituents such as chitin synthases (CHS1, CHS3, and CHS7) and genes that contribute to chitin biosynthesis (CSI2 and GFA1). The expression of several other genes known to influence cell wall biosynthesis, but not known Rlm1 targets, was induced in the pmi40-101 mutant, including SCW10, which encodes a cell wall glucanase, and KRE11, which encodes a regulator of beta;-1,6-glucan synthesis (Fig. S4). Activation of the PKC pathway in response to a glycosylation defect is consistent with the increased sensitivity of the pmi40-101 mutant to cell wall-perturbing agents (Cullen et al., 2000), with the previously reported induction of FKS2 (GSC2) expression observed in protein glycosylation mutants (Lee and Elion, 1999), and with the requirement for the PKC pathway for viability of glycosylation mutants (Cullen et al., 2000). As general cell wall defects resulting from hypoglycosylation of cell wall mannoproteins (Osmond et al., 1999), and defects in beta;-1,6-glucan synthesis (Chavan et al., 2003), induce similar responses, the data indicate that a defect in protein glycosylation causes a cell wall defect, which in turn triggers a PKC pathway-dependent response to maintain cell integrity.
We previously showed that a second MAP kinase pathway, the filamentous growth pathway, is activated in response to a protein glycosylation defect and is required for viability under this condition (Cullen et al., 2000). The expression profile of the pmi40-101 mutant confirmed that targets of the filamentous growth pathway (Roberts et al., 2000), including SVS1, YLR042c, and PGU1, were induced in the pmi40-101 mutant. One exception was the FLO11 gene, which is a known filamentous growth pathway target (Rupp et al., 1999) that was downregulated in the pmi40-101 mutant (Fig. S5). The FLO11 promoter is complex (Rupp et al., 1999) and contains cis-elements on which multiple signaling pathways converge; thus, its regulation in this instance may reflect the combined influence of multiple pathways. Genes that encode components of the filamentous growth pathway, including MSB2 and KSS1 (Table 3) (Cullen et al., 2004), were also induced in the pmi40-101 mutant. Filamentous growth is known to occur in response to nutrient depletion (Gimeno et al., 1992; Cullen and Sprague, 2000). Since the expression profile of the pmi40-101 mutant indicates that the cells suffer nutritional stress, it is possible that this condition contributes to activation of the filamentous growth pathway.
Filamentous growth pathway activation is distinct from high osmolarity glycerol response (HOG) pathway activation
We determined if targets of a third MAP kinase pathway, the HOG pathway, were induced in the pmi40-101 mutant. Transcriptional targets of the HOG pathway, including GPD1, CTT1, GPH1, HOR2, SIP18, GRE1, PGM2, STL1, and ALD6 (Posas et al., 2000; O’Rourke and Herskowitz, 2004), were not induced in the pmi40-101 mutant (Table 3), even at time points at which HOG pathway activation is reported to be maximal (data not shown). Only three HOG pathway targets were significantly induced: YDL233c, RHR2, and HOR2 (Table 3). Moreover, expression of the gene encoding the HOG pathway MAP kinase, HOG1, was not induced (Fig. S5).
Sho1 is an upstream component of both the filamentous growth and HOG pathways (Cullen et al., 2004). The DNA microarray analysis suggests that Sho1 activation is restricted to the filamentous growth pathway in the glycosylation mutant. This hypothesis is supported by expression analysis of cells undergoing filamentous growth (Madhani et al., 1999; Roberts et al., 2000) and by a report indicating that the HOG and PKC pathways function antagonistically (Garcia-Rodriguez et al., 2000). We determined whether Sho1 functions specifically in the filamentous growth pathway during a glycosylation defect. We used the nuclear localization of the HOG pathway MAP kinase Hog1 (Ferrigno et al., 1998; Reiser et al., 2000) to measure Sho1 activity in the HOG pathway. An integrated and functional Hog1–GFP fusion in the pmi40-101 mutant lacking the Sln1 branch of the HOG pathway (Posas and Saito, 1998) (ssk1) showed predominantly cytoplasmic localization of Hog1–GFP throughout a culture growth cycle in medium lacking mannose (Figs 2a and b). Addition of salt (0.9 M NaCl) caused rapid nuclear localization of Hog1–GFP in >90% of cells (Figs 2a and b). We also examined the specificity of Sho1 function in response to filamentous growth pathway activation. We found that the HOG pathway is not activated during filamentation in the Σ1278b background based on cytoplasmic localization of Hog1–GFP in ssk1 strains in glucose-limited medium (Fig. 2c). Therefore, in the two contexts in which Sho1 functions in the filamentous growth pathway, its activity appears to be restricted to that pathway.
Fig. 2.

Sho1 activation in response to a glycosylation defect or during filamentous growth does not activate the HOG pathway. (a) The pmi40-101 mutant containing ssk1 and an integrated Hog1–GFP fusion (strain 1004) was grown in medium containing mannose (+Man), lacking mannose ( −Man) or lacking mannose and containing 0.9 M NaCl ( −Man, +NaCl). Cells were examined by differential interference contrast (DIC) or fluorescence (FITC) microscopy at ×1000. Bar, 10 μm. (b) Graph of nuclear Hog1–GFP over a culture growth cycle. The strain in (a) was grown in media containing mannose (white squares, −Man), lacking mannose (filled triangles, +Man), or lacking mannose and containing 0.9 M NaCl (filled circles, –Man, −NaCl) over a culture growth cycle and periodically assayed for nuclear Hog1–GFP localization. (c) Filamentous Σ1278b cells lacking ssk1 and containing Hog1–GFP (strain 1006) were grown on minimal semisolid agar media containing or lacking glucose (Glu) for 24 h at 30 °C. A coverslip was added directly to the plate and cells were examined. Where indicated, NaCl (final 200 mM) was also added to the plate. Cells were examined by DIC or fluorescence (FITC) microscopy at ×1000. Bar, 10 μm.
Although Sho1 activity in the filamentous growth pathway does not trigger HOG pathway activation, Sho1 retains the capacity to function in the HOG pathway under conditions in which the filamentous growth pathway is active. Specifically, addition of salt to pmi40-101 ssk1 HOG1–GFP cells in medium lacking mannose (data not shown), or to ssk1 HOG1–GFP cells undergoing filamentous growth, caused rapid nuclear localization of Hog1–GFP (Fig. 2c). Therefore, Sho1 function in the filamentous growth pathway does not preclude its ability to activate the HOG pathway.
In summary, we have identified a large number of genes that are differentially expressed in response to a defect in protein glycosylation. An important subset of these are transcriptional targets of two MAP kinase pathways, indicating that one cellular response to glycosylation deficiency is MAP kinase pathway activation. This response may be a common theme in intracellular regulation in eukaryotic cells.
Supplementary Material
Acknowledgments
This work was supported by a research grant from the US Public Health Service (GM-30027 for G.F.S.) and a postdoctoral fellowship from the American Heart Association (AHA120635Z for P.C.). We thank Charlie Boone and John Pringle for plasmids, and Marc Dorfman for assistance with Hog1–GFP localization.
Footnotes
The following supplementary material is available online:
Fig. S1. Genes differentially expressed in the pmi40-101 mutant involved in the UPR, protein glycosylation and cell cycle progression pathways. Heat map without cluster analysis showing differential expression of genes for the six trials of the DNA microarray analysis. As shown in the scale bar, red indicates degree of differential induction, and green indicates degree of differential repression. The Fold Change refers to the average of all six experiments, with the indicated P-value shown. Function refers to gene descriptions from the Saccharomyces Genome database (http://www.yeastgenome.org).
Fig. S2. Overlap between the ESR and glycosylation mutant expression profiles. (a) Expression profile of genes differentially expressed >2-fold in the pmi40-101 mutant (left two panels), and expression profile of known genes induced in the ESR (right panel). The description of the heat map produced for the microarray analysis is as in Fig. S1. (b) Venn diagram illustrating the degree of overlap between the two profiles.
Fig. S3. Nutritionally controlled genes are differentially expressed in the pmi40-101 mutant. Genes are clustered loosely by function. The description of the heat map produced for the microarray analysis is as in Fig. S1.
Fig. S4. PKC, fks1 and cell wall genes are differentially expressed in the pmi40-101 mutant. For the PKC pathway targets, the CTT1, SPS100, MLP1, PGK1 and PIR1 profiles are not shown because they contained high P-values. The description of the heat map produced for the microarray analysis is as in Fig. S1.
Fig. S5. Genes differentially expressed in the pmi40-101 mutant that comprise known filamentous growth and HOG pathway targets. The description of the heat map produced for the microarray analysis is as in Fig. S1.
This material is available as part of the online article from http://www.blackwell-synergy.com
References
- Baldi P, Long AD. A Bayesian framework for the analysis of microarray expression data: regularized t-test and statistical inferences of gene changes. Bioinformatics. 2001;17:509–519. doi: 10.1093/bioinformatics/17.6.509. [DOI] [PubMed] [Google Scholar]
- Chapman R, Sidrauski C, Walter P. Intracellular signaling from the endoplasmic reticulum to the nucleus. Annu Rev Cell Dev Biol. 1998;14:459–485. doi: 10.1146/annurev.cellbio.14.1.459. [DOI] [PubMed] [Google Scholar]
- Chavan M, Suzuki T, Rekowicz M, Lennarz W. Genetic, biochemical, and morphological evidence for the involvement of N-glycosylation in biosynthesis of the cell wall beta1,6-glucan of Saccharomyces cerevisiae. Proc Natl Acad Sci USA. 2003;100:15381–15386. doi: 10.1073/pnas.2536561100. [DOI] [PMC free article] [PubMed] [Google Scholar]
- Cullen PJ, Sprague GF., Jr Glucose depletion causes haploid invasive growth in yeast. Proc Natl Acad Sci USA. 2000;97:13619–13624. doi: 10.1073/pnas.240345197. [DOI] [PMC free article] [PubMed] [Google Scholar]
- Cullen PJ, Schultz J, Horecka J, Stevenson BJ, Jigami Y, Sprague GF., Jr Defects in protein glycosylation cause SHO1-dependent activation of a STE12 signaling pathway in yeast. Genetics. 2000;155:1005–1018. doi: 10.1093/genetics/155.3.1005. [DOI] [PMC free article] [PubMed] [Google Scholar]
- Cullen PJ, Sabbagh W, Jr, Graham E, Irick MM, van Olden EK, Neal C, Delrow J, Bardwell L, Sprague GF., Jr A signaling mucin at the head of the Cdc42- and MAPK-dependent filamentous growth pathway in yeast. Genes Dev. 2004;18:1695–1708. doi: 10.1101/gad.1178604. [DOI] [PMC free article] [PubMed] [Google Scholar]
- DeRisi JL, Iyer VR, Brown PO. Exploring the metabolic and genetic control of gene expression on a genomic scale. Science. 1997;278:680–686. doi: 10.1126/science.278.5338.680. [DOI] [PubMed] [Google Scholar]
- Eisen MB, Spellman PT, Brown PO, Botstein D. Cluster analysis and display of genome-wide expression patterns. Proc Natl Acad Sci USA. 1998;95:14863–14868. doi: 10.1073/pnas.95.25.14863. [DOI] [PMC free article] [PubMed] [Google Scholar]
- Fazzio TG, Kooperberg C, Goldmark JP, Neal C, Basom R, Delrow J, Tsukiyama T. Widespread collaboration of Isw2 and Sin3-Rpd3 chromatin remodeling complexes in transcriptional repression. Mol Cell Biol. 2001;21:6450–6460. doi: 10.1128/MCB.21.19.6450-6460.2001. [DOI] [PMC free article] [PubMed] [Google Scholar]
- Ferrigno P, Posas F, Koepp D, Saito H, Silver PA. Regulated nucleo/cytoplasmic exchange of HOG1 MAPK requires the importin beta homologs NMD5 and XPO1. EMBO J. 1998;17:5606–5614. doi: 10.1093/emboj/17.19.5606. [DOI] [PMC free article] [PubMed] [Google Scholar]
- Futcher B. Microarrays and cell cycle transcription in yeast. Curr Opin Cell Biol. 2000;12:710–715. doi: 10.1016/s0955-0674(00)00156-3. [DOI] [PubMed] [Google Scholar]
- Garcia-Rodriguez LJ, Duran A, Roncero C. Calcofluor antifungal action depends on chitin and a functional high-osmolarity glycerol response (HOG) pathway: evidence for a physiological role of the Saccharomyces cerevisiae HOG pathway under noninducing conditions. J Bacteriol. 2000;182:2428–2437. doi: 10.1128/jb.182.9.2428-2437.2000. [DOI] [PMC free article] [PubMed] [Google Scholar]
- Gasch AP, Spellman PT, Kao CM, Carmel-Harel O, Eisen MB, Storz G, Botstein D, Brown PO. Genomic expression programs in the response of yeast cells to environmental changes. Mol Biol Cell. 2000;11:4241–4257. doi: 10.1091/mbc.11.12.4241. [DOI] [PMC free article] [PubMed] [Google Scholar]
- Gietz RD, Schiestl RH, Willems AR, Woods RA. Studies on the transformation of intact yeast cells by the liac/SS-DNA/PEG procedure. Yeast. 1995;11:355–360. doi: 10.1002/yea.320110408. [DOI] [PubMed] [Google Scholar]
- Gimeno CJ, Ljungdahl PO, Styles CA, Fink GR. Unipolar cell divisions in the yeast S. cerevisiae lead to filamentous growth: regulation by starvation and RAS. Cell. 1992;68:1077–1090. doi: 10.1016/0092-8674(92)90079-r. [DOI] [PubMed] [Google Scholar]
- Jung US, Levin DE. Genome-wide analysis of gene expression regulated by the yeast cell wall integrity signalling pathway. Mol Microbiol. 1999;34:1049–1057. doi: 10.1046/j.1365-2958.1999.01667.x. [DOI] [PubMed] [Google Scholar]
- Jung US, Sobering AK, Romeo MJ, Levin DE. Regulation of the yeast Rlm1 transcription factor by the Mpk1 cell wall integrity MAP kinase. Mol Microbiol. 2002;46:781–789. doi: 10.1046/j.1365-2958.2002.03198.x. [DOI] [PubMed] [Google Scholar]
- Kamada Y, Jung US, Piotrowski J, Levin DE. The protein kinase C-activated MAP kinase pathway of Saccharomyces cerevisiae mediates a novel aspect of the heat shock response. Genes Dev. 1995;9:1559–1571. doi: 10.1101/gad.9.13.1559. [DOI] [PubMed] [Google Scholar]
- Klebl B, Kozian D, Leberer E, Kukuruzinska MA. A comprehensive analysis of gene expression profiles in a yeast N-glycosylation mutant. Biochem Biophys Res Commun. 2001;286:714–720. doi: 10.1006/bbrc.2001.5457. [DOI] [PubMed] [Google Scholar]
- Lashkari DA, DeRisi JL, McCusker JH, Namath AF, Gentile C, Hwang SY, Brown PO, Davis RW. Yeast microarrays for genome wide parallel genetic and gene expression analysis. Proc Natl Acad Sci USA. 1997;94:13057–13062. doi: 10.1073/pnas.94.24.13057. [DOI] [PMC free article] [PubMed] [Google Scholar]
- Lecca MR, Wagner U, Patrignani A, Berger EG, Hennet T. Genome-wide analysis of the unfolded protein response in fibroblasts from congenital disorders of glycosylation type-I patients. Faseb J. 2004 doi: 10.1096/fj.04-2397fje. [DOI] [PubMed] [Google Scholar]
- Lee BN, Elion EA. The MAPKKK Ste11 regulates vegetative growth through a kinase cascade of shared signaling components. Proc Natl Acad Sci USA. 1999;96:12679–12684. doi: 10.1073/pnas.96.22.12679. [DOI] [PMC free article] [PubMed] [Google Scholar]
- Levin DE, Bowers B, Chen CY, Kamada Y, Watanabe M. Dissecting the protein kinase C/MAP kinase signalling pathway of Saccharomyces cerevisiae. Cell Mol Biol Res. 1994;40:229–239. [PubMed] [Google Scholar]
- Levine K, Tinkelenberg AH, Cross F. The CLN gene family: central regulators of cell cycle Start in budding yeast. Prog Cell Cycle Res. 1995;1:101–114. doi: 10.1007/978-1-4615-1809-9_8. [DOI] [PubMed] [Google Scholar]
- Longtine MS, McKenzie A, III, Demarini DJ, Shah NG, Wach A, Brachat A, Philippsen P, Pringle JR. Additional modules for versatile and economical PCR-based gene deletion and modification in Saccharomyces cerevisiae. Yeast. 1998;14 :953–961. doi: 10.1002/(SICI)1097-0061(199807)14:10<953::AID-YEA293>3.0.CO;2-U. [DOI] [PubMed] [Google Scholar]
- Madhani HD, Galitski T, Lander ES, Fink GR. Effectors of a developmental mitogen-activated protein kinase cascade revealed by expression signatures of signaling mutants. Proc Natl Acad Sci USA. 1999;96:12530–12535. doi: 10.1073/pnas.96.22.12530. [DOI] [PMC free article] [PubMed] [Google Scholar]
- Mori K, Ogawa N, Kawahara T, Yanagi H, Yura T. mRNA splicing-mediated C-terminal replacement of transcription factor Hac1p is required for efficient activation of the unfolded protein response. Proc Natl Acad Sci USA. 2000;97:4660–4665. doi: 10.1073/pnas.050010197. [DOI] [PMC free article] [PubMed] [Google Scholar]
- Ng DT, Spear ED, Walter P. The unfolded protein response regulates multiple aspects of secretory and membrane protein biogenesis and endoplasmic reticulum quality control. J Cell Biol. 2000;150:77–88. doi: 10.1083/jcb.150.1.77. [DOI] [PMC free article] [PubMed] [Google Scholar]
- O’Rourke SM, Herskowitz I. Unique and redundant roles for HOG MAPK pathway components as revealed by whole-genome expression analysis. Mol Biol Cell. 2004;15:532–542. doi: 10.1091/mbc.E03-07-0521. [DOI] [PMC free article] [PubMed] [Google Scholar]
- Ohnishi T, Muroi M, Tanamoto K. MD-2 is necessary for the toll-like receptor 4 protein to undergo glycosylation essential for its translocation to the cell surface. Clin Diagn Lab Immunol. 2003;10:405–410. doi: 10.1128/CDLI.10.3.405-410.2003. [DOI] [PMC free article] [PubMed] [Google Scholar]
- Osmond BC, Specht CA, Robbins PW. Chitin synthase III: synthetic lethal mutants and ‘stress-related’ chitin synthesis that bypasses the CSD3/CHS6 localization pathway. Proc Natl Acad Sci USA. 1999;96:11206–11210. doi: 10.1073/pnas.96.20.11206. [DOI] [PMC free article] [PubMed] [Google Scholar]
- Parveen M, Momose Y, Kitagawa E, Kurita S, Kodama O, Iwahashi H. Bioassay of pesticide Llndane using yeast-DNA microarray technology. Chem-Bio Informatics J. 2003;3:12–29. [Google Scholar]
- Pitkanen JP, Torma A, Alff S, Huopaniemi L, Mattila P, Renkonen R. Excess mannose limits the growth of phosphomannose isomerase PMI40 deletion strain of Saccharomyces cerevisiae. J Biol Chem. 2004 doi: 10.1074/jbc.M410619200. [DOI] [PubMed] [Google Scholar]
- Posas F, Saito H. Activation of the yeast SSK2 MAP kinase kinase kinase by the SSK1 two-component response regulator. EMBO J. 1998;17:1385–1394. doi: 10.1093/emboj/17.5.1385. [DOI] [PMC free article] [PubMed] [Google Scholar]
- Posas F, Chambers JR, Heyman JA, Hoeffler JP, de Nadal E, Arino J. The transcriptional response of yeast to saline stress. J Biol Chem. 2000;275:17249–17255. doi: 10.1074/jbc.M910016199. [DOI] [PubMed] [Google Scholar]
- Raught B, Gingras AC, Sonenberg N. The target of rapamycin (TOR) proteins. Proc Natl Acad Sci USA. 2001;98:7037–7044. doi: 10.1073/pnas.121145898. [DOI] [PMC free article] [PubMed] [Google Scholar]
- Reinders A, Burckert N, Boller T, Wiemken A, De Virgilio C. Saccharomyces cerevisiae camp-dependent protein kinase controls entry into stationary phase through the Rim15p protein kinase. Genes Dev. 1998;12:2943–2955. doi: 10.1101/gad.12.18.2943. [DOI] [PMC free article] [PubMed] [Google Scholar]
- Reiser V, Salah SM, Ammerer G. Polarized localization of yeast Pbs2 depends on osmostress, the membrane protein Sho1 and Cdc42. Nat Cell Biol. 2000;2:620–627. doi: 10.1038/35023568. [DOI] [PubMed] [Google Scholar]
- Roberts CJ, Nelson B, Marton MJ, et al. Signaling and circuitry of multiple MAPK pathways revealed by a matrix of global gene expression profiles. Science. 2000;287:873–880. doi: 10.1126/science.287.5454.873. [DOI] [PubMed] [Google Scholar]
- Rose MD, Winston F, Hieter P. Methods in Yeast Genetics. Cold Spring Harbor Laboratory Press; Cold Spring Harbor, NY: 1990. [Google Scholar]
- Rupp S, Summers E, Lo HJ, Madhani H, Fink G. MAP kinase and camp filamentation signaling pathways converge on the unusually large promoter of the yeast FLO11 gene. EMBO J. 1999;18:1257–1269. doi: 10.1093/emboj/18.5.1257. [DOI] [PMC free article] [PubMed] [Google Scholar]
- Sambrook J, Fritsch EF, Maniatis T. Molecular Cloning: A Laboratory Manual. Cold Spring Harbor Laboratory Press; Cold Spring Harbor, NY: 1989. [Google Scholar]
- Scheiffele P, Fullekrug J. Glycosylation and protein transport. Essays Biochem. 2000;36:27–35. doi: 10.1042/bse0360027. [DOI] [PubMed] [Google Scholar]
- Smith DJ, Proudfoot A, Friedli L, Klig LS, Paravicini G, Payton MA. PMI40, an intron-containing gene required for early steps in yeast mannosylation. Mol Cell Biol. 1992;12:2924–2930. doi: 10.1128/mcb.12.7.2924. [DOI] [PMC free article] [PubMed] [Google Scholar]
- Spiro RG. Protein glycosylation: nature, distribution, enzymatic formation, and disease implications of glycopeptide bonds. Glycobiology. 2002;12:43R–56R. doi: 10.1093/glycob/12.4.43r. [DOI] [PubMed] [Google Scholar]
- Tapon N, Moberg KH, Hariharan IK. The coupling of cell growth to the cell cycle. Curr Opin Cell Biol. 2001;13:731–737. doi: 10.1016/s0955-0674(00)00284-2. [DOI] [PubMed] [Google Scholar]
- Terashima H, Yabuki N, Arisawa M, Hamada K, Kitada K. Up-regulation of genes encoding glycosylphosphatidylinositol (GPI)-attached proteins in response to cell wall damage caused by disruption of FKS1 in Saccharomyces cerevisiae. Mol Gen Genet. 2000;264:64–74. doi: 10.1007/s004380000285. [DOI] [PubMed] [Google Scholar]
- Travers KJ, Patil CK, Wodicka L, Lockhart DJ, Weissman JS, Walter P. Functional and genomic analyses reveal an essential coordination between the unfolded protein response and ER-associated degradation. Cell. 2000;101:249–258. doi: 10.1016/s0092-8674(00)80835-1. [DOI] [PubMed] [Google Scholar]
- Trotter EW, Berenfeld L, Krause SA, Petsko GA, Gray JV. Protein misfolding and temperature up-shift cause G1 arrest via a common mechanism dependent on heat shock factor in Saccharomyces cerevisiae. Proc Natl Acad Sci USA. 2001;98:7313–7318. doi: 10.1073/pnas.121172998. [DOI] [PMC free article] [PubMed] [Google Scholar]
- Warner JR. The economics of ribosome biosynthesis in yeast. Trends Biochem Sci. 1999;24:437–440. doi: 10.1016/s0968-0004(99)01460-7. [DOI] [PubMed] [Google Scholar]
- Watanabe I, Zhu J, Recio-Pinto E, Thornhill WB. Glycosylation affects the protein stability and cell surface expression of Kv1.4 but Not Kv1.1 potassium channels. A pore region determinant dictates the effect of glycosylation on trafficking. J Biol Chem. 2004;279:8879–8885. doi: 10.1074/jbc.M309802200. [DOI] [PubMed] [Google Scholar]
- Yale J, Bohnert HJ. Transcript expression in Saccharomyces cerevisiae at high salinity. J Biol Chem. 2001;276:15996–16007. doi: 10.1074/jbc.M008209200. [DOI] [PubMed] [Google Scholar]
- Yeong FM, Lim HH, Wang Y, Surana U. Early expressed Clb proteins allow accumulation of mitotic cyclin by inactivating proteolytic machinery during S phase. Mol Cell Biol. 2001;21:5071–5081. doi: 10.1128/MCB.21.15.5071-5081.2001. [DOI] [PMC free article] [PubMed] [Google Scholar]
Associated Data
This section collects any data citations, data availability statements, or supplementary materials included in this article.