Abstract
Induced resistance in plants is a systemic response to certain microorganisms or chemicals that enhances basal defense responses during subsequent plant infection by pathogens. Inoculation of chile pepper with zoospores of non-host Phytophthora nicotianae or the chemical elicitor beta-aminobutyric acid (BABA) significantly inhibited foliar blight caused by Phytophthora capsici. Tissue extract analyses by GC/MS identified conserved change in certain metabolite concentrations following P. nicotianae or BABA treatment. Induced chile pepper plants had reduced concentrations of sucrose and TCA cycle intermediates and increased concentrations of specific hexose-phosphates, hexose-disaccharides and amino acids. Galactose, which increased significantly in induced chile pepper plants, was shown to inhibit growth of P. capsici in a plate assay.
Introduction
Phytophthora capsici is an economically significant oomycete plant pathogen that impacts production of several crops worldwide, especially solanaceous and cucurbitaceous vegetable crops. With adequate moisture, this pathogen causes Phytophthora blight, which affects all aboveground and belowground parts of susceptible hosts [1]. Under conducive environmental conditions, P. capsici can cause up to 50% yield loss on chile pepper (Capsicum annuum), an economically important crop in the Southwest United States [2].
Hemibiotrophic in nature, P. capsici establishes infection through haustoria-like structures and intercellular hyphael growth and initiates host cell-death within 48 h of successful colonization [3]. Current management of this pathogen, including the use of fungicides and tolerant cultivars, is limited in terms of reducing Phytophthora blight due to the significant amount of genetic diversity in populations of P. capsici, and the ability of the pathogen to rapidly produce large numbers of propagules on infected plants [1]. Exploration and identification of new approaches, such as induced resistance, are continually needed to reduce the impact of P. capsici on various crops.
Induced resistance or systemic acquired resistance is a well-characterized response in C. annuum to non-host pathogenic microorganisms. Inoculation of C. annuum with an avirulent strain of X. campestris induced the systemic expression of pathogenesis related (PR) gene transcripts, microoxidative burst, and induction of ion-leakage and callose deposition in non-inoculated leaves [4]. Inoculation of C. annuum with the non-host pathogen Fusarium oxysporum, significantly inhibited subsequent infection by P. capsici, Verticillium dahliae, and Botrytis cinerea, and was associated with increased chitinase activity and cell-wall bound phenolics [5]. The chemical elicitor β-amino-butyric acid (BABA) is a non-protein amino acid that induces a plant systemic defense response against subsequent infection by multiple plant pathogens [6]. Arabidopsis thaliana mutant line analysis and the use of chemical inhibitors demonstrated that BABA-induced resistance is based on abscisic acid dependent priming for callose production and is independent of jasmonic acid (JA), salicylic acid (SA), or ethylene (ET) production [7–8].
In Europe, P. nicotianae is a known pathogen on C. annuum where it causes root- and collar-rot in field-grown plants [9]. Phytophthora nicotianae isolates recovered from diseased C. annuum plants in northern Spain were all virulent on selected C. annuum plants while a reference P. nicotianae isolate was not virulent on any varieties tested, indicating differences in host range among P. nicotianae isolates [10]. To our knowledge, P. nicotianae has not been reported to cause disease in C. annuum in North America. P. nicotianae was first reported in New Mexico on onion and tomato in 2011 [11–12]. Given the importance of chile pepper production to New Mexico, P. nicotianae isolates from onion and tomato were tested for pathogenicity on C. annuum where they failed to produce disease symptoms at any inoculum level, indicating a non-host interaction.
Pathogenicity assays determine that pre-inoculation with P. nicotianae or treatment with BABA induced a cultivar independent systemic response in C. annuum, which inhibited foliar infection by P. capsici. Fluorescence microscopy and the use of H2O2 substrates identifies a potentiated induction of cell wall reinforcements and the rapid production of oxidizing compounds that leads to a hypersensitive response. Additionally, significant change in metabolite concentrations in response to BABA treatment and inoculation with non-host P. nicotianae (including changes in hexose sugars, aromatic amino acids, and glycerol 3-phosphate) are identified by GC/MS metabolite analysis. In particular, galactose concentration, which increased for induced C. annuum plants, was shown to inhibit mycelial growth of P. capsici in an in-vitro plate assay.
Results
Phytophthora nicotianae isolate NMT1 is not pathogenic on C. annuum
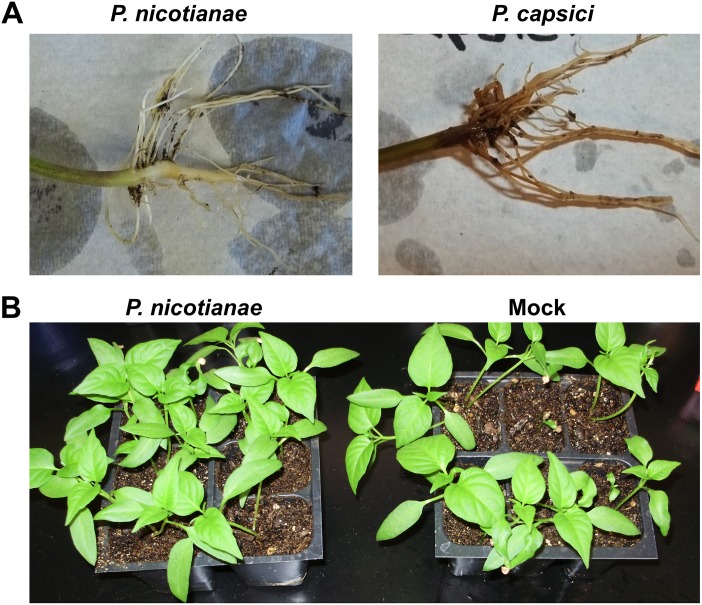
Pathogenicity assays were conducted to determine if P. nicotianae, isolated from diseased tomato in New Mexico [12] was pathogenic on C. annuum cultivars that are susceptible to P. capsici. Roots of three C. annuum cultivars (Camelot, NM-64, and Jupiter) were inoculated by soil drenching each plant with a suspension of 375,000 P. nicotianae zoospores and plants were watered daily for two weeks. No disease symptoms were observed following inoculation with P. nicotianae (Fig 1). Similarly, no disease symptoms were observed following foliage spray with a suspension of 100,000 P. nicotianae zoospores per plant and incubation in a humidity chamber (Fig 1).
Fig 1. Phytophthora nicotianae pathogenicity assays on Capsicum annuum plants.
(A) Capsicum annuum plants were soil inoculated with 375,000 P. nicotianae (isolate NMT1: Genbank: HQ711620) zoospores per plant or 10,000 P. capsici (strain PWB24: ATCC MYA-2289) zoospores per plant and watered daily for two weeks. (B) Capsicum annuum plants were foliar inoculated with 100,000 P. nicotianae zoospores or mock inoculated with water and incubated in a humidity chamber for 5 days at 28°C. No symptom development was observed on the crown, roots, or foliage of P. nicotianae inoculated plants.
Inoculation with non-host P. nicotianae or treatment with BABA elicits localized autofluorescent compounds and reduces photosynthetic rate in C. annuum
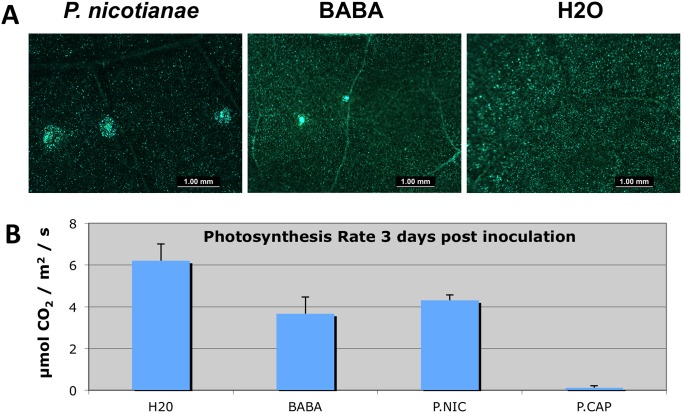
Capsicum annuum leaves were sprayed with a suspension of 2,000 P. nicotianae zoospores, 2.5 mM BABA, or water (control) and incubated in a humidity chamber. After 48 h inoculated leaf tissue was excised and imaged using a stereo fluorescent microscope. Auto-fluorescent spots, less than 1 mM in diameter, were present on leaves inoculated with P. nicotianae or treated with BABA at the site of inoculation or treatment (Fig 2). No auto-fluorescence was visible outside of the inoculated or treatment area. Occasionally, small necrotic spots (< 1mm in diameter) developed at the site of inoculation with P. nicotianae or treatment with BABA (data not shown). Capsicum annuum plants were soil drenched with a zoospore suspension of P. nicotianae or P. capsici (100,000 zoospores per plant), 2.5 mM BABA or water, and photosynthetic rates were measured using a Licor 6400 portable photosynthesis system. At three days post inoculation or treatment, photosynthetic rates for plants treated with BABA and plants treated with P. nicotianae were approximately one third of the photosynthetic rate observed for the plants treated with water. In contrast, photosynthesis in plants inoculated with P. capsici was negligible (Fig 2).
Fig 2. Treatment of Capsicum annuum with non-host Phytophthora nicotianae or BABA elicits localized autofluorescent compounds and reduces photosynthetic rate in C. annuum.
(A) C. annuum leaves were inoculated with 2,000 P. nicotianae zoospores, 2.5 mM BABA or mock inoculated with water and incubated in a humidity chamber. After 48 hours, inoculated leaf tissue was excised and imaged using a stereofluorescent microscope. (B) C. annuum plants were soil drenched with P. nicotianae or P. capsici zoospore solutions (100,000 zoospores per plant), 2.5 mM BABA or water and photosynthetic rate was measured using a Licor 6400 portable photosynthesis system 3 days post inoculation. Standard deviation bars are shown.
Soil drench with zoospore suspension of P. nicotianae or BABA inhibits P. capsici in C. annuum
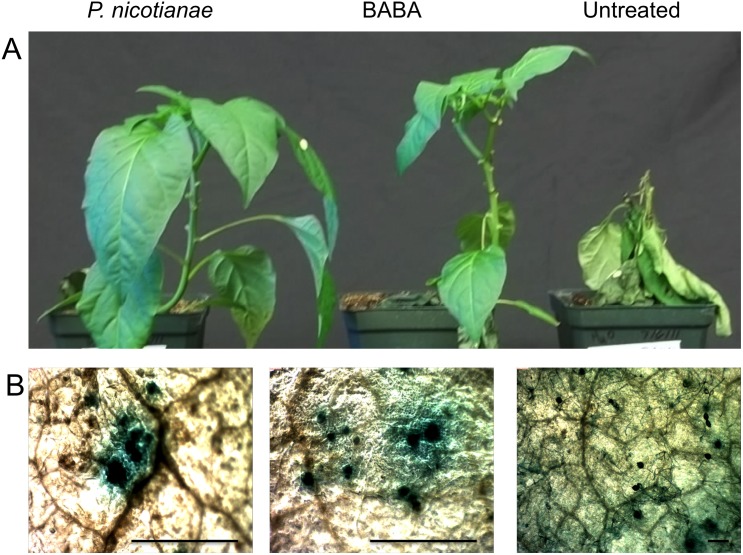
Three cultivars of C. annuum, (Camelot, NM-64, and Jupiter) were soil drenched with a suspension of 100,000 P. nicotianae zoospores, 2.5 mM BABA, or water, and subsequently foliar inoculated with a suspension of 2,000 zoospores of P. capsici per leaf. At 48 h post inoculation with P. capsici, all plants developed localized foliar symptoms consistent with a susceptible P. capsici / C. annuum interaction, with no visible differences among treatments (data not shown). At two weeks post inoculation with P. capsici, significant differences in disease progression were visible between treated and untreated plants (Fig 3). For the three C. annuum cultivars evaluated, P. capsici strain PWB 24 caused systemic foliar blight and death in all untreated plants, whereas 50%- 83% of plants treated with P. nicotianae or BABA did not develop disease symptoms outside of the inoculated leaves. Histochemical staining of GUS-expressing P. capsici was utilized to visualize pathogen structures on inoculated leaves. At 72 h post inoculation, abundant hyphae and sporangia of P. capsici were visible on untreated plants, while plants treated with BABA and P. nicotianae displayed confined areas of histochemical staining with no identifiable structures of P. capsici (Fig 3).
Fig 3. Differential response to P. capsici foliar inoculation with BABA or Phytophthora nicotianae treated Capsicum annuum.
Plants were soil drenched with 100,000 P. nicotianae zoospores, 2.5 mM BABA, or water and foliar inoculated with 2,000 P. capsici zoospores per leaf, and plants were incubated in a humidity chamber at 28°C. for 48 h Plants were removed from humidity chamber and watered normally and grown under fluorescent light for an additional two weeks. (A) P. capsici caused systemic foliar blight and death in all untreated plants, whereas 50%- 83% of P. nicotianae or BABA treated plants did not develop disease symptoms outside of the inoculated leaves. (B) Histochemical x-gluc staining of GUS expressing P. capsici was utilized to visualize pathogen structures on inoculated C. annuum leaves. At 72 h post inoculation, abundant P. capsici hyphae and sporangia were visible on untreated plants, while BABA and P. nicotianae treated plants displayed confined areas of x-gluc staining with no identifiable P. capsici structures. Scale bar 30 μm for all images.
Soil drench with zoospore suspension of P. nicotianae or BABA primes C. annuum foliar defense responses
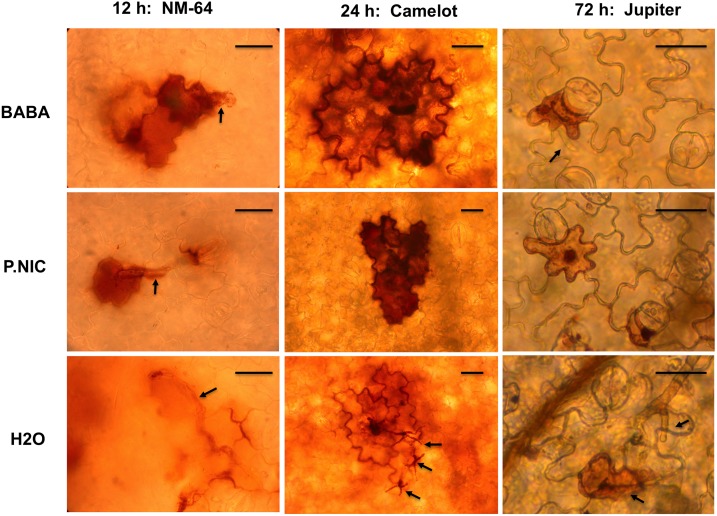
Production of autofluorescent compounds was evaluated in plants treated with P. nicotianae at 24 h post foliar inoculation with P. capsici. Confined autofluorescence in epidermal and mesophyll cells was observed, typically in close proximity to stomatal openings (data not shown). The hydrogen peroxide indicator stain 3-diaminobenzidine (DAB) was used to visualize reactive oxygen species production during initial P. capsici infection (Fig 4). At 12 h post inoculation with P. capsici, encysted zoospores with germination tubes were visible on all leaf surfaces. For plants treated with P. nicotianae and BABA, DAB staining was visible in single or multiple plant epidermal cells at or near the encysted zoospore and germ tube while staining in mock treated plants was indistinct, and often concentrated in the intercellular space between epidermal cells. At 24 h post inoculation, intense DAB staining was visible on induced plants within single or multiple epidermal cells near germinated zoospores, while DAB staining in mock treated plants remained indistinct and P. capsici hyphae could be seen emerging from leaf tissue. At 72 h post inoculation with P. capsici, induced plants had darkly stained punctate bodies within DAB stained epidermal cells. By 72 h post inoculation, mock treated plants also displayed DAB staining in epidermal cells, however, the punctate bodies were not present and abundant hyphae of P. capsici were present on the leaf surface. In addition, mock treated plants had a disorganized appearance and intercellular boundaries were not clearly defined. At all three time points, a limited number of infection sites were visualized in induced plants that were similar in appearance to mock treated plants and P. capsici hyphae were observed at low frequency (data not shown). However, no infection sites were visualized in mock treated plants that displayed similar DAB staining profiles as those shown in plants treated with BABA and P. nicotianae.
Fig 4. Enhanced production of hydrogen peroxide and development of hypersensitive response in BABA and P. nicotianae induced C. annuum plants during early P. capsici infection.
The hydrogen peroxide indicator stain 3-3- diaminobenzidine (DAB) was used to visualize reactive oxygen species production at 12, 24, and 48 h post P. capsici inoculation. The presence of hydrogen peroxide is indicated by the formation of a dark precipitate. P. capsici hyphae and germtubes are indicated with arrows. Tissue was imaged using a compound microscope with a digital camera mounted using an eyepiece adapter (Nikon, Melville, NY). Scale bar is 10 μm for all images.
Metabolic shifts associated with induced defense responses in C. annuum
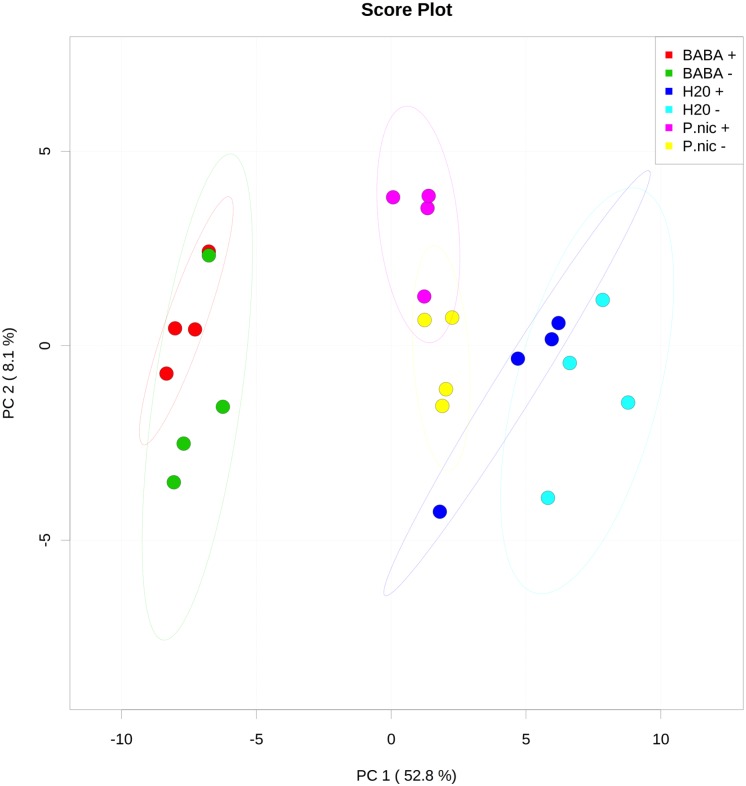
Changes in primary metabolite concentrations in C. annuum ‘Jupiter’ tissue extracts were identified by GC/MS analysis. In total, 62 compounds were identified and monitored for all samples. Principle component analysis (PCA) highlights dominant shifts in metabolite concentration for BABA treated plants (with no clear distinction between P. capsici challenged [BABA (+)] and mock challenged [BABA (-)] groups observed (Fig 5). At the 95% confidence interval, plants treated with P. nicotianae that were challenged with P. capsici [P.nic (+)] did not overlap with water treated plants [H20 (+/-)]. A post-hoc analysis of variance (ANOVA) with a p value of 0.05 identified 56 metabolite concentrations that were statistically distinct between BABA (+/-) and H20 (+/-), 26 metabolites were distinct between P. nic (+) and H20 (+/-) and six metabolites that were distinct between P.nic (+) and P.nic (-). Of the 26 metabolites that significantly changed in concentration for P.nic (+) compared to H20 (-), 25 were shifted in the same direction as BABA (+/-).
Fig 5. Principle components analysis (PCA) of relative concentrations for 62 metabolites identified in Capsicum annuum through GCMS analysis.
Capsicum annuum seedlings were treated with BABA, P. nicotianae (P.nic), or water (H2O) and challenged with P. capsici (+) or mock inoculated with water (-) for a total of 6 treatments, with each treatment replicated on 4 blocks with 15 seedlings each in each block. Normalized peak area for each metabolite was log transformed and autoscaled to focus on relative changes across treatments. Substantial shifts in metabolite concentrations were identified for BABA treated plants, with no clear distinction between P. capsici (+) or mock challenged (-) groups. P. nicotianae (P.nic) induced plants that were challenged with P. capsici were distinguishable from non-induced (H2O) plants at the 95% confidence interval.
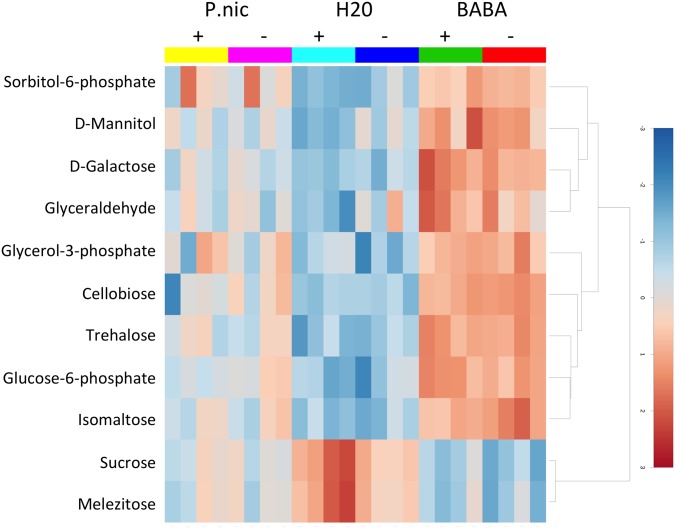
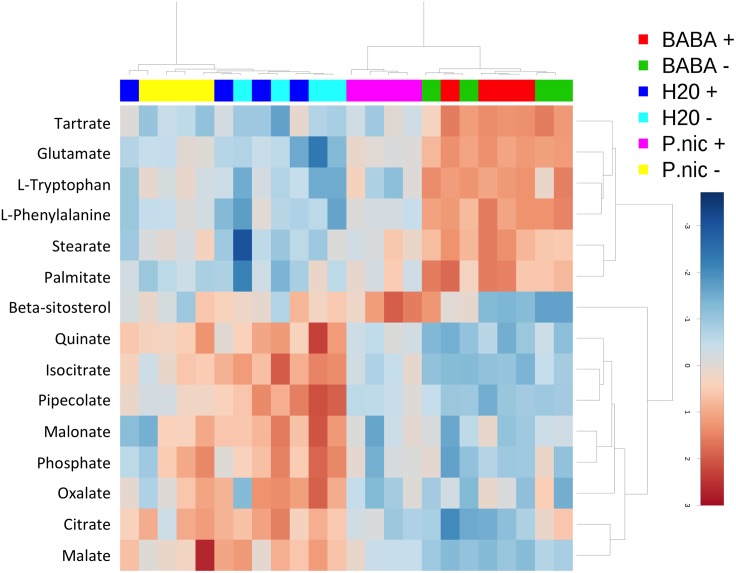
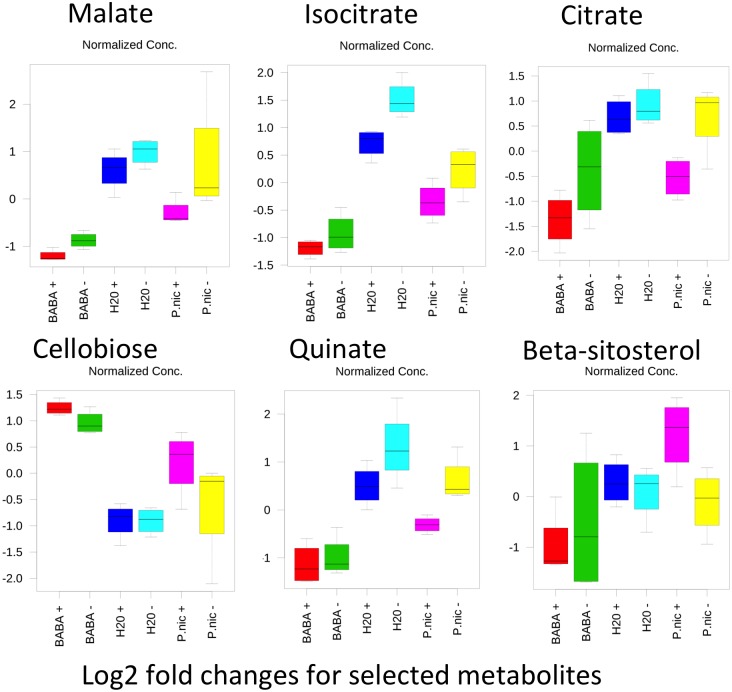
Twelve of the metabolites that were significantly shifted in P. nic (+/-) treated plants compared to H20 (+/-) plants were carbohydrates. Induced plants had reduced concentrations of sucrose and melezitose and increased concentration of sorbitol-6-phosphate, mannitol, galactose, glyceraldehyde, glycerol-3-phosphate, cellobiose, trehalose, glucose-6-phosphate and isomaltose (Fig 6). There were no significant differences in carbohydrate concentrations between H20 (+) and H20 (-) treatments. The remaining 14 compounds that were significantly shifted between P.nic(+) and H20(-) include aromatic amino acids, lipids, TCA-cycle intermediates and phosphoric acid. Dendrogram analysis of non-carbohydrate metabolites grouped P. nic(+) treated plants with BABA(+/-) treated plants, while P.nic(-) treated plants were grouped with H20 (+/-) treated plants (Fig 7). In total, six metabolites were statistically distinct between P.nic (+) and P.nic (-) treated plants (Fig 8). The TCA-cycle intermediates, isocitrate, citrate and malate significantly decreased in concentration for plants treated with P. nicotianae and challenged with P. capsici. In addition, cellobiose, and beta-sitosterol increased in concentration while quinate decreased in concentration for P.nic(+) plants compared to P.nic(-) plants. Metabolite concentrations that were shifted in both P.nic(+) and P.nic(-) plants included increases in tartrate, glutamate, tryptophan, phenylalanine, octadecanoate and hexadecanoate and decreased concentrations of pipecolate, malonate, and oxalate. Table 1 lists all metabolites with fold changes greater than 2 between BABA and H20 treated plants.
Fig 6. Heat map of carbohydrate metabolites that significantly changed in concentration for BABA and P. nicotianae induced plants.
Capsicum annuum seedlings were treated with BABA, P. nicotianae (P.nic), or water (H2O) and challenged with P. capsici (+) or mock inoculated with water (-) for a total of 6 treatments, with each treatment replicated on 4 blocks with 15 seedlings each in each block. Metabolites in red indicate higher relative concentrations while those in blue indicate lower relative concentrations.
Fig 7. Heat map and dendrogram of non-carbohydrate metabolites that significantly changed in Phytophthora nicotianae induced Capsicum annuum plants.
Capsicum annuum seedlings were treated with BABA, P. nicotianae (P.nic), or water (H2O) and challenged with P. capsici (+) or mock inoculated with water (-) for a total of 6 treatments, with each treatment replicated on 4 blocks with 15 seedlings each in each block. Dendrogram was constructed using the Spearman distance measure and Ward clustering algorithm. Metabolites in red indicate higher relative concentrations while those in blue indicate lower relative concentrations.
Fig 8. Box and whisker plots for metabolites that were statistically distinct between Phytophthora nicotianae induced plants that were challenged with P. capsici [P.nic (+)] and mock inoculated plants [P.nic (-)].
Data were log transformed and autoscaled (mean centered and divided by the standard deviation of each variable) to focus on relative changes in metabolite profiles across treatments.
Table 1. Metabolites with fold changes greater than 2 between BABA and water treated C. annuum plants.
| Metabolite Name | Signature Ion | Elution time | Fold Change |
|---|---|---|---|
| Malonic Acid | 234 | 9.5 | 0.4 |
| L-Alanine | 190 | 9.7 | 2.9 |
| L-Valine | 604 | 9.9 | 2.3 |
| Ethanol Amine | 174 | 11.2 | 2.5 |
| Phosphoric Acid | 299 | 11.3 | 0.4 |
| L-Isoleucine | 158 | 11.9 | 2.5 |
| Succinic Acid | 247 | 12.4 | 4.4 |
| Propionic Acid | 360 | 12.7 | 0.5 |
| L-Serine | 204 | 13.8 | 32.1 |
| Allothreonine | 218 | 14.5 | 6.8 |
| Pipecolic Acid | 175 | 17.0 | 0.1 |
| Malic Acid | 246 | 17.2 | 0.2 |
| Pyroglutamic Acid | 260 | 17.5 | 3.3 |
| L-Aspartic Acid | 232 | 17.7 | 9.8 |
| 4-Aminobutyric Acid | 174 | 17.7 | 3.4 |
| L-Phenylalanine | 218 | 19.8 | 14.5 |
| L-Glutamic Acid | 246 | 20.0 | 31.0 |
| Citric Acid | 217 | 24.6 | 0.4 |
| Isocitric Acid | 319 | 24.6 | 0.3 |
| Xylose | 308 | 25.8 | 2.2 |
| D-Psicose | 219 | 25.8 | 2.1 |
| D-Glucose | 205 | 26.1 | 7.2 |
| Ascorbic Acid | 157 | 26.1 | 2.8 |
| Glyceraldehyde | 319 | 26.3 | 3.0 |
| D-Mannose | 205 | 26.6 | 2.7 |
| Hexadecanoic Acid | 313 | 28.2 | 5.7 |
| D-Galactose | 319 | 30.7 | 6.2 |
| L-Tryptophan | 202 | 31.1 | 158.8 |
| n-Octyl-beta-D-glucoside | 205 | 31.7 | 2.0 |
| Sorbitol-6-Phosphate | 204 | 33.7 | 3.6 |
| Glucose-6-Phosphate | 299 | 33.9 | 9.2 |
| Cellobiose | 204 | 35.9 | 3.0 |
| ISOMALTOSE | 290 | 37.2 | 3.0 |
| Sucrose | 169 | 39.0 | 0.4 |
| Xylulose | 161 | 39.3 | 2.0 |
| Trehalose | 271 | 40.3 | 3.9 |
| 1-Octadecane | 327 | 44.1 | 5.0 |
| Laminaribose | 363 | 46.2 | 65.0 |
Galactose significantly inhibits growth of P. capsici in-vitro
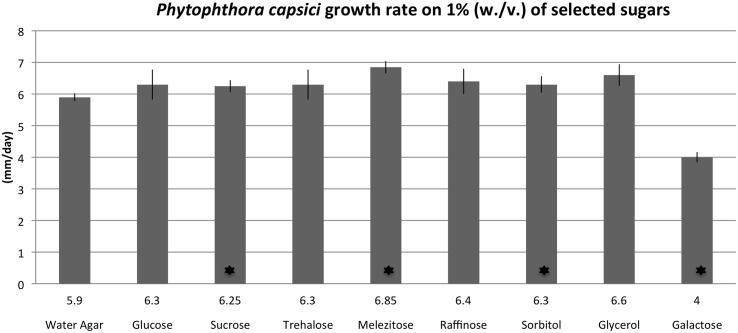
To evaluate the impact of various sugar sources on growth rate, P. capsici was grown on water agar supplemented with 1% (w / v) of selected sugars. Growth rate of P. capsici was approximately 30% slower on 1% galactose compared to water agar (Fig 9). There was a small but significant increase in P. capsici growth rate on 1% sucrose, melezitose, and sorbitol.
Fig 9. Impact of selected carbohydrates on Phytophthora capsici growth rate.
P. capsici colonies were grown on water agar supplemented with 1% (w / v) of listed sugars at 28°C for five days. Average growth (mm / day) rate is listed above each label. * Indicates significant differences in growth rate compared to water agar, α equal to 0.05.
Discussion
This study represents the first evaluation of non-host P. nicotianae as an elicitor of induced resistance in C. annuum. Consistent with previously evaluated chemical and biological elicitors, treatment with BABA and P. nicotianae inhibited subsequent foliar infection by P. capsici in a cultivar independent manner. No macroscopic differences were observed between treated and non-treated plants during initial foliar symptom development. However, systemic progression of P. capsici was halted in more than 50% of treated plants while all untreated plants developed systemic foliar blight resulting in plant death. As the virulent gene-for-gene interaction is unchanged by elicitor treatment, the difference in virulence of P. capsici can be presumed to be associated with enhanced basal defense responses including production of oxidative compounds and initiation of a hypersensitive response.
Metabolite analysis by GC/MS identified significant shifts in metabolite concentrations in plants treated with BABA and P. nicotianae. Changes in metabolite concentrations were more pronounced for plants treated with BABA than for plants treated with P. nicotianae, both in magnitude and in the number of metabolites that changed significantly. Changes in metabolite concentrations induced by BABA is consistent with previous studies in other plant systems where pronounced differences were measured within 24 hours after treatment [8]. Consistent with previous reports, we observe parallel concentration responses for 25 metabolites (of 26 total for which significant concentration change was observed) in plants treated with P. nicotianae and BABA, which indicates a conserved response mechanism for both elicitors [13]. Primed changes were observed in plants treated with P. nicotianae that were subsequently inoculated with P. capsici. As the intracellular localization of metabolites cannot be determined through this analysis, it is difficult to determine their exact biochemical origin within the plant. However, the observed metabolite changes are consistent with primed production of defense compounds and to supply the necessary reducing power to generate reactive oxygen species involved in defense response. In addition, changes in carbohydrate concentrations were previously associated with signal transduction pathways responsible for enhanced immune response to pathogen infection [14].
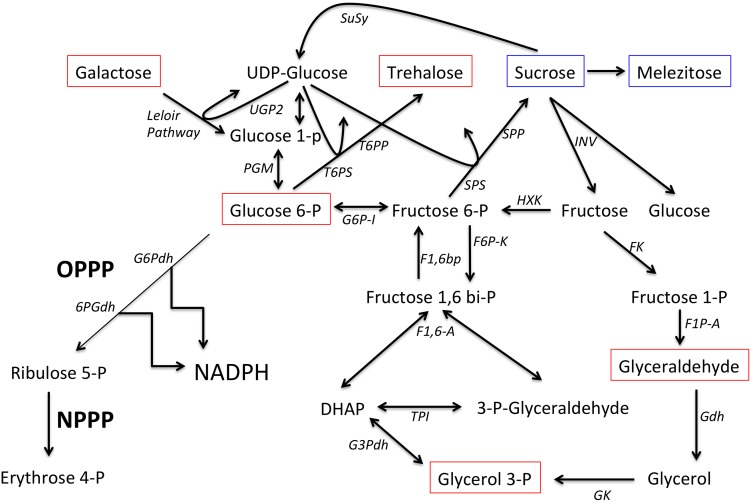
Carbohydrate pools likely provide the carbon source for the production of aromatic amino acids and oxidative compounds via increased flux through the pentose phosphate pathway (PPP) (Fig 10). Glucose-6-phosphate, which increased in induced plants in this study, is the primary precursor for the PPP. The oxidative portion of the PPP is a significant source of NADPH that provides reducing power for the generation of reactive oxygen species through NADPH oxidases. The non-oxidative portion of the PPP generates erythrose 4-phosphate which is the primary precursor to the shikimate pathway for aromatic amino acids. The increased pools of tryptophan and phenylalanine are precursors for defense related antimicrobial and plant signaling compounds such as lignins, alkaloids, chalcones, salicylic acid, and auxins.
Fig 10. Overview of selected carbohydrate pathways.
Metabolites boxed in red were significantly increased in concentration in induced plants while metabolites boxed in blue were significantly decreased. Abbreviations: oxidative pentose phosphate pathway (OPPP), non-oxidative pentose phosphate pathway (NPPP), sucrose synthetase (SuSY), UTP glucose-1-phosphate uridylyltransferase (UGP2), phosphoglucomutase (PGM), trehalose 6-phosphate synthase (T6PS), Trehalose 6- phosphate phosphatase (T6PP), sucrose phosphate synthase (SPS), sucrose phosphate phosphatase (SPP), invertase (INV), glucose 6-phosphate isomerase (G6P-I), hexose kinase (HXK), fructose kinase (FK), fructose 1-phosphate aldolase (F1P-A), glyceraldehyde dehydrogenase (Gdh), fructose 6-phosphate kinase (F6P- K), fructose 1,6 bisphosphatase (F1,6bp), fructose 1,6 bisphosphate aldolase (F1,6- A), triose phosphate isomerase (TPI), glycerol 3-phosphate dehydrogenase (G3Pdh), glycerol kinase (GK), glucose 6-phosphate dehydrogenase (G6Pdh), 6- phosphogluconate dehydrogenase (6PGdh).
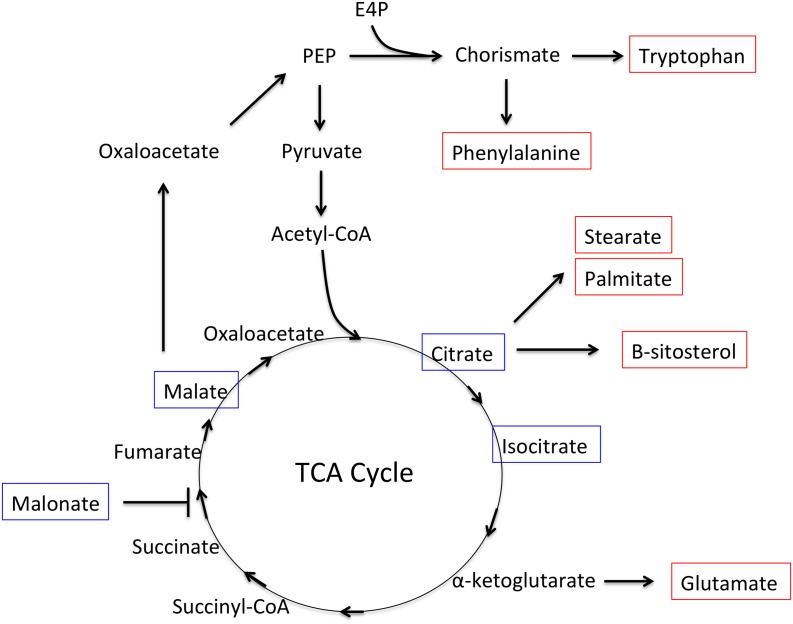
Increased invertase activity, which cleaves sucrose into glucose and fructose, has been reported following pathogen perception in plants [14–15]. This may explain the decrease in sucrose concentration (approximately 1.5-fold decrease) observed in induced plants in this study. However, given that sucrose is the primary transport sugar in plants, it is difficult to interpret changes in concentration without additional labeling studies. Laminaribose, which increased significantly in BABA treated plants, was previously shown to inhibit cell death and browning in potato tubers inoculated with P. infestans ([16]. Increased concentration of the small metabolite glycerol-3-phosphate, is consistent with recent reports that it acts as a signaling molecule during induced resistance in A. thaliana [17–18]. Increased trehalose concentrations observed in induced plants is also consistent with reports that it is involved in stress response signaling and leads to enhanced osmotic protection [19]. Trehalose 6-phosphate, a precursor to trehalose, appears to be an important signaling molecule for embryo development, plant growth and senescence processes, and is linked to alterations in carbohydrate metabolism, amino acid, protein, nucleotide synthesis, the tricarboxylic acid (TCA) cycle and mitochondrial electron transport chain [20–22]. The TCA-cycle intermediates, citrate, isocitrate and malate were all significantly reduced in induced plants as was the TCA cycle inhibitor malonate. In addition, glutamate, stearate, palmitate and β-sitosterol all increased in concentration in induced plants. Together, these observations suggest increased flux through the TCA cycle, with intermediates being drawn off for synthesis of lipids and glutamate (Fig 11).
Fig 11. Overview of TCA cycle and associated biochemical pathways.
Metabolites boxed in red were significantly increased in concentration in induced plants while metabolites boxed in blue were significantly decreased.
Significant change observed in carbohydrate levels with an induced defense response prompted a further study to determine if the presence of these carbohydrates would affect growth of P. capsici. To our knowledge, these data provide the first evidence that the carbohydrate galactose can directly inhibit growth of P. capsici. While it is unknown if the increased concentration of galactose observed in induced plants is sufficient to inhibit growth of P. capsici after infection, several reports indicate that galactose metabolism may play an important role in infection by Phytophthora spp. A late blight resistant hybrid potato line (Solanum phureja X Solanum tuberosum) was shown to differentially overexpress a gene encoding for α-galactosidase upon infection by P. infestans [23]. The α-galactosidase gene, also known as melibiase, cleaves the polysacharide melibiose to produce galactose and glucose. While the role of α-galactosidase in plant resistance is unknown, its over-expression during infection by P. infestans indicates that sugar metabolism is involved in plant-pathogen interactions. In P. sojae, a putative UDP-glucose 4-epimerase open reading frame (ORF) was identified in close proximity to a necrosis inducing protein and was shown to be actively expressed in zoospores and during pathogenesis [24]. Interconversion of UDP-galactose to UDP-glucose by UDP-glucose 4-epimerase is an essential step during galactose catabolism and its expression during early infection indicates that limiting galactose accumulation in Phytophthora spp. may be important for pathogenicity. In Saccharomyces cerevisiae, mutant lines with increased uptake of galactose accumulated galactitol and had a lower maximum growth rate compared to wild type cells [25]. Our results indicate that galactose is an inhibitor of P. capsici under in-vitro growth conditions, and could enable novel strategies for Phytophthora disease control.
Materials and Methods
Phytophthora spp. isolates and growth
Phytophthora capsici strain PWB24 (ATCC MYA-2289) and P. nicotianae isolate NM.T1 (Genbank: HQ711620) were used in this study. Isolates were maintained on clarified V8 agar, amended with Pimaricin (0.2% w./v.), Rifampicin (10 mg/L), and Ampicillin (250 mg/L) (cV8S) at 25°C. For sporangia production, 10 one-cm plugs were transferred from five-day-old colonies to 100 X 20 mm petri plates with 25 mL sterile DI water and incubated under fluorescent light at 25°C for 24 h. Zoospores were induced by incubating plates at 4°C for thirty min and at room temperature for 2–4 hours. Zoospore solutions were filtered through cheesecloth and quantified using a haemocytometer (Hausser Scientific, Horsham, PA).
Pathogenicity Assays
Three C. annuum cultivars (Camelot, NM-64, and Jupiter) were soil drenched with a suspension of 375,000 zoospores of P. nicotianae per plant or a suspension of 10,000 zoospores of P. capsici per plant, and watered daily for two weeks. For foliar inoculation, 100,000 zoospores of P. nicotianae zoospores or mock inoculum (water) were sprayed onto C. annuum foliage and incubated in a humidity chamber at 28°C for 5 days. Eight plants per cultivar were used in each treatment group and the assay was replicated at an independent time point.
Induced Resistance Assays
Capsicum annuum cultivars NM-64, Camelot, and Jupiter were grown in 10 cm pots with metro mix 360 potting soil (Sun Gro Horticulture Canada Ltd, Agawam, MA) under cool-white fluorescent light with a 18 and 6 h light and dark schedule at 28°C and fertilized with Osmicote at the recommended rate (The Scotts Company LLC, Marysville OH). Eight plants from each cultivar were inoculated at 4–6 true leaves for the split-plant assays utilized in the experiments described and the assay was replicated at a separate time point for all cultivars. Plants were soil drenched with 100 mL of a zoospore suspension of P. nicotianae (2,000 zoospores / mL), 2.5 mM BABA, or sterile DI water, and placed in trays with two cm standing water to maintain saturated soil conditions. Forty-eight hours after soil drench, plants were foliar inoculated on three separate leaves with 50 μL of a zoospore suspension of P. capsici (40,000 zoospores / mL) and incubated in a humidity chamber at 28°C for 48 h [26].
Autofluorescence Evaluation
Autofluorescence in leaf tissue was evaluated 48 h after foliar treatment with P. nicotianae or BABA. Leaf discs were removed from the plant and imaged using an M165 FC Stereofluorescence microscope with an integrated CCD color camera system. Autofluoresence was also evaluated in plants that were soil drenched with a zoospore suspension of P. nicotianae or BABA, and foliar inoculated with P. capsici as described above. At 24 h post inoculation, leaf tissue was harvested and imaged directly using a compound fluorescent microscope.
Photosynthesis Measurements
Capsicum annuum plants were soil drenched with a zoospore suspension of P. nicotianae or P. capsici (100,000 zoospores per plant), 2.5 mM BABA or water (six plants per treatment) and photosynthetic rate (μmol CO2 / m2 / s) was measured using a LI 6400 portable photosynthesis system according to manufacture’s instructions (LI-COR Inc. Lincold, NE). At three days post inoculation, three fully expanded leaves from each plant were analyzed using the sensor head with attached light and data were graphed using Microsoft Excel for Mac 2011 with standard deviation shown.
Diaminobenzidine (DAB) staining
Plants were soil treated with a zoospore suspension of P. nicotianae, 2.5 mM BABA, or sterile DI water, and foliar inoculated with P. capsici a zoospore suspension as described above. At 12, 24, and 48 h post inoculation, leaf tissue was removed and immediately immersed in DAB solution (1 mg/mL) in 10 mM sodium phosphate buffer with Tween 20 (0.05% v/v) in a covered dish on a rocker platform at room temperature. After 4 h the DAB staining solution was replaced with bleaching solution (ethanol:acetic acid:glycerol 3:1:1) and boiled for 10 min to remove plant pigments [27]. Tissue was imaged using a compound microscope with a digital camera mounted using an eyepiece adapter (Nikon, Melville, NY).
Metabolite analysis of C. annuum tissue
Capsicum annuum (var. Jupiter) seedlings with one true set of leaves were treated with P. nicotianae, BABA, or water (mock treatment), and after 48 h they were challenged with P. capsici (+) or mock inoculated with water (-) for a total of 6 treatments. Leaf tissue was harvested from plants in all treatments at 96 h following initiation of each treatment. A random block design was implemented with four blocks per treatment, each composed of 15 seedlings growing in sterile vermiculite under cool white fluorescent light at 28°C. Leaf tissue for the 15 seedlings in each block was harvested into a single container and immediately flash frozen in liquid nitrogen. Primary metabolites were extracted and analyzed by GC/MS according to previously described protocol with ~6.0 mg of lyophilized plant tissue [28]. All of the samples were analyzed using a Hewlett Packard 5890 GC with a 5972A mass selective detector. Polar samples were injected at a 15:1 split ratio and non-polar samples were injected at a 1:1 split ratio; the inlet and transfer line were held at 280°C. Separation occurred with an oven temperature program of 80°C held for 2 min then ramped 5°C per min to 315°C and held for 12 min for a total run time of 64 min. A 30 meter RTX-5 column (Restek, 0.25 mm ID, 0.25um film thickness) was used with a constant flow of 1.0 mL per minute. All GC data files were grouped by polarity and exported from the Automated Mass Spectral Deconvolution and Identification System (AMDIS). Next, polar and non-polar component data were aligned with Metabolomics Ion-based Data Extraction Algorithm (MET-IDEA). Component signals were aligned across all samples for comparative analysis and abundance data were normalized to tissue weight and relative concentration of spiked internal standards. Mass spectral matching was performed with the Samuel Roberts Noble Foundation metabolite library [28]. MetaboAnalyst 2.0 was used to for multivariate and univariate statistical analyses [29]. Data were log transformed then mean-centered and divided by the standard deviation of each variable to highlight relative changes in metabolite profiles across treatments. Data were analyzed by a Fisher’s LSD post-hoc analysis of variance (ANOVA) with α equal to 0.05 and a principle components analysis with 95% confidence threshold. Dendrograms were constructed using the Spearman distance measure and Ward clustering algorithm.
Evaluation of selected carbohydrates on growth rate of P. capsici
Carbohydrate plates were prepared by autoclaving 12 g agar per L and 1% (w.v.) glucose, sucrose, melezitose, galactose, trehalose, raffinose, sorbitol, or glycerol with 10 mL of media poured in each plate. A single two mm plug from the edge of a P. capsici colony growing on water agar, was transferred to each plate with four replicates of each sugar. Plates were sealed with parafilm and incubated at 28°C for 5 days. The experiment was repeated with independently prepared plates at a separate time point and two measurements were taken for the diameter of each colony. Data were analyzed by a student’s t test with α equal to 0.05 to determine significant differences in growth rate on selected sugars compared to water agar and graphed using Microsoft Excel for Mac 2011.
Supporting Information
Data were normalized to tissue weight and relative concentration of spiked internal standards and were then log transformed, mean-centered and divided by the standard deviation of each variable to highlight relative changes in metabolite profiles across treatments.
(XLSX)
Acknowledgments
The authors would like to thank Dr. Lloyd W. Sumner for generously providing the Samuel Roberts Noble Foundation metabolite library and the New Mexico State Agricultural Experimental Station, the NMSU Center for Animal Health and Food Safety and the New Mexico Chile Association for research funding.
Data Availability
All relevant data are within the paper and its Supporting Information files.
Funding Statement
This work was partially funded through the New Mexico Chile Association. There are no patents, products in development or marketed products to declare. This does not alter the authors' adherence to all the PLoS ONE policies on sharing data and materials.
References
- 1. Sanogo S, Ji P. Integrated management of Phytophthora capsici on solanaceous and cucurbitaceous crops: current status, gaps in knowledge and research needs. Can. J. Plant Pathol. 2012;34: 479–492. [Google Scholar]
- 2. Xie J, Cardenas ES, Sammis TW, Wall MM, Lindsey DL, Murray LW. Effects of irrigation method on chile pepper yield and Phytophthora root rot incidence. Agricultural water management. 1999;42: 127–142. [Google Scholar]
- 3. Lamour KH, Mudge J, Gobena D, Hurtado-Gonzales OP, Schmutz J, Kuo A, et al. Genome sequencing and mapping reveal loss of heterozygosity as a mechanism for rapid adaptation in the vegetable pathogen Phytophthora capsici. Mol. Plant Microbe Interact. 2012;25: 1350–1360. 10.1094/MPMI-02-12-0028-R [DOI] [PMC free article] [PubMed] [Google Scholar]
- 4. Lee SC, Hwang BK. Induction of some defense-related genes and oxidative burst is required for the establishment of systemic acquired resistance in Capsicum annuum. Planta. 2005;221: 790–800. [DOI] [PubMed] [Google Scholar]
- 5. Diaz J, Silvar C, Varela MM, Bernal A, Merino F. Fusarium confers protection against several mycelial pathogens of pepper plants. Plant pathology. 2005;54: 773–780. [Google Scholar]
- 6. Jakab G, Cottier V, Toquin V, Rigoli G, Zimmerli L, Métraux JP, Mauch-Mani B. β-Aminobutyric acid-induced resistance in plants. Eur. J. Plant Pathol. 2001;107: 29–37. [Google Scholar]
- 7. Ton J, Mauch-Mani B. β-amino-butyric acid-induced resistance against necrotrophic pathogens is based on ABA-dependent priming for callose. The Plant Journal. 2004;38: 119–130. [DOI] [PubMed] [Google Scholar]
- 8. Pastor V, Blamer A, Gamir J, Flors V, Mauch-Mani B. Preparing to fight back: generation and storage of priming compounds. Front Plant Sci. 2014;5: 1–12. [DOI] [PMC free article] [PubMed] [Google Scholar]
- 9. Andrés JL, Rivera A, Fernández J. Phytophthora nicotianae pathogenic to pepper in northwest Spain. Journal of Plant Pathology. 2003;85: 91–98. [Google Scholar]
- 10. Andrés JL, Rivera AR, Fernández J. Virulence of Spanish Phytophthora nicotianae isolates towards Capsicum annuum germplasm and pathogenicity towards Lycopersicum esculentum. Span. J. Agric. Res. 2014;4: 248–254. [Google Scholar]
- 11. French JM, Stamler RA, Randall JJ, Goldberg NP. First report of Phytophthora nicotianae on bulb onion in the United States. Plant Dis. 2011;95: 1028. [DOI] [PubMed] [Google Scholar]
- 12. French JM, Stamler RA, Randall JJ, Goldberg NP. First report of Buckeye Rot caused by Phytophthora nicotianae in tomato in New Mexico. Plant Dis. 2011;95: 1028. [DOI] [PubMed] [Google Scholar]
- 13. Voll LM, Horst RJ, Voitsik AM, Zajic D, Samans B, Pons-Kühnemann J. Common motifs in the response of cereal primary metabolism to fungal pathogens are not based on similar transcriptional reprogramming. Front Plant Sci. 2011;2: 39 10.3389/fpls.2011.00039 [DOI] [PMC free article] [PubMed] [Google Scholar]
- 14. Essmann J, Schmitz-Thom I, Schön H, Sonnewald S, Weis E, Scharte J. RNA interference-mediated repression of cell wall invertase impairs defense in source leaves of tobacco. Plant physiology. 2008;147: 1288–1299. 10.1104/pp.108.121418 [DOI] [PMC free article] [PubMed] [Google Scholar]
- 15. Fotopoulos V, Gilbert MJ, Pittman JK, Marvier AC, Buchanan A. J, Sauer N, et al. The monosaccharide transporter gene, AtSTP4, and the cell-wall invertase, Atβfruct1, are induced in Arabidopsis during infection with the fungal biotroph Erysiphe cichoracearum. Plant Physiology. 2003;132: 821–829. [DOI] [PMC free article] [PubMed] [Google Scholar]
- 16. Marcan H, Jarvis MC, Friend J. Effect of methyl glycosides and oligosaccharides on cell death and browning of potato tuber discs induced by mycelial components of Phytophthora infestans. Physiol Plant Pathol. 1979;14: 1–9. [Google Scholar]
- 17. Chanda B, Venugopal SC, Kulshrestha S, Navarre DA, Downie B, Vaillancourt L. et al. Glycerol-3-phosphate levels are associated with basal resistance to the hemibiotrophic fungus Colletotrichum higginsianum in Arabidopsis. Plant physiology. 2008;147: 2017–2029. 10.1104/pp.108.121335 [DOI] [PMC free article] [PubMed] [Google Scholar]
- 18. Chanda B, Xia Y, Mandal MK, Yu K, Sekine KT, Gao QM, et al. Glycerol-3-phosphate is a critical mobile inducer of systemic immunity in plants. Nat. Genet. 2011;43: 421–427. 10.1038/ng.798 [DOI] [PubMed] [Google Scholar]
- 19. Garg AK, Kim JK, Owens TG, Ranwala AP, Do Choi Y, Kochian LV, Wu RJ. Trehalose accumulation in rice plants confers high tolerance levels to different abiotic stresses. Proc. Natl. Acad. Sci. U.S.A. 2002;99: 15898–15903. [DOI] [PMC free article] [PubMed] [Google Scholar]
- 20. Martins MCM, Hejazi M, Fettke J, Steup M, Feil R, Krause U, et al. Feedback inhibition of starch degradation in Arabidopsis leaves mediated by trehalose 6-phosphate. Plant physiology. 2013;163: 1142–1163. 10.1104/pp.113.226787 [DOI] [PMC free article] [PubMed] [Google Scholar]
- 21. Zhang Y, Primavesi LF, Jhurreea D, Andralojc PJ, Mitchell RA, Powers SJ, Paul MJ. Inhibition of SNF1-related protein kinase1 activity and regulation of metabolic pathways by trehalose-6-phosphate. Plant Physiology. 2009;149: 1860–1871. 10.1104/pp.108.133934 [DOI] [PMC free article] [PubMed] [Google Scholar]
- 22. Lunn J, Feil R, Hendriks J, Gibon Y, Morcuende R, Osuna D, et al. Sugar-induced increases in trehalose 6-phosphate are correlated with redox activation of ADPglucose pyrophosphorylase and higher rates of starch synthesis in Arabidopsis thaliana . Biochem. J. 2006;397: 139–148. [DOI] [PMC free article] [PubMed] [Google Scholar]
- 23. Evers D, Ghislain M, Hoffmann L, Hausman JF, Dommes J. A late blight resistant potato plant overexpresses a gene coding for α-galactosidase upon infection by Phytophthora infestans . Biol. Plant. 2006;50: 265–271. [Google Scholar]
- 24. Qutob D, Kamoun S, Gijzen M. Expression of a Phytophthora sojae necrosis-inducing protein occurs during transition from biotrophy to necrotrophy. The Plant Journal. 2002;32: 361–373. [DOI] [PubMed] [Google Scholar]
- 25. de Jongh WA, Bro C, Ostergaard S, Regenberg B, Olsson L, Nielsen J. The roles of galactitol, galactose-1-phosphate, and phosphoglucomutase in galactose-induced toxicity in Saccharomyces cerevisiae . Biotechnology and bioengineering. 2008;101: 317–326. 10.1002/bit.21890 [DOI] [PubMed] [Google Scholar]
- 26. Monroy-Barbosa A, Bosland PW. A rapid technique for multiple-race disease screening of Phytophthora foliar blight on single Capsicum annuum L. plants. HortScience. 2010;45: 1563–1566. [Google Scholar]
- 27. Thordal-Christensen H, Zhang Z, Wei Y, Collinge DB. Subcellular localization of H2O2 in plants. H2O2 accumulation in papillae and hypersensitive response during the barley—powdery mildew interaction. The Plant Journal. 1997;11: 1187–1194. [Google Scholar]
- 28. Broeckling CD, Huhman DV, Farag MA, Smith JT, May GD, Mendes P, et al. Metabolic profiling of Medicago truncatula cell cultures reveals the effects of biotic and abiotic elicitors on metabolism. J. Exp. Bot. 2005;56: 323–336. [DOI] [PubMed] [Google Scholar]
- 29. Xia J, Mandal R, Sinelnikov IV, Broadhurst D, Wishart DS. MetaboAnalyst 2.0—a comprehensive server for metabolomic data analysis. Nucleic Acids Res. 2012;40: W127–W133. 10.1093/nar/gks374 [DOI] [PMC free article] [PubMed] [Google Scholar]
Associated Data
This section collects any data citations, data availability statements, or supplementary materials included in this article.
Supplementary Materials
Data were normalized to tissue weight and relative concentration of spiked internal standards and were then log transformed, mean-centered and divided by the standard deviation of each variable to highlight relative changes in metabolite profiles across treatments.
(XLSX)
Data Availability Statement
All relevant data are within the paper and its Supporting Information files.


