

Abstract
Functionally constrained genes are ideal insecticide targets because disruption is often fatal, and resistance mutations are typically costly. Synaptic acetylcholinesterase (AChE) is an essential neurotransmission enzyme targeted by insecticides used increasingly in malaria control. In Anopheles and Culex mosquitoes, a glycine–serine substitution at codon 119 of the Ace-1 gene confers both resistance and fitness costs, especially for 119S/S homozygotes. G119S in Anopheles gambiae from Accra (Ghana) is strongly associated with resistance, and, despite expectations of cost, resistant 119S alleles are increasing significantly in frequency. Sequencing of Accra females detected only a single Ace-1 119S haplotype, whereas 119G diversity was high overall but very low at non-synonymous sites, evidence of strong purifying selection driven by functional constraint. Flanking microsatellites showed reduced diversity, elevated linkage disequilibrium and high differentiation of 119S, relative to 119G homozygotes across up to two megabases of the genome. Yet these signals of selection were inconsistent and sometimes weak tens of kilobases from Ace-1. This unexpected finding is attributable to apparently ubiquitous amplification of 119S alleles as part of a large copy number variant (CNV) far exceeding the size of the Ace-1 gene, whereas 119G alleles were unduplicated. Ace-1 CNV was detectable in archived samples collected when the 119S allele was rare in Ghana. Multicopy amplification of resistant alleles has not been observed previously and is likely to underpin the recent increase in 119S frequency. The large CNV compromised localization of the strong selective sweep around Ace-1, emphasizing the need to integrate CNV analysis into genome scans for selection.
Keywords: Ace-1 G119S, Acetylcholinesterase, gene duplication, malaria mosquito, purifying selection
Introduction
Detection of the genomic signals created by selective sweeps is a major goal of applied evolutionary studies aiming to discover variants associated with medically relevant phenotypes (Nair et al. 2003; Hedrick 2013; Karlsson et al. 2014). Yet this objective may be challenging in large populations because of their inherent capacity to generate and harbour mutations (Barton 2010; Karasov et al. 2010). This increases the likelihood of adaptation from standing genetic variation, leaving much weaker ‘soft sweep’ genomic signatures of selection than classical ‘hard sweeps’ from de novo mutation (Messer & Petrov 2013). Though less well investigated, signals of selection may be further obscured by structural complexities of genomes, such as (eu- vs. hetero-) chromatin variation leading to highly variable background recombination rates, polymorphic inversions and copy number variants (CNVs).
Mosquitoes typically exhibit many features that could create difficulties for the detection of selective sweeps in their genomes, including the following: large census and effective population sizes (Lehmann et al. 1998; Touré et al. 1998); extremely high genetic diversity and associated lack of linkage disequilibrium (LD) (Wilding et al. 2009; Neafsey et al. 2010; Weetman et al. 2010); many polymorphic paracentric inversions (Coluzzi et al. 2002; Pombi et al. 2008); and chromatin-type-linked recombination rate variation spanning orders of magnitude within the same chromosome (Pombi et al. 2006). The prevalence and general importance of CNVs in mosquito genomes remains to be quantified. Recent work on Drosophila spp. (Rogers et al. 2014) suggests that CNVs may regularly fuel de novo adaptation, and their evolutionary significance in mosquitoes might well be underappreciated.
In this study, we focus on the magnitude and nature of genomic signals of selection within and around the Ace-1 gene, which encodes synaptic AChE in mosquitoes. Acetylcholinesterase hydrolyses the neurotransmitter acetylcholine to terminate nerve signal transmission in synapses and is one of only two target sites for the major chemical insecticide classes currently available for malaria vector control. Carbamate and organophosphate insecticides both bind to and inhibit AChE, which results in accumulation of acetylcholine in the nerve synapse, leading to paralysis and eventual death of the insect. Owing to widespread resistance to DDT and pyrethroids in the major Anopheles malaria vectors (Ranson et al. 2011), carbamates and organophosphates are being used increasingly for vector control across sub-Saharan Africa (Sharp et al. 2007; Akogbéto et al. 2010; Kigozi et al. 2012). Whether this increased use for vector control is selecting for enhanced resistance is unclear, but in general, Ace-1 variants associated with resistance are expected to be primarily selected by exposure to insecticides, which have only been available for a maximum of 60 years. Only three amino acid substitutions in Ace-1 have been associated with insecticide resistance in mosquitoes (Alout & Weill 2008), and only one of these, G119S (using Torpedo californica codon nomenclature), has been found in Anopheles. In A. gambiae and its sibling species Anopheles coluzzii (formerly known as the A. gambiae s.s. S and M molecular forms), resistance to carbamates and organophosphates conferred by Ace-1 119S is currently restricted to West Africa (Ahoua Alou et al. 2010; Essandoh et al. 2013). G119S is located close to the catalytic site of AChE, and 119S-bearing AChE has very similar biochemical properties in Culex and Anopheles (Alout & Weill 2008). This suggests that not only will 119S-generated resistance profiles to carbamate and organophosphate be similar in each species (Alout et al. 2008), but also that the multiple deleterious effects of 119S documented in Culex spp. (especially for homozygotes) will also apply in Anopheles (Djogbénou et al. 2010).
Partial sequencing of Ace-1 has detected only a single haplotypic background for the 119S allele in both A. gambiae and A. coluzzii, consistent with a single origin (Djogbénou et al. 2008b; Essandoh et al. 2013), possible introgression between the species and subsequent spread via a hard selective sweep. However, mutational options within functionally critical, evolutionarily conserved genes such as Ace-1 are likely to be limited (Weill et al. 2003; Oakeshott et al. 2005; Remnant et al. 2013), which might lead to conflation or confusion of the reduced diversity expected from purifying and directional selection, and possible overestimation of the latter. Duplication of Ace genes is well known in agricultural pests (Bass & Field 2011) and, in the best understood example of a CNV of contemporary importance in mosquitoes, Ace-1 duplicants are positively selected in insecticide-exposed field populations of Culex pipiens (Labbé et al. 2007b). Here, creation of a permanent ‘heterozygote’ from phased pairing of 119G and 119S alleles (Labbé et al. 2007a) compensates for the compromised neurophysiological performance of 119S in the absence of insecticide (Alout et al. 2008). Ace-1 duplication has also been found in both A. gambiae and A. coluzzii (Djogbénou et al. 2008a; Essandoh et al. 2013) and, as in C. pipiens, only in G119S heterozygotes. In a multiple-insecticide resistant population of A. coluzzii from Côte d'Ivoire in which almost all individuals type as G119S heterozygotes and 119S/S homozygotes are never found (Ahoua Alou et al. 2010; Edi et al. 2012), possession of duplicated resistant alleles is very strongly associated with survival following carbamate exposure in bioassays (Edi et al. 2014).
In contrast to the most important mutation (Vgsc ‘kdr’ 1014F) in the only other major insecticide target site, the voltage-gated sodium channel (VGSC), for which a very strong signature of a hard selective sweep has been detected in field populations (Lynd et al. 2010), the extent of selection on Ace-1 mutation in Anopheles natural populations is unknown. Even with increasing use of Ace-1-targeting insecticides, the net outcome of selection on Ace-1 in the field is difficult to predict because of the expectation of strong fitness costs for the resistant serine allele. Here, we apply comparative sequencing, genotyping and qPCR to A. gambiae samples, chosen for homozygosity at the G119S position to facilitate detection of genomic differentiation, from a location of high-prevalence carbamate and organophosphate resistance in southern Ghana. Specifically, we aimed to investigate the following: (i) whether there is significant genomic evidence of selection, and its nature, within and around the Ace-1 gene; (ii) how temporal variation in 119S frequency might correspond with signatures of selection; (iii) whether a simple hard selective sweep model could explain any detectable signals of selection.
Materials and methods
Samples and diagnostic SNP genotyping
Mosquito larval collections were performed using the standard dipping method in May 2008 from Dzorwulu, Madina, Labadi and Roman Ridge, suburban locales of Accra (5.55°N, 0.20°W) in southern Ghana, and in May 2010 from Madina. Larvae were reared at the Biotechnology and Nuclear Agriculture Research Institute, Accra. Pupae were picked daily and placed into plastic cages. Emergent A. gambiae s.l. females were maintained on 10% sugar solution until 3–5 days posteclosion when insecticide bioassays were performed. Mosquitoes were exposed to 0.1% bendiocarb for one hour following the WHO tube assay protocol (WHO 2013). Mortality was assessed 24 h after the end of the exposure period, and mosquitoes were preserved individually over silica gel. Collections of additional female specimens from 2002 (several locations within the Greater Accra district), 2007 (Madina) and 2011 (Madina) followed similar protocols, and the collection sites are detailed elsewhere (Yawson et al. 2004; Lynd et al. 2010; Essandoh et al. 2013).
DNA was extracted using a DNEasy Blood & Tissue kit (Qiagen). Two standard methods were employed for molecular species identification of the morphologically identical species within the A. gambiae s.l. complex. The first involves PCR amplification of IGS rDNA towards the centromere of the X chromosome using a cocktail of A. gambiae complex species-specific primers, followed by restriction digest of products and visual diagnosis of species-diagnostic fragments on agarose gel (Fanello et al. 2002). The second, which exploits a species-specific SINE insertion polymorphism to generate diagnostic fragments of different size (Santolamazza et al. 2008), discriminates among fewer species in the complex but is particularly reliable for distinguishing between the sibling species pair A. gambiae and A. coluzzii. Both methods provided entirely congruent results. All samples were further characterized for their genotype at the Ace-1 G119S polymorphism using a standard TaqMan quantitative PCR assay (Bass et al. 2010).
Ace-1 gene sequencing and analysis
Twenty-five female A. gambiae from the 2008 collection that were homozygous for the Ace-1 G119S polymorphism were chosen for sequencing of a region of the Ace-1 gene (VectorBase gene ID: AGAP001356). Eleven individuals were wild-type (119G) homozygotes, and 14 were resistant (119S) homozygotes. We used an existing published protocol (Djogbénou et al. 2008b) for initial amplification of a fragment including the 119 codon using the primers AgEx2dir1 (5′-AGGTCACGGTGAGTCCGTACGA-3′) and AgEx4rev2 (5′-AGGGCGGACAGCAGATGCAGCGA-3′). PCRs contained 2.5 μL of 10× Bioline buffer, 0.2 μm of each dNTP, 0.2 μm of each primer, 0.75 U BioTaq (Bioline), 1 μL genomic DNA template and water to a total volume of 25 μL. PCR conditions were as follows: 94°C for 3 min, followed by 35 cycles of 94 °C for 30 s, 56 °C for 30 s and 72 °C for 60 s, with a final extension at 72 °C for 5 min. Products were cleaned using QIAquick PCR Purification kits and sent to Macrogen (Korea) for bidirectional sequencing using the same primers as for product amplification. Additional primers (Ace1_5F: 5′-GATCGGAGAACAGGCATCAT-3′ and Ace1_5R: 5′-CCACTTCCAATCGCGTACTT-3′; Ace1_3F: 5′-AGGTGCTCTTCTTCCCATCA-3′ and Ace1_3R: 5′-CTCGGTCCAGTCGGTGTACT-3′) were designed to provide a total of approximately 2000 bp of sequence around the 119 codon in 5′ and 3′ directions. PCR amplicons were generated using the same conditions as above, except for the addition of 0.5 μL 50 mm MgCl2 to the reaction mixture and the use of a slightly higher annealing temperature (57 °C). The additional amplicons were cleaned and sequenced as before. If intronic indels resulted in poor quality direct sequence data, or where it was impossible to computationally phase the data due to high sequence polymorphism (Stephens et al. 2001), PCR amplicons were cloned using a pGEM T-Easy Vector (Promega), according to the manufacturer's instructions, and then sequenced as before. Contigs were aligned and edited in CodonCode aligner v4 (CodonCode Corporation) and annotated in DnaSP v5 (Librado & Rozas 2009).
Ace-1 sequence analysis
Extended haplotype homozygosity (EHH) analysis (Sabeti et al. 2002) was carried out to assess the patterns of linkage disequilibrium associated with wild-type (119G) and resistant (119S) alleles. As in a previous study of linkage disequilibrium (LD) decay around the Vgsc 1014F kdr mutation (Lynd et al. 2010), we defined the core of the haplotypes as the non-synonymous mutation at codon 119 and then examined the decay in LD in both telomeric and centromeric directions in both wild-type and resistant haplotypes. Identification of polymorphic sites within the data sets and subsequent EHH analysis was conducted using programs written in R (R Development Core Team 2014). Significant differences in EHH values were determined via non-overlapping 95% confidence intervals (CI), calculated at each SNP position using a bootstrapping procedure, with 1000 resamples. An illustrative bifurcation plot was produced in SWEEP v2.1.1 (Sabeti et al. 2002). To investigate evidence for purifying selection acting on the Ace-1 locus, the sequence haplotypes bearing the wild-type 119G variant were subject to Tajima's D and Fu and Li's D and F tests in DnaSP v5 (Librado & Rozas 2009). Haplotype trees were constructed separately for non-synonymous and synonymous mutations using the statistical parsimony algorithm in TCS 1.21 (Clement et al. 2000).
Modelling the impact of non-synonymous substitutions on AChE function
In silico modelling was used to investigate whether non-synonymous changes (other than G119S) observed in the sequenced haplotypes might impact on the catalytic capacity of the AChE enzyme and its ability to withstand carbamate inhibition. A molecular model of A. gambiae AChE was constructed with the aid of the HHpred server (Söding et al. 2005) using the well-characterized enzyme from Torpedo californica (Colletier et al. 2006) as a single top-scoring template. The target and template sequences share 48% sequence identity that, along with the existence of only six short (1–3 residue) indels, ensures a reliable model in the catalytic domain. N- and C-terminal extensions in the insect target sequence of around 160 and 40 residues, respectively, did not align with the template and so could not be modelled. Using PyMOL (https://www.pymol.org), the position of each observed amino acid change was visualized relative to the catalytic and accessory substrate binding sites (Colletier et al. 2006). The local structural context derived from the model was used to predict any likely impact on protein structure of the mutations. An alignment of orthologous insect AChE enzymes, made with MAFFT (Katoh & Standley 2013), applied to homologues obtained from the HHpred server, was used to determine residue conservation and whether the allele residues were seen at corresponding positions in other AChE enzymes.
Microsatellite screening around Ace-1 to define the extent of the hitchhiked region
Microsatellites were identified in a region of 2 Mb either side of the Ace-1 locus from the A. gambiae PEST AGAMP3 genome assembly (Holt et al. 2002) using SciRoKo (Kofler et al. 2007). Twenty-four di- and tri-nucleotide loci, approximately symmetrically distributed about the Ace-1 G119S position, and at progressively increasing distances between neighbouring loci (further from Ace-1), were selected for screening. All exhibited a minimum of eight uninterrupted repeats in the PEST genome. Primers were designed to amplify products 100–300 bp using Primer3 (Koressaar & Remm 2007; Untergasser et al. 2012) (Table S1, Supporting information). Loci were amplified individually using 2.5 μL of 10× Kapa Taq buffer (Kapa Biosystems), 0.2 μm of each dNTP, 0.2 μm of each primer, 1 U KapaTaq, 2.5 μL 2 mm MgCl2, 1 μL genomic DNA template and water to a total volume of 25 μL. PCR conditions were as follows: 95°C for 3 min, followed by 30 cycles of 95 °C for 30 s, n °C for 30 s (see Table S1, Supporting information, for locus-specific values of n) and 72 °C for 30 s, with a final extension at 72 °C for 5 min and then pooled in subsets of four or five (differentiated by product size) for genotyping on a CEQ 8000 capillary sequencer (Beckman-Coulter), with cy5 or cy5.5 5′-labelled forward primers and a 400-bp-size ladder (Beckman-Coulter). All samples with Ace-1 sequence data were genotyped at the microsatellite loci along with a further 45 A. gambiae homozygotes (119S/119S or 119G/119G) from the same sample collection. Samples were randomized on plates for genotyping, and any failed microsatellite PCR was repeated at least once. All microsatellite scoring of automatically sized alleles was performed by a single experienced operative.
Microsatellite data analysis
Micro-Checker 2.2.3 (Van Oosterhout et al. 2004) was used to examine genotype data for null alleles and possible scoring errors arising from PCR dropout of large alleles and mis-scoring of stutter peaks as alleles (or vice versa). Where identified, scores were rechecked and specific samples regenotyped as necessary to help clarify scoring. Standard population genetic metrics: F-statistics, heterozygosity and tests for (genotypic) population differentiation were calculated using FSTAT 2.9.1 (Goudet 1995). FST was adjusted for downward bias arising from locus heterozygosity (Hedrick 2005), and expressed as FST’, using RecodeData v 0.1 (Meirmans 2006). Tests for Hardy–Weinberg and linkage equilibrium were performed using GENEPOP 4.2 with default settings (Rousset 2008). All final-call microsatellite genotyping scores are provided in file Data S1 (Supplementary data set).
To check scoring of a specific microsatellite locus ‘Ace-5k’ (within an intron of the Ace-1 gene), we sequenced several 119G/G and 119S/S samples. Amplification of a 547-bp fragment proceeded using reaction mixtures contained 2.5 μL of 10× Fermentas Dream buffer, 0.2 μm of each dNTP, 0.2 μm of each primer (min5ace_bF: 5′-GCATCGCGGGAAACATTTTG-3′; min5ace_bR: 5′-CGCTTTGCAGTGTTGTCCTT-3′), 0.5 U Fermentas Dream Taq, 1 μL genomic DNA template and water to a total volume of 25 μL. PCR conditions were as follows: 94 °C for 3 min, followed by 35 cycles of 94 °C for 30 s, 54 °C for 30 s and 72 °C for 30 s, with a final extension at 72 °C for 5 min. Products were cleaned using a QIAquick PCR Purification kit and sent to Macrogen (Korea) for bidirectional sequencing using the same primers as for product amplification.
Inference of a selective sweep from patterns of diversity across microsatellites
For a population at mutation–drift equilibrium, the expected heterozygosity (HE) at a microsatellite locus can be used to estimate the parameter θ = 4Neμ, where Ne is the effective population size and μ is the mutation rate. By comparing locus-specific estimates of θ between populations, or in this instance, groups defined by their genotypes at the Ace-1 codon, it is possible to perform a diversity-based outlier analysis to identify loci which may have been subject to selection (Harr et al. 2002). The ratio of θ estimates is calculated from the ratio of expected heterozygosity (HR/HS, where HR here is heterozygosity in 119S/119S individuals and HS is heterozygosity in 119G/119G individuals). When natural log-transformed HR/HS conforms to a normal distribution over a range of demographic scenarios (Schlötterer 2002), therefore, the normal probability density function can be used to ascribe significance to estimates for each locus (Harr et al. 2002). Unbiased estimates of heterozygosity with bootstrapped 95% CI for the ln(HR/HS) statistics were calculated using scripts written in R (R Development Core Team 2014). The specimens sequenced were all collected in May 2008 from Accra but encompassed several local suburbs. In case grouping of spatial samples impacted diversity estimates, the analysis was repeated upon a subset of approximately 40% of the specimens from a single suburb, Dzorwulu.
We modelled whether the pattern of reduced variability around the Ace-1 locus was concordant with our estimate of selection derived from temporal series data (2007, 2008, 2010 and 2011 samples). We used the approach described for studies of pyrimethamine resistance in Plasmodium falciparum (Nair et al. 2003). The expected reduction in heterozygosity in Ace-1 119S homozygotes E(HR) was inferred based on the observed heterozygosity at each locus in wild-type susceptible Ace-1 119G homozygotes (HS) using the following equation (Wiehe 1998; Nair et al. 2003):
A broad-scale chromosome arm 2R-specific recombination rate (r’) of 1.33 cm/Mb was calculated from published mapping data (Zheng et al. 1996) (Fig. S1, Supporting information). An estimate of the selection coefficient (s) was obtained from the temporal G119S frequency data using a simple codominant model of bi-allelic selection in the software populus, with predictions from a linear regression used to provide initial and test values. The value of s (to three decimal places) best approximating the data was determined as that minimizing a chi-square goodness-of-fit statistic in comparisons of test values to simulations. A species-specific microsatellite mutation rate estimate of μ = 3.4 × 10⁻⁵ was used (Lehmann et al. 1998).
To determine the fit of observed HR values to the E(HR) predictions at individual loci, we applied an outlier analysis based on the absolute difference between the predicted value for each locus and, to allow for observational uncertainty, the appropriate confidence limit (i.e. whichever is closer to prediction) of the observed data. Outlier analyses proceeded by calculating the median of the absolute deviation of these abs(CI obs − exp) values from their median, and multiplying by a constant (b = 1.4826) representing the normal distribution to yield a median absolute deviation metric (MAD) (Leys et al. 2013). Outliers were considered as data points whose value was more extreme than 3× MAD, which represents a conservative threshold (Leys et al. 2013).
Ace-1 copy number variation screening
All microsatellite-screened A. gambiae were also subject to a quantitative PCR diagnostic to identify and quantify Ace-1 genomic copy number variation (Edi et al. 2014). In brief, three fragments from different exons of the Ace-1 gene are amplified and normalized to two single copy genes (Cyp4g16 and elongation factor Tu). Copy number of Ace-1 was estimated relative to two pools of gDNA from females of the standard multi-insecticide susceptible Kisumu laboratory strain (established in 1975) using the ΔΔCT method (Schmittgen & Livak 2008). Pools provide equivalent estimates to single individuals and were used simply to provide a longer-lasting source of reference DNA. Copy number estimates are represented as mean ΔΔCT with standard deviations to indicate ΔΔCT variability across the three Ace-1 fragments. To ensure cross-comparability of estimates from the 2008 and 2002 samples (performed in separate batches), we included Ace-1 119 G/G and 119 S/S homozygotes that served as controls for unduplicated and duplicated genotypes, respectively. Consistency of the three ΔΔCT estimates was assessed from their standard deviation, which were investigated for outliers using the same MAD method as described above. Two outlying samples were identified as having exceptionally high standard deviations and removed from the 2008 sample data set; no outliers were present in the 2002 data (Data S1, Supplementary data set). Tests for differences in mean estimates between sample groups were performed using either homoscedastic or heteroscedastic two-tailed t-tests depending on the result of Levene's F-test for homogeneity of variances. Spearman rank correlations, Levene's test, t-tests and Wilcoxon signed-rank tests were conducted in SPSS v20.
Results
Ace-1 sequence analysis
Sequences were analysed from A. gambiae individuals collected in 2008 from Madina and other suburbs of Accra. A total of 124 SNPs, and a number of indels in intronic regions, were identified in 2031 bp of sequence from within Ace-1. Consistent with a strong, allele-specific selective sweep, the (resistant) 119S mutation occurred on a single haplotypic background, whereas extended haplotype homozygosity (EHH) decayed very rapidly in both telomeric and centromeric directions for 119G (i.e. wild type, susceptible) haplotypes (Fig.1), all of which required cloning and sequencing for resolution owing to very high diversity within individual sequences.
Fig. 1.
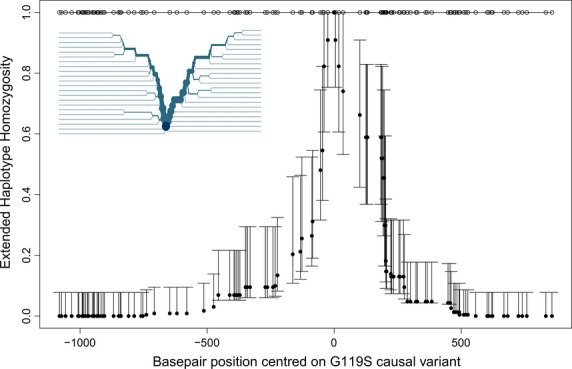
EHH analysis showing LD decay with increasing distance from the 119 codon core position (marked as the origin on the x-axis) in Anopheles gambiae from Accra. Negative numbers are SNPs in the telomeric (T) direction and positive numbers in the centromeric (C) direction plotted on a physical scale with a total span of approximately 2000 bp. For the 119G wild-type data (filled circles), the 95% CI were estimated by bootstrapping. Only a single haplotype was associated with the 119S resistance mutation (open circles), and therefore, EHH = 1 for all SNP positions. Inset panel: long-range haplotype bifurcation plot for 119G (119S shows no bifurcation) illustrating patterns of recombination in each direction, with orientation as in main panel. The core is marked by the dark circle; each SNP is represented by a node; and a recombination (or possibly mutation) event is represented by a bifurcation. The diameter of the circle at each SNP node is proportional to the number of individuals with the same long-range haplotype at that position.
Analysis of 119G haplotypes revealed a marked skew in the ratio of synonymous to non-synonymous mutations (46:8 in the 1266 bp of exonic sequence examined, comprising of approximately 60% of the coding region of Ace-1), consistent with the action of purifying selection. This was supported by Fu and Li's tests of selection (D* = −2.65, P < 0.05; F* = −2.73, P < 0.05), with Tajima's test bordering significance (D = −1.62, 0.10 > P > 0.05). Contrasting statistical parsimony networks constructed from non-synonymous vs. synonymous variants provide further support to the hypothesis of strong purifying selection. The non-synonymous network shows a starlike pattern of short branches (most one substitution) radiating from the most frequent haplotype, which is presumably the ancestral wild type (Fig. S2A, Supporting information). The synonymous network exhibits substantial accumulation of mutations within often long branches separating manifold lineages, which are interconnected by extensive reticulations indicative of many recombination events (Fig. S2B, Supporting information).
Each of the eight non-synonymous substitutions detected was observed in only a single haplotype, although one of these haplotypes contained three changes (Fig. S2A, Supporting information). Structural modelling suggested that, of the seven variant amino acid positions that could be modelled (Table S2, Supporting information), six are conservative and positioned too far from the catalytic and secondary binding sites to radically influence substrate binding. The final substitution is relatively close to the catalytic site but exhibits many variant amino acids in close orthologues, suggesting that polymorphism at this codon is unlikely to seriously impact AChE function. Thus, the few rare non-synonymous variants detected in the 119G haplotypes seem likely to be of limited functional significance.
Resistance association and temporal variation of Ace-1 119S
A total of 561 female A. gambiae s.l. (A. gambiae and A. coluzzii) collected from several Accra suburbs in 2008 were exposed to bendiocarb in standard tube bioassays. A further sample of 192 ‘controls’ were preserved without insecticide exposure. Of these, 333 females – either survivors of bendiocarb exposure or controls – were identified to species using PCR diagnostics and genotyped at the Ace-1 119 locus. Although our study focuses on A. gambiae, we also include A. coluzzii results here for comparison. Ace-1 119S was found at significantly higher frequency in bendiocarb assay survivors than in the unexposed controls in both A. gambiae and A. coluzzii (Table 1A). Based on the proportions of A. gambiae and A. coluzzii in the subset of the total bioassay sample that were diagnosed to species, the overall estimated mortalities differed dramatically (A. gambiae = 0.39, 95% CL 0.30–0.43; A. coluzzii = 0.99 95% CL 0.96–0.99).
Table 1.
Association of G119S with bendiocarb resistance in females from Accra, Ghana
|
Anopheles gambiae |
Anopheles coluzzii |
|||
|---|---|---|---|---|
| Alive | Pop freq | Alive | Pop freq | |
| (A) 2008 Genotype | ||||
| 119G/G | 0 | 33 | 1 | 94 |
| 119G/S | 88 | 30 | 3 | 24 |
| 119S/S | 48 | 10 | 1 | 1 |
| Total N | 136 | 73 | 5 | 119 |
| Probability | 5.5 × 10⁻¹¹ | 0.004 | ||
|
A. gambiae |
A. coluzzii |
|||
|---|---|---|---|---|
| Alive | Dead | Alive | Dead | |
| (B) 2010 Genotype | ||||
| 119G/G | 0 | 15 | 0 | 8 |
| 119G/S | 25 | 2 | 1 | 1 |
| 119S/S | 2 | 0 | 0 | 0 |
| Total N | 27 | 17 | 1 | 9 |
| OR (95% CL) | 18.6 | (4.0–85.3) | 17 | (0.5–523.8) |
| Probability | 7.6 × 10⁻⁶ | 0.19 | ||
(A) Frequency of each Ace-1 G119S genotype in the insecticide-unexposed Accra population (mixed suburbs as in sequence data) and in bioassay survivors from the same collection sites for A. gambiae and A. coluzzii. (B) Genotypes of females from the Madina suburb of Accra, alive and dead following bendiocarb bioassays. Footnotes show probability of (no) association from Fisher's exact tests and (in B) the allelic odds ratio (OR) for association of G119S with bioassay survivorship.
An altered protocol in the 2010 sample collection from Madina (Accra) permitted both the surviving and dead mosquitoes from bendiocarb bioassays to be genotyped, which yielded a more direct demonstration of the very strong association of the Ace-1 G119S substitution with resistance (Table 1B). In both the 2008 and 2010 collections, A. coluzzii showed limited bendiocarb resistance and low frequencies of 119S alleles, in agreement with a broader scale study across southern Ghana (Essandoh et al. 2013).
We added samples of A. gambiae collected in Madina in 2007 and 2011 to those from 2010 and the Madina portion of the 2008 collection, to investigate temporal variation in 119S frequency, without potential for spatial confounding. Data were fitted well by a linear model, assuming 12 generations per year (Fig.2), and genotypes in each collection conformed to Hardy–Weinberg expectations (minimum P = 0.23). The frequency of the resistant 119S allele increased strongly during the sampling period (Fig.2). From a codominant model, which appears appropriate based on the observed linearity and correspondence of data to Hardy–Weinberg proportions, we estimated a best-fit selection coefficient of s = 0.064 acting upon the resistant allele (Fig. S3, Supporting information).
Fig. 2.
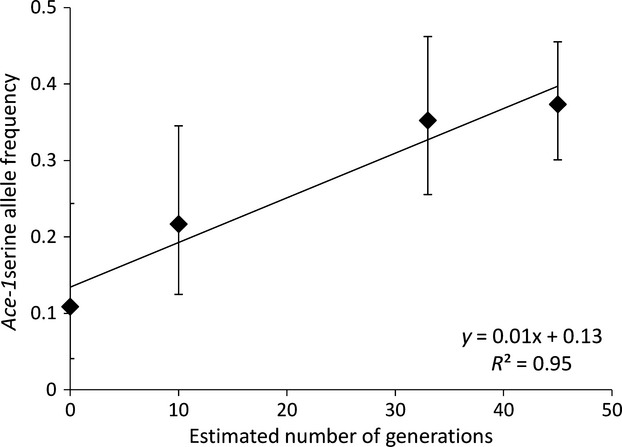
Frequency (with 95% CI) of the Ace-1 119S-resistant allele in Anopheles gambiae from the suburb of Madina in Accra over a period of approximately 4 years. The linear trend represented by the regression is highly significant (Cochrane–Armitage  = 14.2, P = 0.0002), whereas the nonlinear component is not (
 = 0.88, P = 0.64).
Wider selective sweep around Ace-1 G119S
A series of microsatellites located at progressively increasing distances from Ace-1 codon 119 (Table S1, Supporting information) were screened in the 119G/G and 119S/S individuals sequenced previously, along with additional homozygote females obtained from the same collection (total N genotyped: 119G/G = 33; 119S/S = 36). In line with the high polymorphism observed in the sequence data, heterozygosity (He) in the 119G/G group was high throughout the approximately 4.2 Mb region screened, especially in the vicinity of Ace-1. Confidence intervals for He overlap between 119G/G and 119S/S groups beyond −372 kb in the telomeric direction and 388 kb in the centromeric direction, suggesting a broadly symmetrical span of reduced diversity covering at least 760 kb (Fig.3A). The ln(HR/HS) statistic (Fig.3B) clearly pinpointed the centre of the impacted region to the ‘Ace-5K’ microsatellite, located in an intron of Ace-1 and the closest locus to G119S. As expected for a selective sweep around a single target, the correlation between ln(HR/HS) and distance of loci from the G119S position was significantly positive (ρ = 0.65, N = 24, P = 0.0006); i.e. the diversity increased with distance from G119S.
Fig. 3.
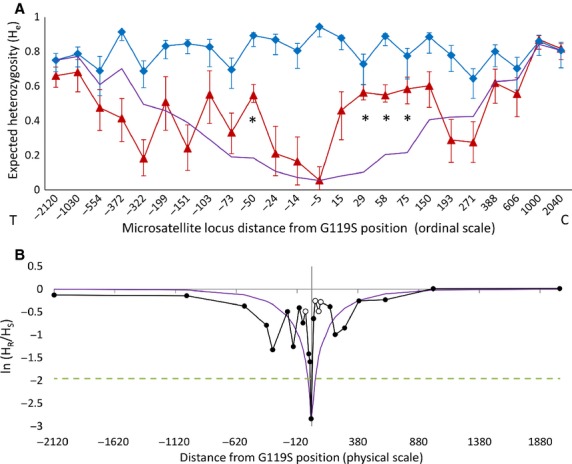
Variation in diversity at microsatellites distributed approximately symmetrically over 2 Mb around Ace-1 G119S in all 2008 Accra samples of Anopheles gambiae. (A) Heterozygosity ±95% CI for 119S (resistant) homozygotes (red triangles) and 119G (wild-type) homozygotes (blue diamonds) plotted against an ordinal scale, numbered from the Ace-1 G119S position in a telomeric (T) to centromeric (C) orientation. The purple line without markers is a deterministic model prediction for a hard selective sweep calculated from wild-type heterozygosities and realistic parameter estimates for the selection coefficient, mutation and recombination rates. *microsatellites detected as significant outliers by their (poor) fit to model prediction (B) Ratio of expected heterozygosities at each locus between groups: ln(HR/HS) plotted against a physical scale. The dashed line shows the 95% significance threshold for a two-tailed Z-test. The purple line without markers shows the equivalent model prediction to that in A; loci identified as outliers in A are shown as unfilled points.
Yet, comparison of ln(HR/HS) between microsatellites paired approximately by distance on either side of G119S revealed significant asymmetry, with higher 119S/S sample microsatellite diversity in the centromeric direction (Wilcoxon signed-rank test, Z = 2.41, P = 0.012). Fit of 119S/S sample data to the hard sweep model also appeared heterogeneous, with significant outliers detected at three adjacent loci 29–75 kb from G119S in the centromeric direction and at 50 kb in the telomeric direction (Fig.3A), reflecting an inconsistent model fit within regions 10s–100s of kb from G119S (Fig.3B).
Differentiation between the G119S sample groups was generally high, most notably at the Ace-5K locus (FST’ > 0.99), resulting from predominance of a single allele in the 119S/S samples that was absent from the relatively uniform frequency distribution of 25 alleles found in the 119G/G group (Fig. S4, Supporting information). Consistent with recombination between 119S and 119G chromosomes, differentiation was reduced towards the edges of the region screened, but significant FST’ remained at loci approximately one megabase from G119S in each direction (Fig.4), suggesting potentially even wider bounds of the selective sweep than suggested from patterns of reduced diversity. However, asymmetry about Ace-1 was again evident with significantly lower median FST’ in the centromeric than in the telomeric direction (Wilcoxon signed-rank test Z = 2.13, P = 0.033).
Fig. 4.
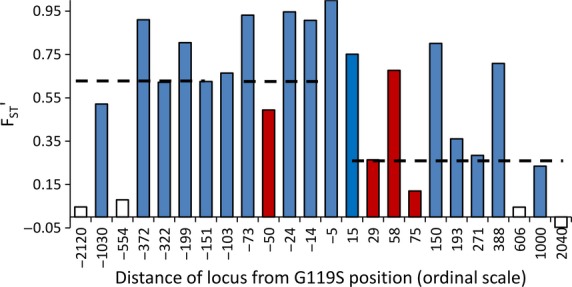
Microsatellite differentiation, measured as diversity-corrected FST between 119S/S (resistant) and 119G/G (susceptible) homozygote Anopheles gambiae. All loci showed significant differentiation (after correction for multiple testing) apart from some of the outermost loci, shown as unfilled bars. Dark red bars show model-fit outliers (see Fig.3). The medians for FST’ across loci on each side of G119S are shown by dashed lines; loci at −103 and −5 are excluded for symmetry because there is no paired microsatellite location on the opposing side.
Evaluation of population genetic parameters suggests a large CNV
Patterns of microsatellite diversity and differentiation broadly correspond to expectations of a selective sweep centred on Ace-1, but with pronounced localized deviations from model predictions. We consider several possible explanations (numbered i-v below) for this relatively poor fit of the hard sweep model predictions.
A first possibility, that (i) admixture of samples from differentiated sampling locales might weaken signals of selection, was readily discounted. Repetition of ln(HR/HS) analysis for the subset of females from the single Accra suburb of Dzorwulu (N = 12 119S/S and N = 18 119G/G) provided near-identical results (Fig. S5, Supporting information) to those from the whole data set. Secondly, the ‘best estimate’ (ii) model parameter values applied might be inaccurate. Though this is certainly possible, when we repeated simulations allowing for substantial variation among the three key model parameters (within the ranges: recombination rate: 0.3–2.0; microsatellite mutation rate: 10−4–10−6; selection coefficient: 0.025–0.100), no parameter combination came any closer to replicating both the broad span of the sweep and the apparent rebound in diversity proximal to Ace-1 (results not shown). A third explanation is the possible existence of heterogeneity in mutation rate among loci or, and perhaps more plausible given the short timescale over which selection has probably occurred, (iii) heterogeneity in recombination rate throughout the region genotyped. Recombination rate data are available for chromosome arm 2R on which Ace-1 is located (Ace-1 AGAMP4 position: 3 484 107–3 495 790; numbered from the telomere), but unfortunately, quantification accuracy is poor in the 4.2 Mb region genotyped here (Fig. S1, Supporting information). Nevertheless, variation in recombination rate might be most readily apparent via patterns of linkage disequilibrium (LD). As expected for a hard selective sweep, LD was significantly more pronounced among loci in the 119S/S group, but contrary to expectation, few of the significant LD tests were among microsatellite pairs close to Ace-1 (Fig. S6, Supporting information). Whilst this recombination heterogeneity might be involved, such LD inconsistency could also have other causes, which we examined via patterns of Hardy–Weinberg deviation (measured by FIS).
Significant homozygote excess was detected at many loci, most likely a result of frequent (iv) null alleles (Table 2), which are a predictable consequence of the extreme SNP frequency in Anopheles and other mosquitoes (Wilding et al. 2009). Null alleles might weaken the selective sweep signal by inflating the ratio of HR/HS (i.e. 119S/S HE: 119G/G HE) via reduced allelic diversity in 119G/G samples. However, null alleles in the 119S/S group would have the opposite effect and were almost as commonly detected as in the 119G/G samples. Crucially, though null alleles were suggested in 119G/G samples at three of the four loci showing especially poor model fit, a far more notable difference at these loci is that, in the 119S/S group, they are the only loci to exhibit a significant excess of heterozygotes (Table 2), arising from near-ubiquitous possession of the just two alleles (Fig. S4), Supporting information).
Table 2.
Deviations from Hardy–Weinberg equilibrium (measured by FIS) and possible sources of scoring errors at microsatellite loci
| 119S/S |
119G/G |
|||||
|---|---|---|---|---|---|---|
| Locus (kb) | FIS | P-value | Null freq | FIS | P-value | Null freq |
| −2120 | −0.21 | 0.571 | −0.17 | 0.050 | ||
| −1030 | −0.01 | 0.348 | −0.03 | 0.057 | ||
| −554 | −0.16 | 1.000 | 0.22 | 0.066 | ||
| −372 | 0.00 | 0.513 | 0.09 | 0.427 | ||
| −322 | −0.07 | 1.000 | 0.12 | 0.533 | ||
| −199 | 0.11 | 0.196 | 0.15 | 0.000 | 0.288 | |
| −151 | 0.05 | 0.445 | −0.04 | 0.910 | ||
| −103 | 0.55 | 0.000 | 0.190 | 0.67 | 0.000 | 0.450 |
| −73 | −0.12 | 1.000 | 0.00 | 0.931 | ||
| −50* | −0.79 | 0.000 | 0.12 | 0.416 | ||
| −24 | 0.34 | 0.008 | 0.057 | 0.25 | 0.000 | 0.166 |
| −14 | 0.65 | 0.001 | 0.090 | 0.63 | 0.000 | 0.273 |
| −5 | −0.01 | 1.000 | 0.46 | 0.000 | 0.215 | |
| 15 | 0.64 | 0.000 | 0.198 | 0.12 | 0.036 | |
| 29* | −0.75 | 0.000 | 0.32 | 0.004 | 0.192 | |
| 58* | −0.85 | 0.000 | 0.12 | 0.063 | ||
| 75* | −0.33 | 0.000 | 0.36 | 0.002 | 0.374 | |
| 150 | 0.54 | 0.000 | 0.199 | 0.36 | 0.000 | 0.301 |
| 193 | −0.09 | 1.000 | −0.01 | 0.021 | ||
| 271 | −0.11 | 1.000 | 0.18 | 0.488 | ||
| 388 | 0.29 | 0.009 | 0.227 | 0.44 | 0.000 | 0.288 |
| 606 | 0.05 | 0.922 | 0.25 | 0.034 | 0.167 | |
| 1000 | −0.02 | 0.626 | 0.14 | 0.041 | ||
| 2040 | 0.10 | 0.334 | 0.28 | 0.001 | 0.229 | |
Loci are ordered by distance from Ace-1 G119S with FIS values and probabilities (for the null hypothesis of FIS = 0), shown in bold where significant after Bonferroni correction for multiple testing. Null allele frequency estimates are shown where suggested as probable by Micro-Checker. Significant cases of heterozygote excess are offset to the left;
loci exhibiting significantly poor fit to the hard sweep model (see Fig.3).
In a sexual mating system, a common cause of significant heterozygote excess at markers is locus (v) copy number variation. A large, 119S-specific CNV encompassing the region spanned by the outlying markers (i.e. ≥125 kb) could readily explain patterns of deviation from hard sweep predictions by inflating observed HE in the 119S/S group. Unless there was actually more than one CNV (e.g. one encompassing locus −50 kb from G119S, and another encompassing loci at 29, 58 and 75 kb), it seems puzzling that the four microsatellites between −50 kb and 29 kb did not exhibit heterozygote excess. Null alleles in the 119S/S samples in three of these four loci, especially notable for locus ‘Ace-15k’, could mask this, but were not evident at Ace-5k, located within the Ace-1 gene. To investigate this, we sequenced the Ace-5K locus directly from (uncloned) microsatellite PCRs in both 119G/G samples (all heterozygous at Ace-5k) and 119S/S samples (all homozygous at Ace-5k). As expected, the 119G/G individuals yielded sequence that deteriorated irretrievably from the heterozygous indel position in the microsatellite repeat region (Fig. S7, Supporting information). Surprisingly, each of the supposedly Ace-5k homozygous 119S/S individuals sequenced also showed evidence of indels within the repetitive region via a clear deterioration in sequence quality attributable to the presence of major and minor traces in the sequences (Figure S8, Supporting information). This suggests that scoring of Ace-5k 119S/S genotypes as homozygotes is erroneous, but arises because of a quantitative dominance of a single, presumably multiply copied allele, with the alternate allele in each heterozygote at a level of PCR amplification falling below our allele-scoring threshold.
We therefore conclude that the only explanation that can adequately and parsimoniously explain the deviation observed from the hard sweep model expectations and other population genetic parameters is the existence of a large CNV, detection of which was obscured at some loci by null alleles and/or presence of multiple, rather than duplicated copies.
Copy number variation (CNV) of Ace-1
To test whether the evidence for segmental amplification above might correspond with CNV of Ace-1, we applied a recently developed qRT–PCR diagnostic (Edi et al. 2014) to the same sample used for microsatellite analysis. We detected a highly significant difference (heteroscedastic t-test, t38 = 20.4, P = 4.5 × 10⁻²²) in estimated copy number between 119S/S (mean ± 95%CI = 4.75 ± 0.32) and 119G/G (mean = 1.12 ± 0.09) individuals (Fig.5A). In fact, there was no overlap between the sample groups with Ace-1 in the vast majority of glycine homozygotes likely to be single copy (maximum estimated CNV ratio = 1.6) but all serine homozygotes clearly possessing multiple copies of resistant alleles (CNV ratio range 2.7–6.6). 119G/G genotypes cluster tightly, but 119S/S genotypes appear split into two main groups, especially with respect to the x-axis, raising the possibility that some of the TaqMan genotypes might have been mis-called (Fig.5A). Sequencing of the same Ace-1 fragment as before in these samples confirmed the complete absence of 119G alleles; therefore, the split grouping appears to reflect differences in copy number.
Fig. 5.
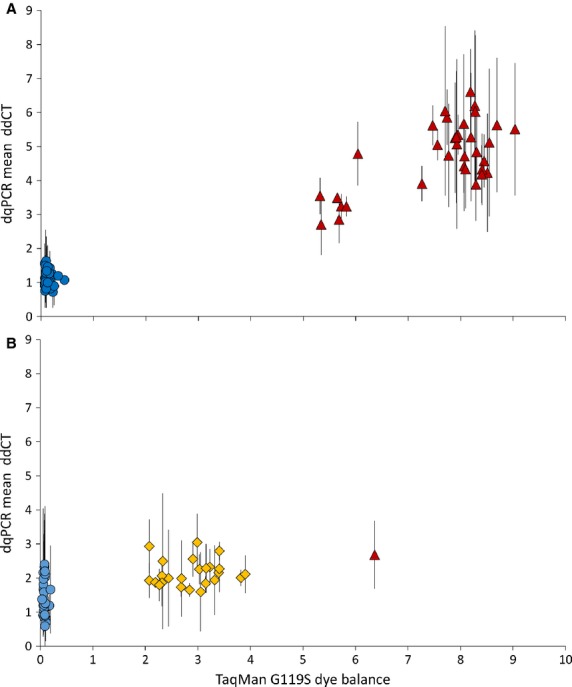
G119S polymorphism and Ace-1 CNV estimation in Anopheles gambiae. (A) Samples from the 2008 Accra collection used for microsatellite genotyping and gene sequencing; (B) archived samples from several sites within Greater Accra sampled in 2002. Blue circle = 119G/G; red triangle = 119S/S; yellow diamond = 119G/S. The x-axis shows the dye balance ratio, which indicates the ratio of fluorescent signal from 119 serine (resistant): 119 glycine (susceptible) alleles at the qPCR endpoint. The y-axis shows Ace-1 copy number estimated as ΔΔCT values calculated for products from three Ace-1 exons (± standard deviation).
We investigated the recent history of the Ace-1 CNV by qRT–PCR of archived samples collected in 2002 from six sites in the Greater Accra district (all <100 km from the 2008 suburban Accra sample sites). Although only a few per cent of approximately N = 400, 2002 samples genotyped contained resistant alleles, Ace-1 CNV was clearly present in 119G/S heterozygotes (Fig.5B); most (perhaps all) of these appear to possess additional alleles (range of CNV estimates 1.6–3.0). The single 119S homozygote in the 2002 sample set, which we confirmed as correctly genotyped by sequencing, exhibited a CNV metric within the range of heterozygotes. Again, there was a highly significant difference (homoscedastic t-test, t52 = 5.3, P = 2.2 × 10⁻⁶) in estimated copy number between 119G/S (mean ± 95%CI = 2.15 ± 0.16) and 119G/G (mean = 1.46 ± 0.19) individuals (Fig.5B). Variability in copy number in 119G homozygotes from 2002 was significantly greater than in 2008 (Levene's test, F = 5.1, P = 0.029), and the mean copy number estimate was significantly higher (t52 = 3.18, P = 0.003). Thus, in contrast to the 2008-collected 119G/G samples, at least some of the 2002 119G homozygotes were duplicants, consistent with the evolution of reduced CNV level of susceptible alleles over the relatively short time period between collection dates, whereas resistant alleles appear to have evolved towards increased copy number.
Discussion
Functional constraint and purifying selection acting on Ace-1
The G119S substitution in Ace-1 is one of the most widespread insecticide resistance mutations known in mosquitoes (Weill et al. 2004a,b) and has evolved multiple times (Weill et al. 2004b). G119S polymorphism is strongly associated with resistance to carbamates and organophosphates (Djogbénou et al. 2007; Edi et al. 2012; Essandoh et al. 2013), with near-ubiquitous survival of homozygotes to standard WHO diagnostic doses in both A. coluzzii and A. gambiae s.s. (Essandoh et al. 2013). In comparison with the only other target site for WHO-approved insecticide classes, the para voltage-gated sodium channel (Vgsc), few resistance-associated mutations have been detected in Ace-1 across insect species (IRAC 2014), suggesting marked functional constraint (Weill et al. 2003; Oakeshott et al. 2005; Alout & Weill 2008).
Sequencing results from our study strongly support this hypothesis, with significant statistical and qualitative evidence for purifying selection acting on wild-type 119G alleles. Despite very high synonymous nucleotide diversity, there were few amino acid variants; all (other than G119S) were very rare and with little predicted functional effect. These variants are probably transient variants in the normal birth and death process of mutations subject to small selection coefficients, with little chance of accumulation or increase in frequency in such a functionally constrained gene.
In marked contrast to the high 119G synonymous nucleotide diversity, but entirely consistent with purifying selection, the 119S mutation was the only variant of any kind detected in resistant haplotypes. Strong constraint on a protein poses a problem for the evolution of altered function, a highly desirable property for insecticide design, because coding variants of major structural impact are very likely to be deleterious. As discussed below, this is the case for the Ace-1 119S mutation, but unfortunately, A. gambiae appears to be in the process of circumventing this problem via gene amplification.
Strength and nature of selection on Ace-1 G119S
A priori expectations for the strength of directional selection operating on Ace-1 were unclear. Despite very strong resistance association, AChE with the 119S amino acid substitution exhibits seriously impaired enzymatic activity in the absence of insecticide (Alout & Weill 2008). In Culex pipiens, this results in major fitness costs in field populations (Labbé et al. 2007b), which are also predicted in A. gambiae owing to similar interactions of AChE with insecticides in each species (Alout et al. 2008). Strong fitness costs have proved more difficult to detect in laboratory studies of A. gambiae (Djogbénou et al. 2010), but consistent with the cost hypothesis, 119S homozygotes are typically very rare or absent in wild populations, even where heterozygotes are extremely common (Djogbénou et al. 2008b; Ahoua Alou et al. 2010; Edi et al. 2012). An additional uncertainty arises because until very recently, carbamates and organophosphates played little part in organized vector control in West Africa, and accurate records of their scale of use in agriculture are unavailable. Neverthless, we unambiguously document genomic signatures of selection that are clearly centred on Ace-1 G119S. Overall, our results suggest selection of 119S from a rare haplotypic background in a genomic region of high diversity. The area of the selective sweep spans at least 760 kb and, based on patterns of differentiation and extended LD, may exceed 2 Mb, though recombination appears likely to be impacting at least some of the loci beyond the 760-kb area. Whilst the span of the selective sweep area is symmetrical, both relative heterozygosity and differentiation show marked asymmetry about Ace-1. This occurred at least in part because of loci showing heterozygote excess, which significantly impacted those located from position −50 kb (from G119S) to 75 kb, and result primarily from possession of a pair of very common alleles as part of a duplicated genomic segment. Notably, sequencing of the microsatellite within the Ace-1 intron detected evidence of CNV, but with one or more low-frequency additional alleles masked from genotype scoring by a single numerically dominant allele. Indeed, the magnitude of the signal of reduced diversity in the locale of Ace-1 is clearly underestimated owing to the presence of the regional duplication.
In addition to the genomic signatures of selection, temporal variation in allele frequencies suggests that the 119S mutant is under substantial contemporary selection. The frequency of the 119S allele is increasing in Accra, which is at the centre of a localized belt of high-prevalence carbamate and organophophate resistance in Ghana (Essandoh et al. 2013). Whether public health use of insecticides has played any part in this selection is unclear, but a major role can probably be ruled out.
In 119S homozygotes, lack of variation in Ace-1 and in microsatellites upstream (i.e. in the telomeric direction), and near maximal differentiation from 119G homozygotes, are entirely consistent with expectations of a hard selective sweep from a single very rare mutation (Messer & Petrov 2013). Similarly, LD in the 119S sample group was perfect within the sequenced region of Ace-1 and generally elevated across the region screened by microsatellites, as would be predicted under a hard sweep. However, overlaid duplicated alleles, identical in Ace-1 gene sequence, but not in flanking regions, clearly indicate incomplete identity by descent. The duplicated region appears large, at least 125 kb, and consequently extends far beyond the 11 kb Ace-1 gene. Such a CNV size is similar to that detected recently in Drosophila melanogaster around the Rdl insecticide resistance target site locus (Remnant et al. 2013), though here, the gene itself is several times longer than Anopheles Ace-1. In spite of the large size of the CNV we detected, only three other genes are located therein (AGAP001357, 8 and 60), all downstream (i.e. centromeric direction) of Ace-1. Two are undescribed with no, or poor, orthology to functionally validated genes in other species, and the third has a good orthologue in D. melanogaster, but with an uncharacterized gene. None have any known or putative link to insecticide resistance and therefore seem unlikely to contribute directly to resistance phenotypes.
Ace-1 duplication and resistance evolution in mosquitoes
Gene duplication is thought to be a critical component of adaptive evolution (Ohta 1989; Ubeda et al. 2014) and probably remains an underestimated force in the evolution of insecticide resistance (Ffrench-Constant 2013). Copy number variation of Ace-1 has been found in several diverse economically or medically important insect taxa and is often, though not always, linked to insecticide resistance (Labbé et al. 2007a; Djogbénou et al. 2008b; Kwon et al. 2010; Shang et al. 2014; Sonoda et al. 2014). Since its discovery in A. gambiae s.s. and A. coluzzii (Djogbénou et al. 2008a), the working model for the structure and function of Ace-1 duplication has been based on C. pipiens mosquitoes (Alout et al. 2008). C. pipiens exhibit linked pairing of resistant and susceptible alleles on the same chromosome, which compensates for the fitness cost of possessing resistant alleles (Labbé et al. 2007a,b). This model seemed potentially applicable to A. coluzzii from southern Côte d'Ivoire that exhibit near fixed G119S heterozygosity and high Ace-1 CNV frequency (Ahoua Alou et al. 2010; Edi et al. 2012, 2014). Similarly, in our archived 2002 Ghanaian samples (in which serine alleles were very rare), we found that, with the exception of one 119S homozygote, duplication involved G119S heterozygotes, all of which were duplicated. However, we also found a few 119G/G homozygotes duplicated at a low level. These were not found in the 2008 collection, all of which were single copy. This might indicate that, at least when the 119S mutation was very rare, duplication of susceptible alleles was favoured. In Drosophila melanogaster strains, low-level duplication of AChE provides enhanced insecticide resistance (Charpentier & Fournier 2001). This in turn suggests occurrence of transitional states in the evolution of resistance, involving replacement of duplicated susceptible alleles with linked point mutation and copy number variation. Such heterozygotes with an excess of duplicated resistant alleles may be either a stable alternative or a transitional state on the evolutionary path towards resistant homozygotes with many gene copies. Given the speed of change in allele and duplicate frequencies, this question may be resolved in the near future.
Possession of multiple copies of functionally identical Ace-1-resistant alleles by single insects does not appear to have been documented previously. The closest precedent to our results comes from two-spotted spider mites, Tetranychus urticae, which can possess a similarly high number of copies of resistant Ace-1 alleles (Kwon et al. 2010), though with a mixture of three different resistance-associated substitutions (at different codons). Kwon et al. (2012) demonstrated that resistant alleles in T. urticae reduce the catalytic capacity of AChE, but that in the presence of these mutations, multiple copies of AChE restore catalytic activity to a normal (wild-type) level. This may provide a useful working model for multicopy 119S Ace-1 in A. gambiae, though possession of up to six or copies of a region of at least 125 kb would suggest far from trivial costs in terms of significantly increased genome size that must be outweighed by adaptive value (Adler et al. 2014). Copy levels of susceptible alleles (i.e. beyond a simple qualitative CNV vs. no CNV distinction) did not provide enhanced resistance in D. melanogaster, and whether and how high level amplification might play a role in insecticide resistance is unclear. It is also currently unknown if the copies are arranged in tandem and thus how likely they are to be co-inherited, although preliminary cytological studies are consistent with this (I. Sharakov, L. S. Djogbenou, unpublished data). In spite of these uncertainties, given that Ace-1 119S/S homozygotes appear near-ubiquitously resistant to standard diagnostic doses of each class of insecticide (Essandoh et al. 2013), the strongly increasing frequency of 119S with a proportionate increase in homozygotes (G119S was in Hardy–Weinberg equilibrium in all collections) is an unexpected and extremely worrying trend.
Detection of selective sweeps
A more positive implication of our study is that even in areas of apparently normal recombination in a very low LD genome (Harris et al. 2010; Neafsey et al. 2010; Weetman et al. 2010), which is likely to be characteristic of many medically and agriculturally important insect species, it is possible to detect very clear signatures associated with positive selection. The presence of a single Ace-1 119S sequence haplotype combined with the very high nucleotide diversity and very low LD in the Ace-1 119G wild-type haplotypes clearly argues for a recent origin by rare mutation rather than selection from standing genetic variation. However, as observed for drug resistance locus pfmdr1 in Plasmodium falciparum (Nair et al. 2007), CNV causes deviation from hard sweep model expectations and reduces the local strength of the drop in diversity around the target gene. CNV identification is not currently a routine component of the selective sweep detection armamentarium for most organisms (but see (Nair et al. 2008)). Whilst automated identification of large CNVs remains challenging in genome scans, our results highlight that if CNVs are not detected, important signals of selection might be misinterpreted or missed entirely.
Acknowledgments
This work was funded by the National Institutes of Health (R01AI082734); the Innovative Vector Control Consortium; a BBSRC PhD studentship to SNM; a Wellcome Trust Master's Fellowship in Public Health and Tropical Medicine 094960/Z/10/Z to JE; and a Wellcome Trust Training Fellowship in Public Health and Tropical Medicine WT093755 to LSD. We are grateful to Mike Osae (Ghana Atomic Energy Commission) for help with sampling and to three anonymous reviewers for helpful comments and suggestions.
Data accessibility
Microsatellite and Ace-1 TaqMan genotyping data and qRT–PCT CNV analysis data are provided as supporting information in file: Weetman_et al. Data S1.xlsx. Sequence data have been submitted to GenBank with Accession nos.: KP165332–KP165384. Aligned sequences are also provided as supporting information in file: Weetman_et al. Data S2.phy.
Supporting information
Additional supporting information may be found in the online version of this article.
Table S1 Details of microsatellites screened.
Table S2 Non-synonymous changes observed in Ace-1 119 wild-type haplotypes.
Fig. S1 Recombination rate across chromosome 2R estimated from data in Zheng et al. 1996.
Fig. S2 Statistical parsimony analysis of 1266 bp of coding sequence surrounding codon 119 of the Ace-1 locus.
Fig. S3 Estimation of the selection coefficient from deterministic model simulations.
Fig. S4 Allele frequency distributions at each microsatellite locus.
Fig. S5 As Fig. 3 but plotted for samples from a single location: the Accra suburb of Dzorwulu.
Fig. S6 Pairwise linkage disequilibrium (LD) heatmap between microsatellite loci.
Fig. S7 Sequencing of microsatellite Ace-5k in 119G/G individuals.
Fig. S8 Sequencing of microsatellite locus ‘Ace-5k’ in 119S/S individuals.
Data S1 Ace-1 119 genotypes and microsatellite alleles for each locus in each individual genotyped and qRT–PCR CNV analysis results. File: Weetman et al. Data S1.xlsx
Data S2 Alignment of Ace-1 haplotypes in Phylip format. File: Weetman et al. Data S2.phy (text file).
References
- Adler M, Anjum M, Berg OG, Andersson DI, Sandegren L. High fitness costs and instability of gene duplications reduce rates of evolution of new genes by duplication-divergence mechanisms. Molecular Biology and Evolution. 2014;31:1526–1535. doi: 10.1093/molbev/msu111. [DOI] [PubMed] [Google Scholar]
- Ahoua Alou LP, Koffi AA, Adja MA, et al. Distribution of ace-1R and resistance to carbamates and organophosphates in Anopheles gambiae s.s. populations from Côte d'Ivoire. Malaria Journal. 2010;9:167. doi: 10.1186/1475-2875-9-167. [DOI] [PMC free article] [PubMed] [Google Scholar]
- Akogbéto MC, Padonou GG, Gbénou D, Irish S, Yadouleton A. Bendiocarb, a potential alternative against pyrethroid resistant Anopheles gambiae in Benin, West Africa. Malaria Journal. 2010;9:204. doi: 10.1186/1475-2875-9-204. [DOI] [PMC free article] [PubMed] [Google Scholar]
- Alout H, Weill M. Amino-acid substitutions in acetylcholinesterase 1 involved in insecticide resistance in mosquitoes. Chemico-Biological Interactions. 2008;175:138–141. doi: 10.1016/j.cbi.2008.03.018. [DOI] [PubMed] [Google Scholar]
- Alout H, Djogbénou L, Berticat C, Chandre F, Weill M. Comparison of Anopheles gambiae and Culex pipiens acetycholinesterase 1 biochemical properties. Comparative Biochemistry and Physiology Part B, Biochemistry & Molecular Biology. 2008;150:271–277. doi: 10.1016/j.cbpb.2008.03.008. [DOI] [PubMed] [Google Scholar]
- Barton N. Understanding adaptation in large populations. PLoS Genetics. 2010;6:e1000987. doi: 10.1371/journal.pgen.1000987. [DOI] [PMC free article] [PubMed] [Google Scholar]
- Bass C, Field LM. Gene amplification and insecticide resistance. Pest Management Science. 2011;67:886–890. doi: 10.1002/ps.2189. [DOI] [PubMed] [Google Scholar]
- Bass C, Nikou D, Vontas J, et al. The vector population monitoring tool (VPMT): high-throughput DNA-based diagnostics for the monitoring of mosquito vector populations. Malaria Research and Treatment. 2010;2010:e190434. doi: 10.4061/2010/190434. [DOI] [PMC free article] [PubMed] [Google Scholar]
- Charpentier A, Fournier D. Levels of total acetylcholinesterase in Drosophila melanogaster in relation to insecticide resistance. Pesticide Biochemistry and Physiology. 2001;70:100–107. [Google Scholar]
- Clement M, Posada D, Crandall KA. TCS: a computer program to estimate gene genealogies. Molecular Ecology. 2000;9:1657–1659. doi: 10.1046/j.1365-294x.2000.01020.x. [DOI] [PubMed] [Google Scholar]
- Colletier JP, Sanson B, Nachon F, et al. Conformational flexibility in the peripheral site of Torpedo californica acetylcholinesterase revealed by the complex structure with a bifunctional inhibitor. Journal of the American Chemical Society. 2006;128:4526–4527. doi: 10.1021/ja058683b. [DOI] [PubMed] [Google Scholar]
- Coluzzi M, Sabatini A, della Torre A, Di Deco MA, Petrarca V. A polytene chromosome analysis of the Anopheles gambiae species complex. Science. 2002;298:1415–1418. doi: 10.1126/science.1077769. [DOI] [PubMed] [Google Scholar]
- Djogbénou L, Weill M, Hougard JM, et al. Characterization of insensitive acetylcholinesterase (ace-1R) in Anopheles gambiae (Diptera: Culicidae): resistance levels and dominance. Journal of Medical Entomology. 2007;44:805–810. doi: 10.1603/0022-2585(2007)44[805:coiaai]2.0.co;2. [DOI] [PubMed] [Google Scholar]
- Djogbénou L, Chandre F, Berthomieu A, et al. Evidence of introgression of the ace-1(R) mutation and of the ace-1 duplication in West African Anopheles gambiae s. s. PLoS One. 2008a;3:e2172. doi: 10.1371/journal.pone.0002172. [DOI] [PMC free article] [PubMed] [Google Scholar]
- Djogbénou L, Dabiré R, Diabaté A, et al. Identification and geographic distribution of the ACE-1R mutation in the malaria vector Anopheles gambiae in south-western Burkina Faso, West Africa. The American Journal of Tropical Medicine and Hygiene. 2008b;78:298–302. [PubMed] [Google Scholar]
- Djogbénou L, Noel V, Agnew P. Costs of insensitive acetylcholinesterase insecticide resistance for the malaria vector Anopheles gambiae homozygous for the G119S mutation. Malaria Journal. 2010;9:12. doi: 10.1186/1475-2875-9-12. [DOI] [PMC free article] [PubMed] [Google Scholar]
- Edi CVA, Koudou BG, Jones CM, Weetman D, Ranson H. Multiple-insecticide resistance in Anopheles gambiae mosquitoes, Southern Côte d'Ivoire. Emerging Infectious Diseases. 2012;18:1508–1511. doi: 10.3201/eid1809.120262. [DOI] [PMC free article] [PubMed] [Google Scholar]
- Edi CV, Djogbénou L, Jenkins AM, et al. CYP6 P450 enzymes and ACE-1 duplication produce extreme and multiple insecticide resistance in the malaria mosquito Anopheles gambiae. PLoS genetics. 2014;10:e1004236. doi: 10.1371/journal.pgen.1004236. [DOI] [PMC free article] [PubMed] [Google Scholar]
- Essandoh J, Yawson AE, Weetman D. Acetylcholinesterase (Ace-1) target site mutation 119S is strongly diagnostic of carbamate and organophosphate resistance in Anopheles gambiae s.s. and Anopheles coluzzii across southern Ghana. Malaria Journal. 2013;12:404. doi: 10.1186/1475-2875-12-404. [DOI] [PMC free article] [PubMed] [Google Scholar]
- Fanello C, Santolamazza F, Della Torre A. Simultaneous identification of species and molecular forms of the Anopheles gambiae complex by PCR-RFLP. Medical and Veterinary Entomology. 2002;16:461–464. doi: 10.1046/j.1365-2915.2002.00393.x. [DOI] [PubMed] [Google Scholar]
- Ffrench-Constant RH. The molecular genetics of insecticide resistance. Genetics. 2013;194:807–815. doi: 10.1534/genetics.112.141895. [DOI] [PMC free article] [PubMed] [Google Scholar]
- Goudet J. FSTAT (Version 1.2): a computer program to calculate F-statistics. Journal of Heredity. 1995;86:485–486. [Google Scholar]
- Harr B, Kauer M, Schlötterer C. Hitchhiking mapping: a population-based fine-mapping strategy for adaptive mutations in Drosophila melanogaster. Proceedings of the National Academy of Sciences of the United States of America. 2002;99:12949–12954. doi: 10.1073/pnas.202336899. [DOI] [PMC free article] [PubMed] [Google Scholar]
- Harris C, Rousset F, Morlais I, Fontenille D, Cohuet A. Low linkage disequilibrium in wild Anopheles gambiae s.l. populations. BMC genetics. 2010;11:81. doi: 10.1186/1471-2156-11-81. [DOI] [PMC free article] [PubMed] [Google Scholar]
- Hedrick PW. A standardized genetic differentiation measure. Evolution. 2005;59:1633–1638. [PubMed] [Google Scholar]
- Hedrick PW. Adaptive introgression in animals: examples and comparison to new mutation and standing variation as sources of adaptive variation. Molecular Ecology. 2013;22:4606–4618. doi: 10.1111/mec.12415. [DOI] [PubMed] [Google Scholar]
- Holt RA, Subramanian GM, Halpern A, et al. The genome sequence of the malaria mosquito Anopheles gambiae. Science. 2002;298:129–149. doi: 10.1126/science.1076181. [DOI] [PubMed] [Google Scholar]
- IRAC. 2014. Mode of Action ¦ Teams ¦ IRAC.
- Karasov T, Messer PW, Petrov DA. Evidence that adaptation in Drosophila is not limited by mutation at single sites. PLoS Genetics. 2010;6:e1000924. doi: 10.1371/journal.pgen.1000924. [DOI] [PMC free article] [PubMed] [Google Scholar]
- Karlsson EK, Kwiatkowski DP, Sabeti PC. Natural selection and infectious disease in human populations. Nature Reviews Genetics. 2014;15:379–393. doi: 10.1038/nrg3734. [DOI] [PMC free article] [PubMed] [Google Scholar]
- Katoh K, Standley DM. MAFFT multiple sequence alignment software version 7: improvements in performance and usability. Molecular Biology and Evolution. 2013;30:772–780. doi: 10.1093/molbev/mst010. [DOI] [PMC free article] [PubMed] [Google Scholar]
- Kigozi R, Baxi SM, Gasasira A, et al. Indoor residual spraying of insecticide and malaria morbidity in a high transmission intensity area of Uganda. PLoS One. 2012;7:e42857. doi: 10.1371/journal.pone.0042857. [DOI] [PMC free article] [PubMed] [Google Scholar]
- Kofler R, Schlötterer C, Lelley T. SciRoKo: a new tool for whole genome microsatellite search and investigation. Bioinformatics. 2007;23:1683–1685. doi: 10.1093/bioinformatics/btm157. [DOI] [PubMed] [Google Scholar]
- Koressaar T, Remm M. Enhancements and modifications of primer design program Primer3. Bioinformatics. 2007;23:1289–1291. doi: 10.1093/bioinformatics/btm091. [DOI] [PubMed] [Google Scholar]
- Kwon DH, Clark JM, Lee SH. Extensive gene duplication of acetylcholinesterase associated with organophosphate resistance in the two-spotted spider mite. Insect Molecular Biology. 2010;19:195–204. doi: 10.1111/j.1365-2583.2009.00958.x. [DOI] [PubMed] [Google Scholar]
- Kwon DH, Choi JY, Je YH, Lee SH. The overexpression of acetylcholinesterase compensates for the reduced catalytic activity caused by resistance-conferring mutations in Tetranychus urticae. Insect Biochemistry and Molecular Biology. 2012;42:212–219. doi: 10.1016/j.ibmb.2011.12.003. [DOI] [PubMed] [Google Scholar]
- Labbé P, Berthomieu A, Berticat C, et al. Independent duplications of the acetylcholinesterase gene conferring insecticide resistance in the mosquito Culex pipiens. Molecular Biology and Evolution. 2007a;24:1056–1067. doi: 10.1093/molbev/msm025. [DOI] [PubMed] [Google Scholar]
- Labbé P, Berticat C, Berthomieu A, et al. Forty years of erratic insecticide resistance evolution in the mosquito Culex pipiens. PLoS genetics. 2007b;3:e205. doi: 10.1371/journal.pgen.0030205. [DOI] [PMC free article] [PubMed] [Google Scholar]
- Lehmann T, Hawley WA, Grebert H, Collins FH. The effective population size of Anopheles gambiae in Kenya: implications for population structure. Molecular Biology and Evolution. 1998;15:264–276. doi: 10.1093/oxfordjournals.molbev.a025923. [DOI] [PubMed] [Google Scholar]
- Leys C, Ley C, Klein O, Bernard P, Licata L. Detecting outliers: do not use standard deviation around the mean, use absolute deviation around the median. Journal of Experimental Social Psychology. 2013;49:764–766. [Google Scholar]
- Librado P, Rozas J. DnaSP v5: a software for comprehensive analysis of DNA polymorphism data. Bioinformatics. 2009;25:1451–1452. doi: 10.1093/bioinformatics/btp187. [DOI] [PubMed] [Google Scholar]
- Lynd A, Weetman D, Barbosa S, et al. Field, genetic, and modeling approaches show strong positive selection acting upon an insecticide resistance mutation in Anopheles gambiae s.s. Molecular Biology and Evolution. 2010;27:1117–1125. doi: 10.1093/molbev/msq002. [DOI] [PMC free article] [PubMed] [Google Scholar]
- Meirmans PG. Using the Amova framework to estimate a standardized genetic differentiation measure. Evolution. 2006;60:2399–2402. [PubMed] [Google Scholar]
- Messer PW, Petrov DA. Population genomics of rapid adaptation by soft selective sweeps. Trends in Ecology & Evolution. 2013;28:659–669. doi: 10.1016/j.tree.2013.08.003. [DOI] [PMC free article] [PubMed] [Google Scholar]
- Nair S, Williams JT, Brockman A, et al. A selective sweep driven by Pyrimethamine treatment in Southeast Asian malaria parasites. Molecular Biology and Evolution. 2003;20:1526–1536. doi: 10.1093/molbev/msg162. [DOI] [PubMed] [Google Scholar]
- Nair S, Nash D, Sudimack D, et al. Recurrent gene amplification and soft selective sweeps during evolution of multidrug resistance in malaria parasites. Molecular Biology and Evolution. 2007;24:562–573. doi: 10.1093/molbev/msl185. [DOI] [PubMed] [Google Scholar]
- Nair S, Miller B, Barends M, et al. Adaptive copy number evolution in malaria parasites. PLoS Genetics. 2008;4:e1000243. doi: 10.1371/journal.pgen.1000243. [DOI] [PMC free article] [PubMed] [Google Scholar]
- Neafsey DE, Lawniczak MKN, Park DJ, et al. SNP genotyping defines complex gene-flow boundaries among African malaria vector mosquitoes. Science. 2010;330:514–517. doi: 10.1126/science.1193036. [DOI] [PMC free article] [PubMed] [Google Scholar]
- Oakeshott JG, Devonshire AL, Claudianos C, et al. Comparing the organophosphorus and carbamate insecticide resistance mutations in cholin- and carboxyl-esterases. Chemico-Biological Interactions. 2005;157–158:269–275. doi: 10.1016/j.cbi.2005.10.041. [DOI] [PubMed] [Google Scholar]
- Ohta T. Role of gene duplication in evolution. Genome. 1989;31:304–310. doi: 10.1139/g89-048. [DOI] [PubMed] [Google Scholar]
- Pombi M, Stump AD, Della Torre A, Besansky NJ. Variation in recombination rate across the X chromosome of Anopheles gambiae. The American Journal of Tropical Medicine and Hygiene. 2006;75:901–903. [PubMed] [Google Scholar]
- Pombi M, Caputo B, Simard F, et al. Chromosomal plasticity and evolutionary potential in the malaria vector Anopheles gambiae sensu stricto: insights from three decades of rare paracentric inversions. BMC evolutionary biology. 2008;8:309. doi: 10.1186/1471-2148-8-309. [DOI] [PMC free article] [PubMed] [Google Scholar]
- R Development Core Team. R: A Language and Environment for Statistical Computing. Vienna: R Foundation for Statistical Computing; 2014. ISBN 3-900051-07-0, Available at: http://www.R-project.org. [Google Scholar]
- Ranson H, N'guessan R, Lines J, et al. Pyrethroid resistance in African anopheline mosquitoes: what are the implications for malaria control? Trends in Parasitology. 2011;27:91–98. doi: 10.1016/j.pt.2010.08.004. [DOI] [PubMed] [Google Scholar]
- Remnant EJ, Good RT, Schmidt JM, et al. Gene duplication in the major insecticide target site, Rdl, in Drosophila melanogaster. Proceedings of the National Academy of Sciences of the United States of America. 2013;110:14705–14710. doi: 10.1073/pnas.1311341110. [DOI] [PMC free article] [PubMed] [Google Scholar]
- Rogers RL, Cridland JM, Shao L, et al. Landscape of standing variation for tandem duplications in Drosophila yakuba and Drosophila simulans. Molecular Biology and Evolution. 2014;31:1750–1766. doi: 10.1093/molbev/msu124. [DOI] [PMC free article] [PubMed] [Google Scholar]
- Rousset F. genepop'007: a complete re-implementation of the genepop software for Windows and Linux. Molecular Ecology Resources. 2008;8:103–106. doi: 10.1111/j.1471-8286.2007.01931.x. [DOI] [PubMed] [Google Scholar]
- Sabeti PC, Reich DE, Higgins JM, et al. Detecting recent positive selection in the human genome from haplotype structure. Nature. 2002;419:832–837. doi: 10.1038/nature01140. [DOI] [PubMed] [Google Scholar]
- Santolamazza F, Mancini E, Simard F, et al. Insertion polymorphisms of SINE200 retrotransposons within speciation islands of Anopheles gambiae molecular forms. Malaria Journal. 2008;7:163. doi: 10.1186/1475-2875-7-163. [DOI] [PMC free article] [PubMed] [Google Scholar]
- Schlötterer C. A microsatellite-based multilocus screen for the identification of local selective sweeps. Genetics. 2002;160:753–763. doi: 10.1093/genetics/160.2.753. [DOI] [PMC free article] [PubMed] [Google Scholar]
- Schmittgen TD, Livak KJ. Analyzing real-time PCR data by the comparative C(T) method. Nature Protocols. 2008;3:1101–1108. doi: 10.1038/nprot.2008.73. [DOI] [PubMed] [Google Scholar]
- Shang Q, Pan Y, Fang K, et al. Extensive Ace2 duplication and multiple mutations on Ace1 and Ace2 are related with high level of organophosphates resistance in Aphis gossypii. Environmental Toxicology. 2014;29:526–533. doi: 10.1002/tox.21778. [DOI] [PubMed] [Google Scholar]
- Sharp BL, Ridl FC, Govender D, Kuklinski J, Kleinschmidt I. Malaria vector control by indoor residual insecticide spraying on the tropical island of Bioko, Equatorial Guinea. Malaria Journal. 2007;6:52. doi: 10.1186/1475-2875-6-52. [DOI] [PMC free article] [PubMed] [Google Scholar]
- Söding J, Biegert A, Lupas AN. The HHpred interactive server for protein homology detection and structure prediction. Nucleic Acids Research. 2005;33:W244–W248. doi: 10.1093/nar/gki408. [DOI] [PMC free article] [PubMed] [Google Scholar]
- Sonoda S, Shi X, Song D, et al. Duplication of acetylcholinesterase gene in diamondback moth strains with different sensitivities to acephate. Insect Biochemistry and Molecular Biology. 2014;48:83–90. doi: 10.1016/j.ibmb.2014.02.008. [DOI] [PubMed] [Google Scholar]
- Stephens M, Smith NJ, Donnelly P. A new statistical method for haplotype reconstruction from population data. American Journal of Human Genetics. 2001;68:978–989. doi: 10.1086/319501. [DOI] [PMC free article] [PubMed] [Google Scholar]
- Touré YT, Dolo G, Petrarca V, et al. Mark-release-recapture experiments with Anopheles gambiae s.l. in Banambani Village, Mali, to determine population size and structure. Medical and Veterinary Entomology. 1998;12:74–83. doi: 10.1046/j.1365-2915.1998.00071.x. [DOI] [PubMed] [Google Scholar]
- Ubeda J-M, Raymond F, Mukherjee A, et al. Genome-wide stochastic adaptive DNA amplification at direct and inverted DNA repeats in the parasite Leishmania. PLoS biology. 2014;12:e1001868. doi: 10.1371/journal.pbio.1001868. [DOI] [PMC free article] [PubMed] [Google Scholar]
- Untergasser A, Cutcutache I, Koressaar T, et al. Primer3–new capabilities and interfaces. Nucleic Acids Research. 2012;40:e115. doi: 10.1093/nar/gks596. [DOI] [PMC free article] [PubMed] [Google Scholar]
- Van Oosterhout C, Hutchinson WF, Wills DPM, Shipley P. micro-checker: software for identifying and correcting genotyping errors in microsatellite data. Molecular Ecology Notes. 2004;4:535–538. [Google Scholar]
- Weetman D, Wilding CS, Steen K, et al. Association mapping of insecticide resistance in wild Anopheles gambiae populations: major variants identified in a low-linkage disequilbrium genome. PLoS One. 2010;5:e13140. doi: 10.1371/journal.pone.0013140. [DOI] [PMC free article] [PubMed] [Google Scholar]
- Weill M, Lutfalla G, Mogensen K, et al. Comparative genomics: insecticide resistance in mosquito vectors. Nature. 2003;423:136–137. doi: 10.1038/423136b. [DOI] [PubMed] [Google Scholar]
- Weill M, Berthomieu A, Berticat C, et al. Insecticide resistance: a silent base prediction. Current Biology. 2004a;14:R552–R553. doi: 10.1016/j.cub.2004.07.008. [DOI] [PubMed] [Google Scholar]
- Weill M, Malcolm C, Chandre F, et al. The unique mutation in ace-1 giving high insecticide resistance is easily detectable in mosquito vectors. Insect Molecular Biology. 2004b;13:1–7. doi: 10.1111/j.1365-2583.2004.00452.x. [DOI] [PubMed] [Google Scholar]
- WHO. Test Procedures for Insecticide Resistance Monitoring in Malaria Vector Mosquitoes. Geneva: World Health Organisation; 2013. Available at: http://www.who.int/malaria/publications/atoz/9789241505154/en/. ISBN 9789241505154. [Google Scholar]
- Wiehe T. The effect of selective sweeps on the variance of the allele distribution of a linked multiallele locus: hitchhiking of microsatellites. Theoretical Population Biology. 1998;53:272–283. doi: 10.1006/tpbi.1997.1346. [DOI] [PubMed] [Google Scholar]
- Wilding CS, Weetman D, Steen K, Donnelly MJ. High, clustered, nucleotide diversity in the genome of Anopheles gambiae revealed through pooled-template sequencing: implications for high-throughput genotyping protocols. BMC Genomics. 2009;10:320. doi: 10.1186/1471-2164-10-320. [DOI] [PMC free article] [PubMed] [Google Scholar]
- Yawson AE, McCall PJ, Wilson MD, Donnelly MJ. Species abundance and insecticide resistance of Anopheles gambiae in selected areas of Ghana and Burkina Faso. Medical and Veterinary Entomology. 2004;18:372–377. doi: 10.1111/j.0269-283X.2004.00519.x. [DOI] [PubMed] [Google Scholar]
- Zheng L, Benedict MQ, Cornel AJ, Collins FH, Kafatos FC. An integrated genetic map of the African human malaria vector mosquito, Anopheles gambiae. Genetics. 1996;143:941–952. doi: 10.1093/genetics/143.2.941. [DOI] [PMC free article] [PubMed] [Google Scholar]
Associated Data
This section collects any data citations, data availability statements, or supplementary materials included in this article.
Supplementary Materials
Table S1 Details of microsatellites screened.
Table S2 Non-synonymous changes observed in Ace-1 119 wild-type haplotypes.
Fig. S1 Recombination rate across chromosome 2R estimated from data in Zheng et al. 1996.
Fig. S2 Statistical parsimony analysis of 1266 bp of coding sequence surrounding codon 119 of the Ace-1 locus.
Fig. S3 Estimation of the selection coefficient from deterministic model simulations.
Fig. S4 Allele frequency distributions at each microsatellite locus.
Fig. S5 As Fig. 3 but plotted for samples from a single location: the Accra suburb of Dzorwulu.
Fig. S6 Pairwise linkage disequilibrium (LD) heatmap between microsatellite loci.
Fig. S7 Sequencing of microsatellite Ace-5k in 119G/G individuals.
Fig. S8 Sequencing of microsatellite locus ‘Ace-5k’ in 119S/S individuals.
Data S1 Ace-1 119 genotypes and microsatellite alleles for each locus in each individual genotyped and qRT–PCR CNV analysis results. File: Weetman et al. Data S1.xlsx
Data S2 Alignment of Ace-1 haplotypes in Phylip format. File: Weetman et al. Data S2.phy (text file).
Data Availability Statement
Microsatellite and Ace-1 TaqMan genotyping data and qRT–PCT CNV analysis data are provided as supporting information in file: Weetman_et al. Data S1.xlsx. Sequence data have been submitted to GenBank with Accession nos.: KP165332–KP165384. Aligned sequences are also provided as supporting information in file: Weetman_et al. Data S2.phy.