Abstract
We developed a computational approach to detect and segment cytoplasm in microscopic images of muscle fibers. The computational approach provides computer-aided analysis of cytoplasm objects in muscle fiber images to facilitate biomedical research. Cytoplasm in muscle fibers plays an important role in maintaining the functioning and health of muscular tissues. Therefore, cytoplasm is often used as a marker in broad applications of musculoskeletal research, including our search on treatment of muscular disorders such as Duchenne muscular dystrophy, a disease that has no available treatment. However it is often challenging to analyze cytoplasm and quantify it given the large number of images typically generated in experiments and the large number of muscle fibers contained in each image. Manual analysis is not only time consuming but also prone to human errors. In this work we developed a computational approach to detect and segment the longitudinal sections of cytoplasm based on a modified graph cuts technique and iterative splitting method to extract cytoplasm objects from the background. First, cytoplasm objects are extracted from the background using the modified graph cuts technique which is designed to optimize an energy function. Second, an iterative splitting method is designed to separate the touching or adjacent cytoplasm objects from the results of graph cuts. We tested the computational approach on real data from in vitro experiments and found that it can achieve satisfactory performance in terms of precision and recall rates.
Keywords: muscle fiber images, cytoplasm, graph cuts, image segmentation, iterative splitting
INTRODUCTION
Muscular disorders refer to a large family of various muscular diseases of which many have no effective treatment, despite the vast effort that has been dedicated to this field. While there are many causes of muscular disorders, some are genetic and others are infectious or due to injury, one common phenotype of these disorders is the deformation and loss of muscle fibers. As such, examining and evaluating the morphology of muscle fibers under microscopes is critical in advancing both research and clinical progress because the normality of muscle fiber morphology is an important biomarker of the health of the fibers.
Muscle fibers are multi-nucleated cells that have elongated shapes of an ellipsoid. In cell assay a typical image contains dozens to hundreds of muscle fibers and a single experiment may generate hundreds of such images. Manually analyzing the amount of images proves to be a highly difficult if not impossible task. Adding to the long time required in manual analysis is the inevitable human error and observer’s variation in the process. Therefore there is an urgent need and broad applicability to develop computer-aided analysis of muscle fiber images. Computerized analysis can detect and quantify muscle fiber morphology in a quick, objective and repeatable manner. In this work we developed an integrated computational approach to detect, segment and quantify cytoplasm along the longitudinal directions of muscle fibers.
Cytoplasm of muscle fibers plays an important role in determining the proper functioning and health of muscular tissues (Liu et al., 2012, Bruusgaard et al., 2003). For example, the ratio of nuclei to cytoplasm in muscle fibers is a key biomarker widely used in studies of muscular dystrophies and other muscular disorders (Cohn and Campbell, 2000, Jungbluth et al., 2008, Puckelwartz and McNally, 2011). However, currently there lacks appropriate computational methods to analyze cytoplasm of muscle fibers, particularly along the longitudinal direction of the muscle fibers as published works often focus on the cross sections of muscle fibers or their nuclei. For example, a recent work by Janssens et al. employed supervised trained classifier approach to quantify and analyze cross sections of muscle fibers (Janssens et al., 2013). A work by Su et al. proposed a method of an ellipse fitting and sparse representation, followed by a mean-shift algorithm, to detect nuclei in single muscle fiber (Su et al., 2014). Only recently a work by Comin et al. presented an image processing pipeline consisting of thresholding, refilling of small holes caused by nuclei and calculating the skeleton to detect the longitudinal sections of muscle fibers (Comin et al., 2014). As muscle fiber image processing is closely related to other types of cellular image analysis and processing we next briefly review some techniques that are commonly used in this broad field.
Over the last several decades much effort has been dedicated to cellular image processing as many techniques have been developed to process different types of cells. Usually segmentation of cells or nuclei is carried out as the first step. Some popular segmentation techniques and their modifications include intensity thresholding such as Otsu’s method (Otsu, 1979), iterative thresholding (Cai et al., 2014, Wu et al., 2000), mean shift method (Debeir et al., 2005), sliding band filter (Quelhas et al., 2010), edge detection (Wahlby et al., 2004), and watershed and level set algorithms (Nath et al., 2006, Mukherjee et al., 2004). The success of these techniques depends on several factors of the underlying images, including their homogeneity, signal-to-noise ratio (SNR), and potential artifacts. For example, to overcome the limitation of over-segmentation of the watershed method, marker-assisted watershed techniques have been proposed to improve the performance (Koyuncu et al., 2012, Yang et al., 2006). Following segmentation, morphological analysis is often needed to extract useful information from the cellular images (Plissiti et al., 2011, Amini et al., 2010). At this step morphological analysis generally serves two purposes. First, it is often necessary to use morphological operations to improve upon the result of segmentation. As no segmentation algorithms can produce perfect results, particularly when there are artifacts in the images or when the objects of interest are of different shapes or located in close adjacency, the segmentation results can be remedied by judicious application of morphological operations. Second, morphological analysis is applied to measure important features about the cells or nuclei, such as their sizes, diameters, spatial distribution, and movement. Given the large variations in the imaging processes and the different purpose of the underlying experiments, the design and selection of an image processing algorithm often depends on the biological questions to be addressed.
In this paper we proposed a computational approach to detect and segment longitudinal sections of muscle fibers from cell assays. At the first step, a modified graph cuts technique was developed to extract cytoplasm from the background of fluorescent microscopic images. We provided a new function model suitable for expressing regional term of graph cuts energy and added appropriate hard constraint to the energy. At the second step, a series of geometric and morphological analysis operations was designed to iteratively separate individual objects of cytoplasm. We tested our method on real image data and found that it can achieve good performance in terms of precision and recall rate.
MATERIALS AND METHODS
Cell Assay and Microscopic Imaging
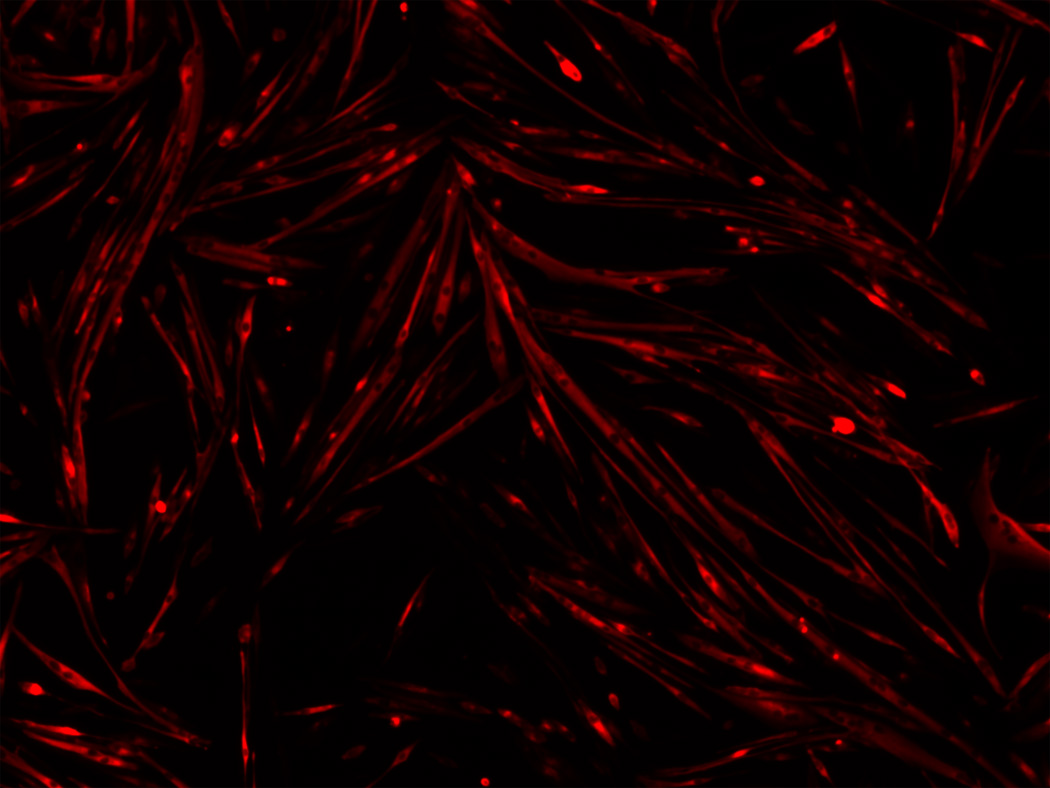
The primary myoblasts were harvested from hind limb muscles of 4-week old C57BL/10 male mice as described in (Rando and Blau, 1994) and expanded in Ham’s F10 medium supplemented with 20% fetal calf serum and 5ng/ml basic fibroblast growth factor on collagen-coated plates. After clone culture, we identified the myoblasts with anti-desmin antibody through immunocytochemistry. To induce myogenic differentiation of the cultured myoblasts, we replaced the growth medium with differentiation medium (DMEM with 2% horse serum) after the percentage of coverage reached over 70%. For immunostaining, the differentiated cells were fixed with 4% paraformaldehyde for 30 minutes at 4°C, washed and treated with 0.5% Triton-X 100 in phosphate buffered saline for 5 minutes at room temperature. We next incubated the cells with primary antibody Myosin Heavy Chain (MHC) diluted in 1:50 followed by incubating the cells with a CyTm3-conjugated secondary antibody diluted in 1:500. And the nuclei were counter-stained with 4, 6 diamidino-2-phenylindole (DAPI). Pictures were obtained using an Olympus fluorescence microscope with a 10× magnification for objective lens and 1× for eyepiece lens. The pixel size is 0.76um and the size of each image 1200×1600 pixels. The original images were acquired in a three-channel RGB format with a bit-depth of 8 for each channel. In this work we worked with the MHC channel that shows the cytoplasm signal. Here we note that the cytoplasm channel may contain some interference from other channels. A typical image in the MHC channel is displayed in Figure 1. All the animal-based experiments have been approved by the institutional animal care and use committee of the Harvard Medical School.
Figure 1.
A typical cytoplasm image of muscle fibers captured in the MHC channel.
Computational Approach
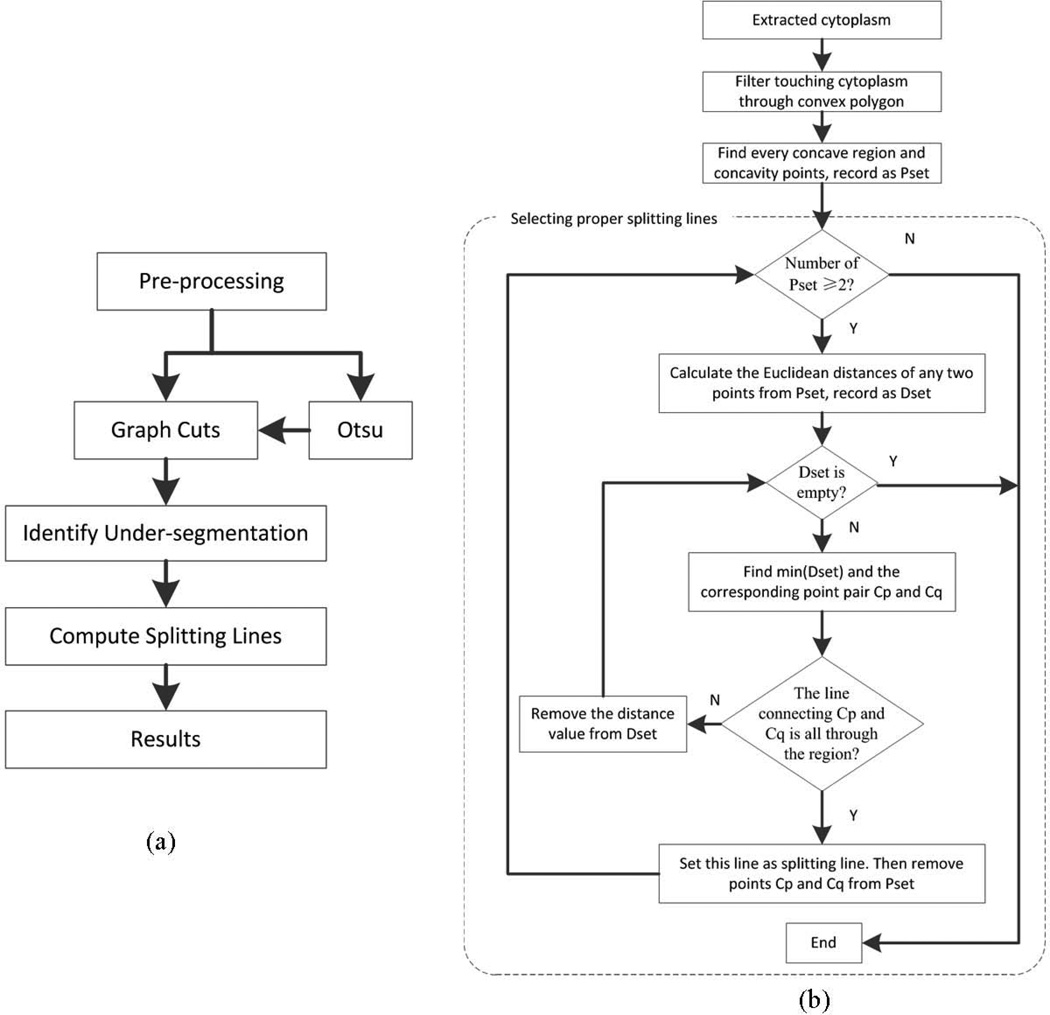
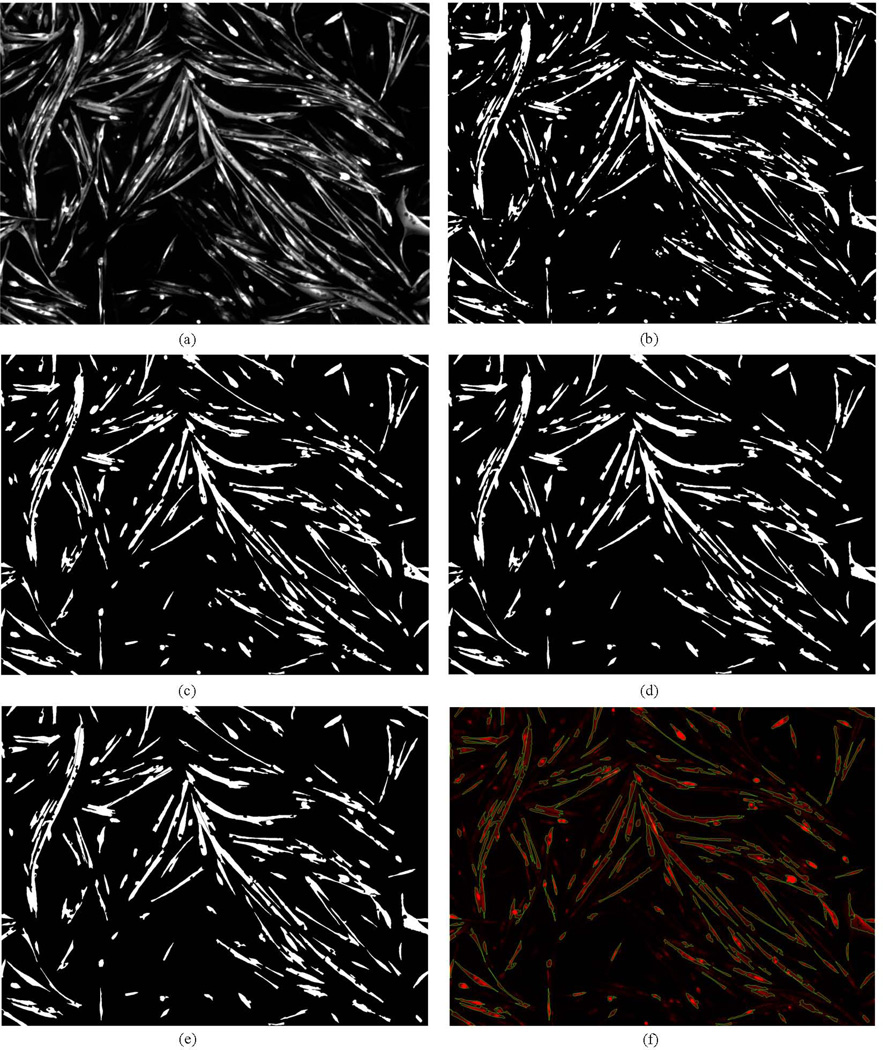
From a computational perspective, there are two primary challenges in detecting and segmenting cytoplasm objects. The first challenge is to detect cytoplasm objects in the presence of low contrast and sometimes uneven illumination in the images. The second challenge is to correctly separate touching or adjacent objects to derive accurate final results. We designed our computational approach to address the two challenges. The pipeline of our proposed method is presented in Figure 2(a). The grayscale image was obtained by extracting the red component of the RGB color image. Then, the grayscale image was processed to enhance the contrast of cytoplasm objects because the gray level distribution is uneven. Specifically we adjusted the intensity value of the images by the method of image contrast stretching. The enhanced cytoplasm objects of Figure 1 are shown in Figure 3(a).
Figure 2.
(a) The pipeline of the proposed method of this paper. (b) The flowchart of splitting touching cytoplasm step.
Figure 3.
(a) The enhanced image after preprocessing. (b) The binarized image after using Otsu's method. (c) The area filtering result of (b). (d) The binarized image of (a) after using graph cuts method. (e) The segmentation result by the proposed iterative splitting method. (f) The superimposed result, the green color represents the boundary of single cytoplasm objects.
Graph Cuts based Segmentation
A major step in our approach is graph cuts based segmentation of cytoplasm objects. Graph cuts technique is a recently developed algorithm based on graph theory. The object could be extracted optimally because graph cuts algorithm incorporates both boundary term and regional term (Boykov and Funka-Lea, 2006, Boykov and Kolmogorov, 2004). Methods based on graph cuts are robust and are suitable for solving many difficult problems, such as some complicated objects could not be expressed only through region based method nor boundary based method.
A graph is defined as a set of nodes and a set of edges with each edge connecting two nodes. It can be written as
| (1) |
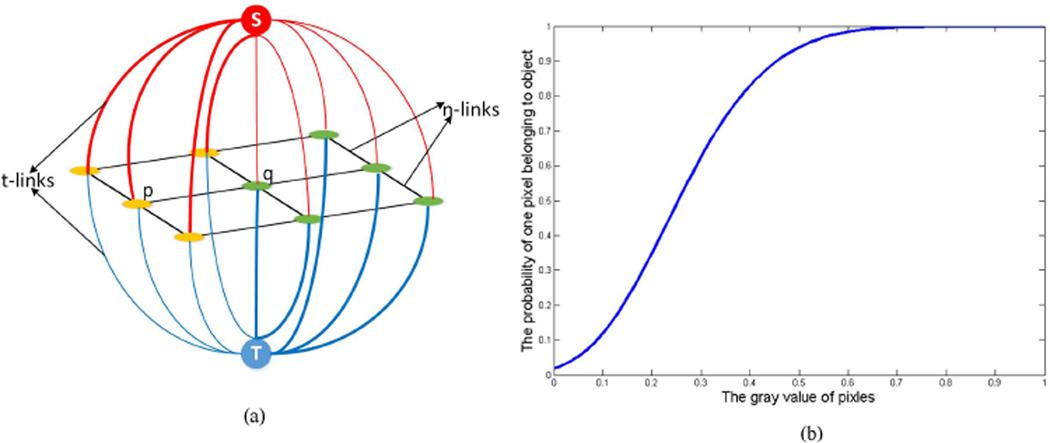
where G represents the graph, V and E represent its nodes and edges, respectively. Typically, the nodes have two special terminal nodes S and T, representing the object label and the background label, respectively. The edges connecting neighborhood nodes are called "n-links", while the edges connecting a terminal node are called "t-links" (Boykov and Funka-Lea, 2006), illustrated as Figure 4(a). An s-t cut is defined as a subset of edges C ⊂ E such that S and T become completely separated on the induced graph G(C) =<V, E\C>. Our goal in this work is to obtain a best cut that could give an optimal segmentation in the cytoplasm image.
Figure 4.
(a) The constructed graph model. (b) The probability of a pixel belonging to a cytoplasm object versus its grayscale value.
We create a graph through the image, the pixels and two terminal nodes foreground S and background T constitute the nodes, and the relationships between the pixel and terminal nodes as well as relationships between pixels constitute the edges. Here we only consider 4-adjacency neighborhood about the relationship between pixels. If we set a value to every edge evaluating the relationships, then we will constitute an energy function
| (2) |
where A is a vector and defines a segmentation, R(A) is the regional term, i.e., the "t-links", and B(A) is the boundary term, i.e., the "n-links". And λ (λ≥0) is a weight controlling the balance between the regional term and the boundary term. The bigger λ is, the ratio of the boundary term is less, and the result would be more discontinuous and over-segmentation phenomena will be more serious. It has been shown that minimization of energy E(A) is guaranteed to converge (Kolmogorov and Zabin, 2004). And
| (3) |
| (4) |
where Rp(S) and Rp(T) represent the probability of a pixel p belonging to terminal node S and T, respectively. p ∈ T and p ∈ S represent the pixel, after the segmentation, belongs to background and foreground, respectively. Bp,q represents the similarity degree of pixel p and pixel q, and pixels p and q should be in the 4-connected neighborhood N. By definition, the more similar pixels p and q are, such as the gray values of p and q are the same, the larger the value Bp,q is. The more likely that p belongs to a terminal node S or T, the larger the value of Rp(S) or Rp(T) is.
The regional term is usually related to the intensity of a pixel. In this paper, we constructed a function module based on Radial Basis Function (RBF) (Salah et al., 2011) to express Rp as
| (5) |
where I is the intensity of pixel p. The intensity of the image was normalized to [0, 1] by linear transformation. t could be thought as the center or basis, and t equals 1 when computing the probability of a pixel belonging to the object Rp(S). Likewise, when computing the probability of a pixel belonging to the background Rp(T), t equals 0. a and b are adjustable parameters, and we set a to 6 and b to 0.5 in this paper. The probability of a pixel belonging to cytoplasm objects can be seen from Figure 4(b). The horizontal axis represents the gray value of a pixel, and the vertical axis represents the probability of the pixel belonging to the cytoplasm objects, i.e., Rp(S). A larger b corresponds to a higher probability. The slope of the curve will be steeper and the probability difference of high gray level and low gray level will be larger if a is bigger.
The boundary term is usually related to the distance between pixels and the intensity difference. To compute the boundary term we employed a Gaussian function
| (6) |
where dist(p,q) is the Euclidean distance between two pixels p and q. The graph is 4-connected neighborhood in this paper, so the distance of every pixel pair is same and dist(p,q) equals 1 everywhere. σ is the standard deviation of intensity values in the cytoplasm image. Ip and Iq represent the gray value of pixel p and q, respectively.
Imposing a Constraint in Graph Cuts based Segmentation
Graph cuts method has an advantage of incorporating lots of information to its energy function, such as a priori information of the image, shape or other features of the object. In this paper, we exploit this advantage of graph cuts by introducing area, which is obtained by Otsu's method (Otsu, 1979), as a constraint on the graph cuts based segmentation. We applied Otsu's thresholding method to the grayscale image and then obtain a binarized image. In the binarized image the larger regions tend to be cytoplasm and smaller regions tend to be artifacts, mainly caused by the influence of cell nuclei.
Based on the fact that nuclei are much smaller than the size of cytoplasm we set a threshold to filter out small regions considered to be nuclei. In our previous work we developed a technique to detect and segment nuclei in a different channel of images from the same muscle fiber specimen (Guo et al., 2014). We then calculated the average area of nuclei and denote it as the threshold Tarea. Next we compared the area of regions in the binarized cytoplasm images to Tarea. If the area of a region is larger than 2Tarea, then we set all the values of Rp(T) of the pixels in this region to be 1/10,000 times of their original values. If the area of a region is smaller than Tarea, then we set all the values of Rp(S) of the pixels in this region to be 1/10,000 times of their original values. Here the reason of setting the weight to be 1/10,000 is to reduce the value as small as possible but not to be zero.
After constructing the regional term and boundary term, and modifying the regional term according to the hard constraint, we obtain the energy function E(A). To achieve an optimal segmentation defined by the cut, our goal now is to minimize energy E(A). And the energy could be minimized by the min-cut/max-flow theory (Boykov and Kolmogorov, 2004, Kolmogorov and Zabin, 2004). After the minimization, the cytoplasm would be extracted and shown as foreground in the resulting binarized images. As there are many "holes" in the extracted cytoplasm objects due to the staining of nuclei in the DAPI channel, we filled them with a morphological operation of region filling. After applying the graph cuts step, we obtained the binarized image of Figure 1, which is shown in Figure 3(d).
Iterative Splitting Method
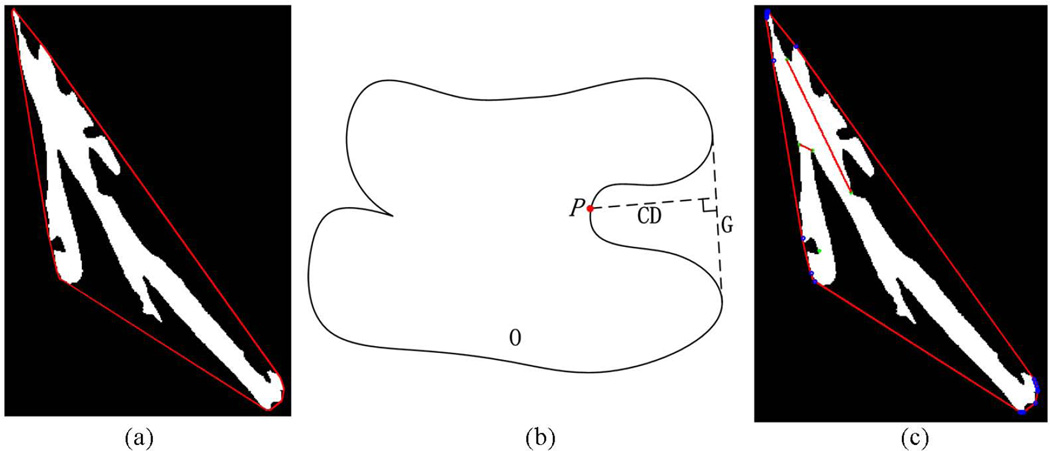
Due to the limited resolution and the point spread function of microscopes and the fact that some muscle fibers are located close to each other there are cases that the segmented objects appear touching or adjacent to others. To address this challenge for accurate separation of cytoplasm objects we develop an iterative splitting method to split touching and adjacent cytoplasm objects. This approach is based on the observation that the touching points of two or multiple adjacent cytoplasm objects are on the concave points of their joint region. To split the touching cytoplasm, the first step is to identify the touching ones. The second step is to identify the line, called splitting line, that legitimately separate two touching objects. We treat every connected region, such as regions in Figure 3(d), as one region and find the smallest convex polygon G that can contain the region. If the region has two or more cytoplasm objects, then the edge of the polygon will be somehow far away from the boundary of the region and then there is a blank area between the region and polygon. So, our method of filtering the touching cytoplasm is realized via an area threshold. If the area of the polygon is k times larger than the area of foreground region, then this region is considered having two or more touching cytoplasm objects, where k is a positive parameter measuring area and should be larger than 1, and we set k equals 1.2 in this work. A k that is too small will result in large number of isolated cytoplasm objects and may cause a high rate of false positives. Figure 5(a) shows such an example of a foreground region considered to have multiple cytoplasm objects.
Figure 5.
(a) An example showing the steps of separating adjacent cytoplasm objects. The red lines represent the smallest convex polygon containing the object. (b) The illustration of concavity depth. P is a pixel on the boundary of object O and G is the corresponding polygon edge, CD is the vertical line from P to G. (c) The selected splitting lines of (a). The green points are the concavity points and the red lines inside the region are the splitting lines.
After identifying a touching cytoplasm object O, the next step is to find proper splitting lines to separate individual objects based on the proposed iterative splitting method. The flowchart of Figure 2(b) shows the steps of finding splitting lines to separate touching cytoplasm objects. First, the boundary of object O is extracted from the resulting images given by the graph cuts method. Two adjacent vertices of a convex polygon of Figure 5(a), the polygon segment enclosed by the two vertices, and the boundary between them will constitute a concave region. Second, the concavity point P is found in the concave region, and P is defined as a point on the boundary which has the biggest concavity depth (CD) value and the value should be greater than a threshold CDT. CD is defined as the Euclidean distance from the point on the boundary to the polygon segment (Kumar et al., 2006). Its calculation is illustrated in Figure 5(b). By definition the larger the CD the deeper the convexity is at point P (Rosenfeld, 1985). Then all the concavity points of object O are identified and denoted as Pset. The connecting lines of concavity points will constitute potential splitting lines. The following steps show the process of screening real splitting lines. All the Euclidean distances between any two points from Pset are computed and recorded as Dset and the distances are also the length of line segments which connecting two concave points. Then the smallest distance from Dset is found. The connecting line, with this smallest distance which connecting two concavity points, is considered as the splitting line if the line is fully contained in the binarized object. After that the two points from Pset are removed and re-compute Dset and re-select the smallest distance from Dset. If the line goes out from the object, then remove the distance value from Dset and re-select the smallest distance. These steps iterate until the number of Pset is smaller than 2 or the number of Dset is 0. At last all the screened segments constitute the real separating lines of the object. Here we set CDT equals 10. If CDT is too small, the number of screened concavity points will be large and some of them would be false positives. If CDT is too large, some true concavity points would be missed. Figure 5(c) shows the concavity points and the filtered splitting lines of the cytoplasm object of Figure 5(a).
RESULTS
Figure 3(f) shows a segmentation result by the proposed method. From which we can see that the cytoplasm objects are well extracted from the background and touching cytoplasm objects are separated through the subsequent processing steps.
To evaluate the method, we tested our approach on real images from a muscular dystrophy experiment and computed its performance. Overall there are more than 1,500 cytoplasm objects in ten images in our test. We used both precision and recall rate to evaluate the final result and the area-constrained graph cuts method. And we also validated the results with manual analysis in terms of accuracy. In this work accuracy is defined as
| (7) |
where Nmanual is the number of cytoplasm objects in one image obtained by manual analysis and Nauto is the number of cytoplasm objects given by the computational approach. We obtained true positives (TP), false positives (FP), and false negatives (FN) for each image. TP is the number of true cytoplasm in the extracted image. FP is the number of objects incorrectly identified as cytoplasm and it also includes over-segmentation, i.e., one cytoplasm is split into two or more cytoplasm. FN is the number of cytoplasm objects missed by the approach and also includes under-segmentation, i.e., two or more cytoplasm objects are considered as one object. Precision is the ratio of TP over the number of automatically identified cytoplasm objects (Nauto) in one image such that
| (8) |
By definition, Nauto equals TP plus FP and Nmanual equals TP plus FN. While precision evaluates the identified result, the recall rate evaluates the identification ability. Recall rate is calculated as the ratio of TP over Nmanual in one image
| (9) |
The overall performance of the proposed method is shown in Table 1. The average accuracy is 93.3% and all the values are consistently above than 90%, so we can conclude that the proposed method achieved a high accuracy. The average precision is 96.9% and 9 of 10 images are higher than 95%. And the average recall rate is 90.0% and 8 of 10 images are higher than 89%.
Table 1.
The overall performance of the proposed method on the cytoplasm images.
| Image No. | 1 | 2 | 3 | 4 | 5 | 6 | 7 | 8 | 9 | 10 |
|---|---|---|---|---|---|---|---|---|---|---|
| Nmanual | 195 | 231 | 189 | 205 | 126 | 138 | 106 | 155 | 52 | 164 |
| Nauto | 180 | 209 | 171 | 185 | 117 | 131 | 98 | 145 | 50 | 164 |
| Accuracy (%) | 92.31 | 90.48 | 90.48 | 90.24 | 92.86 | 94.43 | 92.45 | 93.55 | 96.15 | 100.00 |
| Precision (%) | 98.89 | 99.04 | 99.42 | 96.76 | 96.58 | 96.95 | 100.00 | 97.24 | 88.00 | 95.73 |
| Recall Rate (%) | 91.28 | 89.61 | 89.95 | 83.72 | 89.68 | 92.03 | 92.45 | 90.97 | 84.62 | 95.73 |
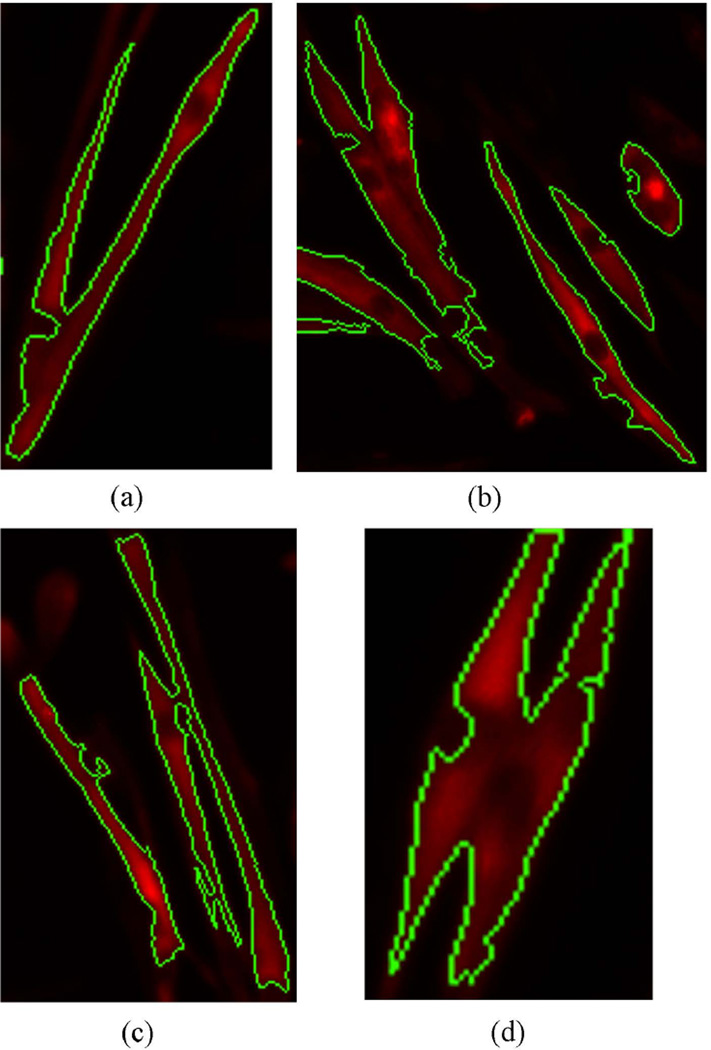
And we also list the performance of graph cuts step in Table 2. The average accuracy, precision and recall rate is 96.5%, 99.9% and 96.6% respectively. From the distribution of values, we can conclude that the graph cuts step can extract cytoplasm from background with a high reliability. Figure 6 shows some examples by using the graph cuts step. As can be seen from the figure, the cytoplasm objects are extracted from the background with a relatively accurate boundary. From the figure, we can see the intensity inhomogeneity within the extracted cytoplasm object. The graph cuts method contains a boundary term which considering the consistency of neighborhood pixels and so it could eliminate the influence of uneven intensity.
Table 2.
The performance of graph cuts step on the extraction step.
| Image No. | 1 | 2 | 3 | 4 | 5 | 6 | 7 | 8 | 9 | 10 |
|---|---|---|---|---|---|---|---|---|---|---|
| Accuracy (%) | 96.09 | 94.33 | 93.60 | 92.89 | 97.54 | 99.27 | 98.97 | 96.93 | 96.10 | 99.50 |
| Precision (%) | 100.00 | 99.57 | 100.00 | 100.00 | 100.00 | 99.28 | 100.00 | 100.00 | 100.00 | 100.00 |
| Recall Rate (%) | 96.09 | 93.93 | 93.60 | 92.89 | 97.54 | 100.00 | 98.97 | 96.93 | 96.10 | 99.50 |
Figure 6.
Examples showing the extracted cytoplasm by the area-constrained graph cuts method. The green color represents the boundary of cytoplasm.
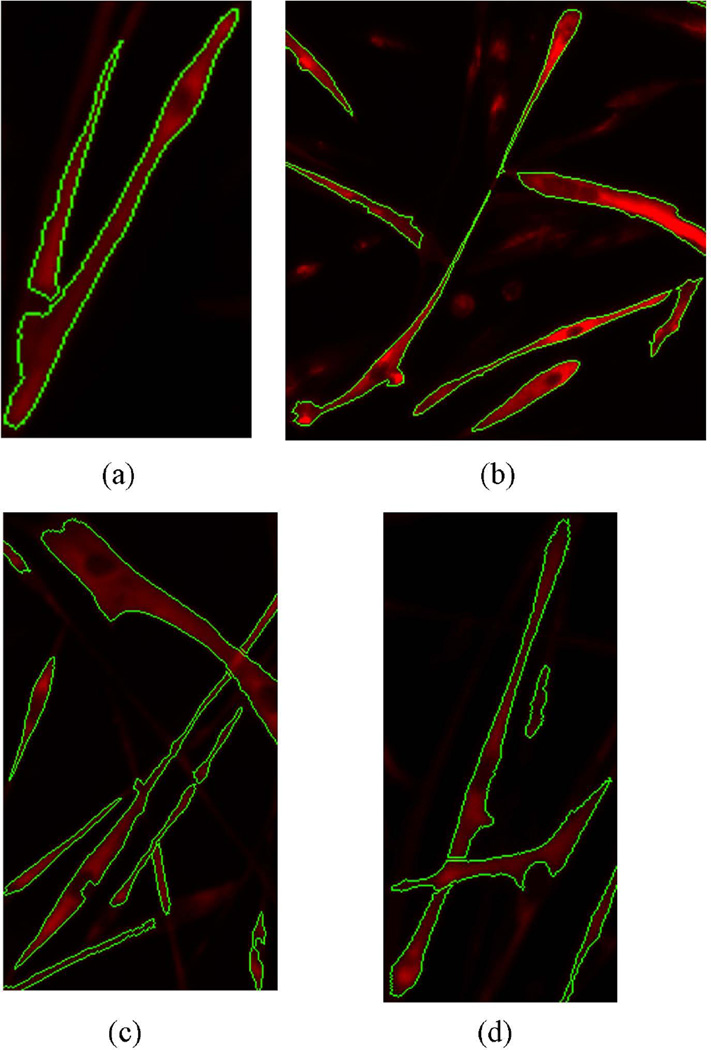
Figure 7 shows some examples of final results given by the computational approach. We observe that cytoplasm objects are extracted while the artifacts are removed. And the touching cytoplasm objects are separated well by the selected splitting lines. But there are still some problems to be addressed, such as if one cytoplasm is intersected by another, after the splitting one intersecting cytoplasm would be separated into two objects. The broken cytoplasm should be connected again and this is what we will improve in the future work.
Figure 7.
Examples showing the final segmentation results by the proposed method after iterative splitting of adjacent objects.
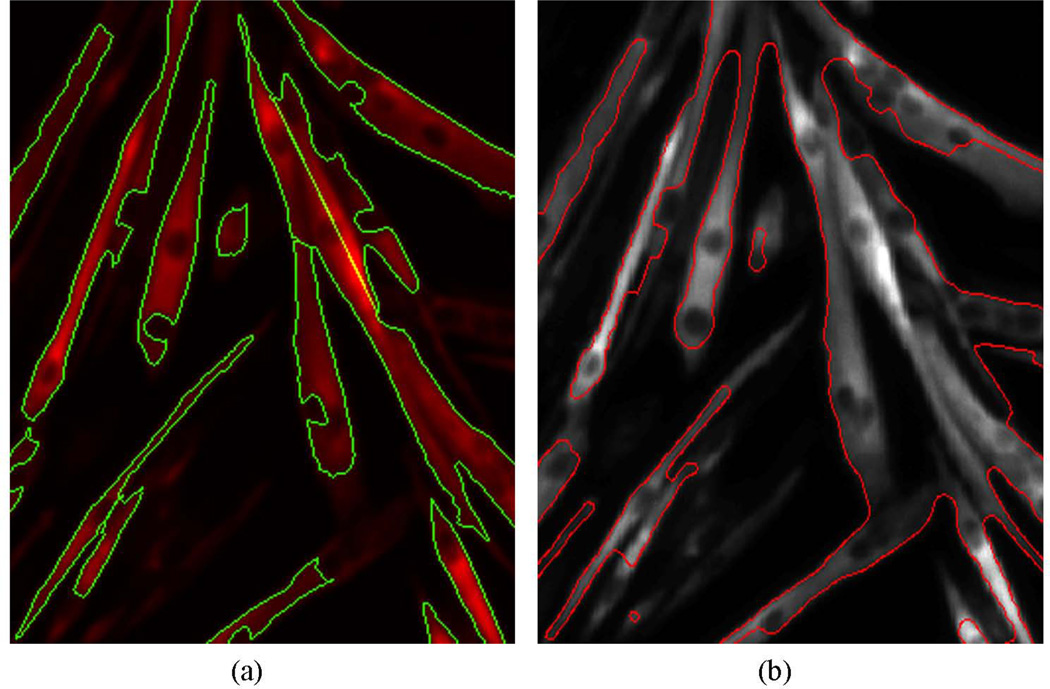
For a comparison of our method with existing algorithms, we used a level set method proposed by (Chunming et al., 2005) for benchmarking. Figure 8 compares the results given by our method and the level set method. It seems that the level set method would capture more cytoplasm parts than the proposed method and give boundaries that are smoother than the proposed method. The limitation of the level set method is that one needs to set the number of iterations to achieve satisfactory results. Another concern about level set methods is the high computational complexity and relatively long time they take. In comparison, the proposed graph cuts method is computationally fast and can handle multiple objects, in contrast, level set methods are usually best suited to to extract single or a small number of objects. We note that in our case each image contains multiple objects and the overall task is to process a large number of such images generated in a single experiment. So a suitable algorithm should be considered to process this type of images for both high accuracy and efficiency.
Figure 8.
Comparison of extracted cytoplasm given by the proposed method (a) and level set method (b).
DISCUSSION
In this paper, we proposed a computational approach to detect and segment cytoplasm of muscle fiber from fluorescence microscopic images by employing graph cuts to identify cytoplasm signals and an iterative splitting method to accurately separate them. Measurement of cytoplasm is important to elucidate many biological processes in musculoskeletal research as the intactness of cytoplasm reflects the health of muscle fibers. Given the large number of muscle fibers contained in a typical microscopic image manual analysis is often not feasible. As such computerized analysis is of significant benefit to advance our understanding of muscle fibers and their cellular processes. Our approach consists of two main steps to first extract cytoplasm objects from the images using a modified graph cuts method and second accurately separate touching objects by iterative splitting method. We take advantage of the longitudinal shape of muscle fibers and impose an area constraint to design a modified graph cuts method. Graph cuts methods have the advantage to separate an image into two classes, foreground and background and have been used in cellular image processing. For example, Danek et al. (Danek et al., 2009) used a two-stage graph cuts model to segment touching cell nuclei, in the first stage the nuclei are extracted from the background and touching nuclei are separated in the second stage. Al-Kofahi et al. proposed a method that utilizes graph cuts twice to first binarize a nuclei image and then reduce computational complexity in identifying nuclear seed points (Al-Kofahi et al., 2010). Graph cuts based active contour methods have also been developed to segment nuclei images (Chen et al., 2008). However the special type of the cytoplasm images has unique challenge in image processing such that some cytoplasm objects may overlap or touch others in the images and graph cuts method alone is insufficient to separate them. Adding to the challenge of separating adjacent cytoplasm objects there is other interference in the images, i.e., the artifacts from the nuclei channel. As the muscle specimen were stained and prepared for multi-channel imaging to reveal both cytoplasm and nuclei there are, inevitably, interference from one channel to the other channel of images. This is evident in Figure 1, from which we can observe small regions that are actually from the nuclei channel or due to imperfect slice preparation. Therefore, we reduce interference from the artifacts by comparing areas of regions to a preset threshold to constrain graph cuts in cytoplasm segmentation. This step utilizes the prior information from muscle cell biology that the nuclei are much smaller than the area of cytoplasm of a muscle fiber. Here we note that because muscle fibers are multi-nucleated cells, we cannot derive a one-to-one mapping between the number of nuclei to the number of cytoplasm objects in constraining the graph cuts process. However, we observed that our area-constrained graph cuts approach is able to achieve satisfactory performance in identifying cytoplasm. Our next challenge was to separate adjacent cytoplasm objects for accurate segmentation.
So, following the area-constrained graph cuts method an iterative splitting method is applied to separate touching objects to obtain the final segmentation result. In designing the iterative splitting method we exploit the fact that geometrically two touching cytoplasm objects always form a concavity connection at their intersection. So the splitting method searches for concavity points along the boundary of any binarized objects obtained from the graph cuts method and the concavity points constitute many potential separating lines. We then analyze and iteratively filter out lines that are not considered as the optimal splitting lines. The final segmentation results are created by separating touching objects along the legitimate splitting lines. We applied our method on real image data acquired in an in vitro experiment that was designed to study the viability of muscle fibers in a muscular dystrophic project. Based on the analysis of more than 1,500 cytoplasm objects we found that the proposed approach can achieve satisfactory performance as validated by manual analysis. Hence we conclude that the proposed approach can provide computerized analysis to greatly reduce the time and human effort required in manual analysis of complex muscle fiber images at high objectivity.
Overall our approach, first, takes advantage of the prior biology information about muscle fiber cytoplasm and nuclei to remove artifacts and, second, utilizes shape analysis to accurately separate adjacent cytoplasm objects. The analysis results can then be quantified to provide detailed information about muscle fiber morphology to corroborate with other experiments in our search for treatment of musculoskeletal disorders. Our future work will focus on improving the algorithms to achieve more accurate results in more challenging scenarios. Finally we note that as a computational technique the proposed approach can be used in combination with other measurements to address profound biological questions. For example, together with nuclei detection and segmentation (Guo et al., 2014) we can derive the nuclei-to-cytoplasm ratio, which is an important biomarker used in many musculoskeletal experiments.
ACKNOWLEDGMENTS
The work of X. Xu was supported by NIH award R01LM011415 and NSF award 0958345. The work of Z. Yang was supported by the National Natural Science Foundation of China (31171148). The work of Y. Wang was supported by NIH award K02AR051181. The work of S. Xia was supported by the National Key Technology Support Program (2012BAI10B04).
Footnotes
The authors declare no conflict of interest.
REFERENCES
- Al-Kofahi Y, Lassoued W, Lee W, Roysam B. Improved automatic detection and segmentation of cell nuclei in histopathology images. IEEE Trans Biomed Eng. 2010;57:841–852. doi: 10.1109/TBME.2009.2035102. [DOI] [PubMed] [Google Scholar]
- Amini S, Veilleux D, Villemure I. Tissue and cellular morphological changes in growth plate explants under compression. J Biomech. 2010;43:2582–2588. doi: 10.1016/j.jbiomech.2010.05.010. [DOI] [PubMed] [Google Scholar]
- Boykov Y, Funka-Lea G. Graph cuts and efficient N-D image segmentation. International Journal of Computer Vision. 2006;70:109–131. [Google Scholar]
- Boykov Y, Kolmogorov V. An experimental comparison of min-cut/max- flow algorithms for energy minimization in vision. Pattern Analysis and Machine Intelligence, IEEE Transactions on. 2004;26:1124–1137. doi: 10.1109/TPAMI.2004.60. [DOI] [PubMed] [Google Scholar]
- Bruusgaard JC, Liestol K, Ekmark M, Kollstad K, Gundersen K. Number and spatial distribution of nuclei in the muscle fibres of normal mice studied in vivo. J Physiol. 2003;551:467–478. doi: 10.1113/jphysiol.2003.045328. [DOI] [PMC free article] [PubMed] [Google Scholar]
- Cai H, Yang Z, Cao X, Xia W, Xu X. A new iterative triclass thresholding technique in image segmentation. IEEE Trans Image Process. 2014;23:1038–1046. doi: 10.1109/TIP.2014.2298981. [DOI] [PubMed] [Google Scholar]
- Chen C, Li H, Zhou X, Wong ST. Constraint factor graph cut-based active contour method for automated cellular image segmentation in RNAi screening. J Microsc. 2008;230:177–191. doi: 10.1111/j.1365-2818.2008.01974.x. [DOI] [PMC free article] [PubMed] [Google Scholar]
- Chunming L, Chenyang X, Changfeng G, Fox MD. Level set evolution without re-initialization: a new variational formulation. Computer Vision and Pattern Recognition, 2005. CVPR 2005; IEEE Computer Society Conference on; 20–25 June 2005; 2005. pp. 430–436. [Google Scholar]
- Cohn RD, Campbell KP. Molecular basis of muscular dystrophies. Muscle Nerve. 2000;23:1456–1471. doi: 10.1002/1097-4598(200010)23:10<1456::aid-mus2>3.0.co;2-t. [DOI] [PubMed] [Google Scholar]
- Comin CH, Xu X, Wang Y, Da Fontoura Costa L, Yang Z. An image processing approach to analyze morphological features of microscopic images of muscle fibers. Comput Med Imaging Graph. 2014 doi: 10.1016/j.compmedimag.2014.07.003. [DOI] [PMC free article] [PubMed] [Google Scholar]
- Danek O, Matula P, Ortiz-De-Solorzano C, Munoz-Barrutia A, Maska M, Kozubek M. Segmentation of Touching Cell Nuclei Using a Two-Stage Graph Cut Model. In: Salberg AB, Hardeberg JY, Jenssen R, editors. Image Analysis, Proceedings. Berlin: Springer-Verlag Berlin; 2009. [Google Scholar]
- Debeir O, Van Ham P, Kiss R, Decaestecker C. Tracking of migrating cells under phase-contrast video microscopy with combined mean-shift processes. IEEE Trans Med Imaging. 2005;24:697–711. doi: 10.1109/TMI.2005.846851. [DOI] [PubMed] [Google Scholar]
- Guo Y, Xu X, Wang Y, Wang Y, Xia S, Yang Z. An image processing pipeline to detect and segment nuclei in muscle fiber microscopic images. Microscopy Research and Technique. 2014;77:547–559. doi: 10.1002/jemt.22373. [DOI] [PubMed] [Google Scholar]
- Janssens T, Antanas L, Derde S, Vanhorebeek I, Van Den Berghe G, Grandas FG. CHARISMA: An integrated approach to automatic H&E-stained skeletal muscle cell segmentation using supervised learning and novel robust clump splitting. Medical Image Analysis. 2013;17:1206–1219. doi: 10.1016/j.media.2013.07.007. [DOI] [PubMed] [Google Scholar]
- Jungbluth H, Wallgren-Pettersson C, Laporte J. Centronuclear (myotubular) myopathy. Orphanet J Rare Dis. 2008;3:26. doi: 10.1186/1750-1172-3-26. [DOI] [PMC free article] [PubMed] [Google Scholar]
- Kolmogorov V, Zabin R. What energy functions can be minimized via graph cuts? Pattern Analysis and Machine Intelligence, IEEE Transactions on. 2004;26:147–159. doi: 10.1109/TPAMI.2004.1262177. [DOI] [PubMed] [Google Scholar]
- Koyuncu CF, Arslan S, Durmaz I, Cetin-Atalay R, Gunduz-Demir C. Smart markers for watershed-based cell segmentation. PLoS One. 2012;7:e48664. doi: 10.1371/journal.pone.0048664. [DOI] [PMC free article] [PubMed] [Google Scholar]
- Kumar S, Ong SH, Ranganath S, Ong TC, Chew FT. A rule-based approach for robust clump splitting. Pattern Recognition. 2006;39:1088–1098. [Google Scholar]
- Liu GH, Qu J, Suzuki K, Nivet E, Li M, Montserrat N, Yi F, Xu X, Ruiz S, Zhang W, Wagner U, Kim A, Ren B, Li Y, Goebl A, Kim J, Soligalla RD, Dubova I, Thompson J, Yates J, 3rd, Esteban CR, Sancho-Martinez I, Izpisua Belmonte JC. Progressive degeneration of human neural stem cells caused by pathogenic LRRK2. Nature. 2012;491:603–607. doi: 10.1038/nature11557. [DOI] [PMC free article] [PubMed] [Google Scholar]
- Mukherjee DP, Ray N, Acton ST. Level set analysis for leukocyte detection and tracking. IEEE Trans Image Process. 2004;13:562–572. doi: 10.1109/tip.2003.819858. [DOI] [PubMed] [Google Scholar]
- Nath SK, Palaniappan K, Bunyak F. Cell segmentation using coupled level sets and graph-vertex coloring. Med Image Comput Comput Assist Interv. 2006;9:101–108. doi: 10.1007/11866565_13. [DOI] [PMC free article] [PubMed] [Google Scholar]
- Otsu N. A threshold selection method from gray-level histogram. IEEE Trans Syst Man Cybern. 1979;9:62–66. [Google Scholar]
- Plissiti ME, Nikou C, Charchanti A. Automated detection of cell nuclei in pap smear images using morphological reconstruction and clustering. IEEE Trans Inf Technol Biomed. 2011;15:233–241. doi: 10.1109/TITB.2010.2087030. [DOI] [PubMed] [Google Scholar]
- Puckelwartz M, Mcnally EM. Emery-Dreifuss muscular dystrophy. Handb Clin Neurol. 2011;101:155–166. doi: 10.1016/B978-0-08-045031-5.00012-8. [DOI] [PubMed] [Google Scholar]
- Quelhas P, Marcuzzo M, Mendonc XAAM, Campilho A. Cell Nuclei and Cytoplasm Joint Segmentation Using the Sliding Band Filter. Medical Imaging, IEEE Transactions on. 2010;29:1463–1473. doi: 10.1109/TMI.2010.2048253. [DOI] [PubMed] [Google Scholar]
- Rando TA, Blau HM. Primary mouse myoblast purification, characterization, and transplantation for cell-mediated gene therapy. J Cell Biol. 1994;125:1275–1287. doi: 10.1083/jcb.125.6.1275. [DOI] [PMC free article] [PubMed] [Google Scholar]
- Rosenfeld A. MEASURING THE SIZES OF CONCAVITIES. Pattern Recognition Letters. 1985;3:71–75. [Google Scholar]
- Salah MB, Mitiche A, Ayed IB. Multiregion image segmentation by parametric kernel graph cuts. Image Processing, IEEE Transactions on. 2011;20:545–557. doi: 10.1109/TIP.2010.2066982. [DOI] [PubMed] [Google Scholar]
- Su H, Xing F, Lee JD, Peterson CA, Yang L. Automatic myonuclear detection in isolated single muscle fibers using robust ellipse fitting and sparse optimization. IEEE/ACM Trans Comput Biol Bioinform. 2014;11:714–726. doi: 10.1109/TCBB.2013.151. [DOI] [PMC free article] [PubMed] [Google Scholar]
- Wahlby C, Sintorn IM, Erlandsson F, Borgefors G, Bengtsson E. Combining intensity, edge and shape information for 2D and 3D segmentation of cell nuclei in tissue sections. J Microsc. 2004;215:67–76. doi: 10.1111/j.0022-2720.2004.01338.x. [DOI] [PubMed] [Google Scholar]
- Wu HS, Barba J, Gil J. Iterative thresholding for segmentation of cells from noisy images. J Microsc. 2000;197:296–304. doi: 10.1046/j.1365-2818.2000.00653.x. [DOI] [PubMed] [Google Scholar]
- Yang X, Li H, Zhou X. Nuclei segmentation using marker-controlled watershed, tracking using mean-shift, and kalman filter in time-lapse microscopy. IEEE Trans Circuits and Systems I. 2006;53:2405–2414. [Google Scholar]


