

Abstract
Introduction
Accurate assessment of the impact of donor quality on liver transplant (LT) costs has been limited by the lack of a large, multicenter study of detailed clinical and economic data.
Methods
A novel, retrospective database linking information from the University HealthSystem Consortium and the OPTN registry was analyzed using multivariate regression to determine the relationship between donor quality (assessed through the Donor Risk Index (DRI)), recipient illness severity, and total inpatient costs (transplant and all readmissions) for 1 year following LT.
Results
Cost data were available for 9,059 LT recipients. Increasing MELD score, higher DRI, simultaneous liver kidney transplant, female gender and prior liver transplant were associated with increasing cost of LT (P<0.05). MELD and DRI interact to synergistically increase the cost of LT (P<0.05). Donors in the highest DRI quartile added close to $12,000 to the cost of transplantation and nearly $22,000 to post-transplant costs in comparison to the lowest risk donors. Among the individual components of the DRI, donation after cardiac death (increased $20,769 vs. brain dead donors) had the greatest impact on transplant costs. Overall one year costs were increased in older donors, minority donors, nationally shared organs, and those with cold ischemic times 7–13 hours (p<0.05 for all)
Conclusion
Donor quality, as measured by the DRI, is an independent predictor of LT costs in the perioperative and post-operative periods. Centers in highly competitive regions who transplant higher MELD patients with high DRI livers may be particularly affected by the synergistic impact of these factors.
Keywords: Donor Risk Index, Healthcare Costs, Liver Transplantation, Model for End-Stage Liver Disease
INTRODUCTION
Prior financial analyses of liver transplant (LT) practice have largely emphasized the relationship between recipient severity of illness and the cost of care. (1–4). It is well established that patients with advanced liver disease are significantly more expensive to transplant than patients with well compensated cirrhosis or hepatocellular carcinoma. This economic reality is particularly significant in light of the shift in allocation policy to utilize the Model for End-Stage Liver Disease (MELD) score that gives priorities to candidates with the highest waiting list mortality (5, 6). Although the MELD allocation system has reduced waiting list mortality, it has increased the complexity of patients undergoing LT and placed significant financial strain on transplant centers (7, 8).
To address the ongoing liver allograft shortage, transplant centers increasingly utilize organs from donors with characteristics that increase the risk of allograft failure. In their landmark publication, Feng et al. described a continuous, objective measure of organ quality based upon donor characteristics available at the time of the organ offer (9). The resulting Donor Risk Index (DRI) predicts the likelihood of graft failure at 3 months post transplant. Recently, an elegant study by Schaubel et al. has demonstrated the effect of MELD and DRI interaction on patient survival (21). This report strongly suggests that marginal livers are best utilized in the highest MELD patients as this is associated with the greatest transplant benefit. The economic impact of this practice is not defined.
In previous studies, we have investigated the relationship of the DRI and MELD on transplant costs using hospital length of stay as a marker of cost within national registry data which demonstrated an association between high DRI organs and transplant related length of stay (10). In contrast, a recent two-center study showed a potent and consistent effect of recipient MELD score on liver transplant costs across institutions while impact of DRI was minimal (11). There have also been conflicting reports about the impact of DRI on post-transplant costs, despite the evidence from the recent studies that demonstrate the long-term costs associated with the use of organs from donors after cardiac death (DCD) (12).
In the setting of fixed reimbursements, transplant centers face conflicting economic and clinical pressures (13). Outcomes data suggest that high DRI organs are best used in high MELD patients. However, this practice may result in a significantly higher cost of care within the global period covered under most transplant contracts. Therefore, understanding the economic impact of donor and recipient factors is critical for assessing the impact of clinical decision-making on transplant centers’ financial viability. This study seeks to provide a thorough description of the association of severity of illness and donor quality with transplant center cost.
METHODS
Protocol, design, data sources and inclusion criteria
This project was approved by the University of Washington and the Saint Louis University Institutional Review Boards. A retrospective cohort study was initially conducted including data from all LT recipients transplanted between October 1, 2004 and December 31, 2007. Clinical data were drawn from the Organ Procurement and Transplantation Network (OPTN) research files. These data were then linked to cost and clinical data from the University HealthSystem Consortium (UHC).
The UHC is an alliance of 107 academic medical centers and 234 of their affiliated hospitals representing approximately 90% of the nation’s non-profit academic medical centers. UHC’s database utilizes self-reported hospital charge data adjusted to costs using the hospital specific cost-to-charge ratio at the line-item level for more than 170 UHC members and affiliate hospitals. The database allows for comparison of clinical and economic performance of member hospitals as well as within-hospital comparisons. The information is based primarily on data submitted from the UB-04 billing forms which includes patient demographics, ICD-9 diagnostic codes as well as assignment into Medicare severity diagnosis-related groups (DRGs). Costs were derived from reports to UHC at the individual charge level and adjusted to costs using the institution specific cost-to-charge ratio obtained from the department-level Medicare cost reports. These costs account for wage variation using the federally reported area wage indexes (AWI).
The linkage between OPTN data and UHC data was completed using date of transplant, date of birth, transplant center and recipient’s gender. Duplicate matches were verified by residential zip codes. All direct identifiers were removed before the final dataset was available for analysis. For the present study, inclusion was restricted to adult patients (≥ 18 years of age) who received a liver or liver-kidney transplant for chronic liver disease and who had the transplant performed in a hospital affiliated with the UHC. In the case of re-transplantation within the time period of the study, these costs were attributed to the 1 year post transplant costs of the initial transplant. The matched cases (n= 9,861) represent 49% of all 20,141 liver transplant procedures performed in the United States during this period. Donor and recipient demographic characteristics of this population were very similar to the overall transplant cohort. The cases with missing transplant costs were excluded (n=791). Extreme outliers were identified after a visual inspection of the cost distribution. The cases were regarded as outliers if the transplant costs were less than $25,000. This reflects the potential mismatching of UNOS data to non-transplant admissions. These patients were excluded based on the assumption that the hospitalization was likely not a liver transplant given the low costs (n = 14), yielding an analytic sample of 9,059 patients. We did not exclude very high cost outliers. It is likely that these patients reflect genuine transplant admissions and that the high costs may be associated with the clinical practice patterns, recipient listing, and donor acceptance decisions.
MELD and DRI
MELD was computed at time of transplant as previously described (14). For the patients who were transplanted with “tumor or exception” points, the “biologic” MELD was used for all calculations. Creatinine values greater than four were set equal to four. The MELD score was then capped at a lower limit of 6 and an upper limit of 40. For the statistical analysis patients were categorized according to the same categories Washburn et al. utilized: 6–14, 15–20, 21–27, 28–40 (15). These categories were found to be similar to the MELD quartile cutoff points in our sample.
DRI was computed according to the formula by Feng et al. (9). We categorized DRI as: 0–<1.2, 1.2–<1.5, 1.5–<1.8 and >1.8, dividing the sample approximately into quartiles by DRI.
Clinical outcome and covariate definitions
The primary outcome was “cost”. We have utilized direct cost within the first year post-transplant (in 2008 US dollars). Costs were those independently generated by each patient for two consecutive periods: first, the initial transplant admission and second, the sum of post-transplant admissions within the first year post transplant. Total cost was calculated as the sum of transplant admission and post-transplant inpatient costs for all re-admissions within 1 year as reported by the UHC database. Monetary figures were totaled after adjustment to 2008 dollars using the overall Consumer Price Index to account for medical inflation (16).
Covariates for cost models were identified through bivariate analysis and included: gender, age, race/ethnicity, blood type, primary OPTN cause of liver failure (Hepatitis B-HBV, Hepatitis C-HCV, hepatocellular carcinoma-HCC, and other cause), re-transplantation, split grafts, deceased donor recipient, pre-transplant dialysis, MELD, and DRI or components of DRI (donor age, race, height, cause of death, share, cold ischemia time, asystole, and partial/split liver).
Statistical Analysis
Patient and death-censored graft survival were determined using the Kaplan-Meier survival method. We performed multivariate regression analysis to determine the “cost drivers” for the costs of the two time periods as well as total costs. Missing data were categorized as “other” or “unknown” or was excluded from analysis, depending on the frequency of missing data for the given characteristic (as reported in Table 1). The mean value of cold ischemia time (7.2 hours) among non-missing cases was used in the donor risk index computation for cases with missing cold ischemia time. An alpha level of 0.05 was used for all significance tests. We examined the tolerance and variance inflation statistics of all variables to identify significant collinearity among the model components. UNOS region was included in the model as an adjustment; however, center-specific adjustment was not performed as this is likely to be a function of MELD and DRI which were assessed in the model. Differences in the cost of providing care resulting from local economic factors were controlled for through local area wage adjustment. All analyses were performed using SAS v.9.2 (SAS Institute, Cary, NC).
Table 1.
Demographic and clinical characteristics of liver transplant recipients included in the study (n= 9,059)
| n | % | |
|---|---|---|
| Female | 2,966 | 32.74 |
| Age of recipient (years) | ||
| 18–24 | 194 | 2.14 |
| 25–34 | 362 | 4.01 |
| 35–44 | 925 | 10.21 |
| 45–54 | 3,392 | 37.44 |
| 55–64 | 3,237 | 35.73 |
| 65+ | 949 | 10.48 |
| Race | ||
| White | 6,600 | 72.86 |
| Black | 866 | 9.56 |
| Hispanic | 1,007 | 11.12 |
| Other | 586 | 6.47 |
| Blood type | ||
| A | 3,382 | 37.33 |
| B | 1,184 | 13.07 |
| AB | 491 | 5.42 |
| O | 4,002 | 44.18 |
| Primary diagnosis | ||
| HCC | 1,157 | 12.77 |
| HBV | 275 | 3.04 |
| HCV | 3,102 | 34.24 |
| Other | 4,518 | 49.87 |
| Missing | 7 | 0.08 |
| Recipient Diabetes | 1,846 | 20.38 |
| Region | ||
| 1 | 235 | 2.59 |
| 2 | 994 | 10.97 |
| 3 | 555 | 6.13 |
| 4 | 422 | 4.66 |
| 5 | 1,416 | 15.63 |
| 6 | 450 | 4.97 |
| 7 | 1,597 | 17.63 |
| 8 | 624 | 6.89 |
| 9 | 869 | 9.59 |
| 10 | 909 | 10.03 |
| 11 | 988 | 10.91 |
| Re-transplant | 51 | 0.56 |
| Simultaneous Liver-kidney transplant | 628 | 6.93 |
| Pre-transplant characteristics | ||
| Dialysis | 406 | 4.48 |
| Biologic MELD Categories | ||
| MELD 6–14 | 2,404 | 26.54 |
| MELD 15–20 | 2,239 | 24.72 |
| MELD 21–27 | 1,880 | 20.75 |
| MELD 28+ | 2,055 | 22.68 |
| MELD unknown | 481 | 5.31 |
| Mean | SD | |
| BMI (n=7,494) | 28.2 | 5.7 |
RESULTS
Clinical Characteristics of the Study Cohort
During the period of the study we identified 9,059 LT recipients of the UHC database with an OPTN LT record between October 1, 2004 and December 31, 2007. The majority of the patients included in the study were male, white, had viral hepatitis and/or hepatocellular carcinoma. The average MELD score at transplant for this sample was 21. The demographics of the population included in the study are shown in Table 1. Patient and death-censored graft survival among the study cohort were 87% and 96%, respectively, at one year and 75% and 93% at 3 years. Patients in the sample experienced a median of one post-transplant hospitalization during the first year after the initial transplant event.
The donor population was reflective of the general US donor population (Table 2). The majority of the donors were male, white, under the age of 60 and/or deceased from cerebrovascular accident or head trauma. Over 75% of the organs were allocated locally with cold ischemia time averaging 7.3 hours.
Table 2.
Demographic Characteristics of Liver Transplant Donors Included in the Study
| Donor Characteristic (n= 9,059) | n | % |
|---|---|---|
| Female | 3,597 | 39.71 |
| Age of recipient (years) | ||
| <40 | 4,219 | 46.57 |
| 40–49 | 1,850 | 20.42 |
| 50–59 | 1,733 | 19.13 |
| 60–69 | 865 | 9.55 |
| >69 | 392 | 4.33 |
| Race* | ||
| White | 6,223 | 68.69 |
| Black | 1,410 | 15.56 |
| Hispanic | 1,096 | 12.10 |
| Other | 330 | 3.64 |
| Height (cm) | ||
| <164 | 2,005 | 22.13 |
| 164–<173 | 2,130 | 23.51 |
| 173–<181 | 2,768 | 30.56 |
| 181+ | 1,773 | 19.57 |
| Unknown | 383 | 4.23 |
| Organ location | ||
| Local | 7,087 | 78.23 |
| Regional | 1,422 | 15.70 |
| National | 550 | 6.07 |
| Cause of death | ||
| Trauma | 3,306 | 36.49 |
| Anoxia | 1,242 | 13.71 |
| Cerebrovascular accident | 3,969 | 43.81 |
| Other | 542 | 5.99 |
| Donation after cardiac death | 401 | 4.43 |
| Donor Risk Index | ||
| DRI 0–<1.2 | 2,060 | 22.74 |
| DRI 1.2–<1.5 | 2,390 | 26.38 |
| DRI 1.5–<1.8 | 1,996 | 22.03 |
| DRI 1.8+ | 2,230 | 24.62 |
| DRI unknown | 383 | 4.23 |
| Cold ischemia time (hours)* | ||
| <7 | 3,157 | 34.85 |
| 7–<13 | 4,256 | 46.98 |
| 13+ | 410 | 4.53 |
| missing | 1,236 | 13.64 |
| Donor Diabetes | 716 | 8.73 |
| Types of graft* | ||
| Split grafts | 508 | 5.61 |
The mean value of cold ischemia time (7.2 hours) among non-missing cases was used in the donor risk index computation for cases with missing cold ischemia time.
Recipient characteristics related to transplant costs
Multivariate linear regression was used to assess the correlations between recipient characteristics and transplant cost in each period of interest. Among the characteristics analyzed, women, black recipient race, re-transplanted patients and liver-kidney transplant recipients were more expensive (Table 3). Severity of illness (MELD score) was strongly associated with the cost of transplant during the transplant hospitalization (P<0.001) but not for the subsequent post-transplant year. There was a strong relationship between the UNOS region in which the recipient was transplanted and costs. Regions 5, 7, 9 and 10 had significantly higher total costs as compared to region 1.
Table 3.
Multivariate regression of recipient characteristics related to hospital costs for liver transplant patients (in thousands of dollars) †
| (n= 9,059) | Transplant costs | 1 year post-transplant costs †† | Transplant + 1 year post-transplant costs††† | |||||||||
|---|---|---|---|---|---|---|---|---|---|---|---|---|
| Regression coefficient | 95% Confidence Limits | P | Regression coefficient | 95% Confidence Limits | P | Regression coefficient | 95% Confidence Limits | P | ||||
| Intercept | 90,035 | 66,515 | 113,556 | <.0001 | 13,557 | −15,336 | 42,450 | 0.36 | 103,592 | 64,759 | 142,424 | <.0001 |
| Demographic: | ||||||||||||
| Female | 10,891 | 5,957 | 15,825 | <.0001 | 1,891 | −4,170 | 7,952 | 0.54 | 12,782 | 4,636 | 20,928 | 0.00 |
| Age | ||||||||||||
| 18–24 | −1,732 | −20,770 | 17,305 | 0.86 | −1,092 | −24,478 | 22,294 | 0.93 | −2,824 | −34,255 | 28,607 | 0.86 |
| 25–34 | Reference | Reference | Reference | |||||||||
| 35–44 | −3,782 | −17,086 | 9,523 | 0.58 | −91 | −16,435 | 16,252 | 0.99 | −3,873 | −25,838 | 18,092 | 0.73 |
| 45–54 | −6,485 | −18,664 | 5,695 | 0.30 | −1,893 | −16,854 | 13,069 | 0.80 | −8,377 | −28,485 | 11,731 | 0.41 |
| 55–64 | −5,585 | −17,733 | 6,563 | 0.37 | −4,776 | −19,700 | 10,147 | 0.53 | −10,362 | −30,418 | 9,695 | 0.31 |
| 65+ | −3,111 | −16,597 | 10,375 | 0.65 | −12,375 | −28,942 | 4,191 | 0.14 | −15,486 | −37,751 | 6,779 | 0.17 |
| Race | ||||||||||||
| White | Reference | Reference | Reference | |||||||||
| Black | 1,638 | −6,299 | 9,575 | 0.69 | 13,125 | 3,375 | 22,875 | 0.01 | 14,763 | 1,659 | 27,867 | 0.03 |
| Other | 5,337 | −4,840 | 15,514 | 0.30 | −9,721 | −22,223 | 2,781 | 0.13 | −4,384 | −21,187 | 12,419 | 0.61 |
| Hispanic | −6,061 | −13,679 | 1,558 | 0.12 | −8,435 | −17,794 | 923 | 0.08 | −14,496 | −27,074 | −1,918 | 0.02 |
| Clinical: | ||||||||||||
| Blood type | ||||||||||||
| A | Reference | Reference | Reference | |||||||||
| B | 1,877 | −5,450 | 9,203 | 0.62 | 2,625 | −6,375 | 11,625 | 0.57 | 4,501 | −7,595 | 16,597 | 0.47 |
| AB | −8,360 | −18,753 | 2,034 | 0.11 | 2,366 | −10,402 | 15,134 | 0.72 | −5,994 | −23,154 | 11,167 | 0.49 |
| O | 3,997 | −1,016 | 9,009 | 0.12 | 2,267 | −3,891 | 8,424 | 0.47 | 6,263 | −2,012 | 14,539 | 0.14 |
| Liver disease | ||||||||||||
| HCB | Reference | Reference | Reference | |||||||||
| HCV | −5,340 | −19,592 | 8,913 | 0.46 | 14,433 | −3,076 | 31,941 | 0.11 | 9,093 | −14,438 | 32,624 | 0.45 |
| HCC | −7,812 | −22,907 | 7,283 | 0.31 | 1,613 | −16,930 | 20,155 | 0.86 | −6,199 | −31,121 | 18,722 | 0.63 |
| Other | −1,564 | −15,732 | 12,604 | 0.83 | 7,866 | −9,538 | 25,271 | 0.38 | 6,302 | −17,090 | 29,694 | 0.60 |
| Unknown | 37,959 | −44,079 | 119,997 | 0.36 | 6,520 | −94,257 | 107,297 | 0.90 | 44,479 | −90,966 | 179,924 | 0.52 |
| Recipient diabetes | 3,241 | −2,472 | 8,954 | 0.27 | 9,366 | 2,348 | 16,383 | 0.01 | 12,607 | 3,175 | 22,039 | 0.01 |
| Prior liver | 44,476 | 14,418 | 74,535 | 0.00 | 76,092 | 39,168 | 113,016 | <.0001 | 120,568 | 70,942 | 170,194 | <.0001 |
| transplant | ||||||||||||
| Dialysis | 5,585 | −6,817 | 17,987 | 0.38 | −863 | −16,097 | 14,372 | 0.91 | 4,722 | −15,753 | 25,198 | 0.65 |
| Liver-Kidney | 84,436 | 74,205 | 94,667 | <.0001 | 3,947 | −8,621 | 16,515 | 0.54 | 88,383 | 71,491 | 105,275 | <.0001 |
| Region: | ||||||||||||
| 1 | Reference | Reference | Reference | |||||||||
| 2 | 12,489 | −3,176 | 28,154 | 0.12 | 5,180 | −14,063 | 24,423 | 0.60 | 17,669 | −8,193 | 43,532 | 0.18 |
| 3 | −8,996 | −25,801 | 7,810 | 0.29 | 6,518 | −14,126 | 27,163 | 0.54 | −2,477 | −30,223 | 25,269 | 0.86 |
| 4 | 5,482 | −12,095 | 23,058 | 0.54 | −3,347 | −24,938 | 18,244 | 0.76 | 2,134 | −26,884 | 31,153 | 0.89 |
| 5 | 65,772 | 50,518 | 81,026 | <.0001 | 8,371 | −10,368 | 27,109 | 0.38 | 74,143 | 48,959 | 99,327 | <.0001 |
| 6 | 18,390 | 981 | 35,800 | 0.04 | −8,447 | −29,833 | 12,940 | 0.44 | 9,944 | −18,800 | 38,687 | 0.50 |
| 7 | 44,012 | 29,044 | 58,981 | <.0001 | 24,992 | 6,605 | 43,380 | 0.01 | 69,005 | 44,292 | 93,718 | <.0001 |
| 8 | 26,536 | 10,071 | 43,000 | 0.0001 | −7,618 | −27,843 | 12,608 | 0.46 | 18,918 | −8,265 | 46,101 | 0.17 |
| 9 | 25,839 | 9,946 | 41,733 | 0.0001 | 8,621 | −10,903 | 28,145 | 0.39 | 34,460 | 8,220 | 60,701 | 0.01 |
| 10 | 49,756 | 33,914 | 65,597 | <.0001 | 7,628 | −11,832 | 27,088 | 0.44 | 57,383 | 31,229 | 83,538 | <.0001 |
| 11 | 14,908 | −757 | 30,572 | 0.06 | 6,565 | −12,678 | 25,807 | 0.50 | 21,472 | −4,390 | 47,334 | 0.10 |
| MELD 6–14 | Reference | Reference | Reference | |||||||||
| MELD 15–20 | 7,517 | 1,037 | 13,997 | 0.02 | 2,968 | −4,992 | 10,928 | 0.46 | 10,485 | −213 | 21,184 | 0.05 |
| MELD 21–27 | 24,953 | 17,922 | 31,984 | <.0001 | 4,600 | −4,037 | 13,237 | 0.30 | 29,553 | 17,945 | 41,161 | <.0001 |
| MELD 28+ | 72,119 | 65,056 | 79,183 | <.0001 | 5,611 | −3,066 | 14,289 | 0.21 | 77,731 | 66,069 | 89,393 | <.0001 |
| MELD unknown | 4,656 | −6,650 | 15,963 | 0.42 | −2,113 | −16,002 | 11,776 | 0.77 | 2,544 | −16,123 | 21,210 | 0.79 |
| DRI | ||||||||||||
| DRI 0–<1.2 | Reference | Reference | Reference | |||||||||
| DRI 1.2–<1.5 | 4,808 | −1,631 | 11,246 | 0.14 | 5,839 | −2,069 | 13,748 | 0.15 | 10,647 | 18 | 21,276 | 0.05 |
| DRI 1.5–<1.8 | 7,101 | 338 | 13,865 | 0.04 | 8,358 | 50 | 16,667 | 0.05 | 15,459 | 4,293 | 26,626 | 0.01 |
| DRI 1.8+ | 11,860 | 5,129 | 18,590 | 0.0006 | 21,767 | 13,499 | 30,035 | <.0001 | 33,627 | 22,515 | 44,739 | <.0001 |
| DRI unknown | −4,045 | −16,480 | 8,390 | 0.52 | 6,714 | −8,561 | 21,990 | 0.39 | 2,669 | −17,861 | 23,200 | 0.80 |
Adjusted for the covariates shown
Cost of 1 year after the discharge from transplant surgery
The sum of transplant and 1 year post-transplant costs
Donor characteristics related to transplant cost
After adjustment for recipient characteristics, decreased donor quality, as measured by DRI score, was strongly associated with an increase in the cost of total transplant and post-transplant care. The cost of all types of care increased almost linearly with the DRI values (Figure 1, p<0.01). Thus, transplants from donors in the highest DRI quartile were associated with an incremental cost increase of nearly $12,000 for transplant costs and nearly $22,000 for post-transplant costs in comparison to those in the lowest DRI quartile.
Figure 1.
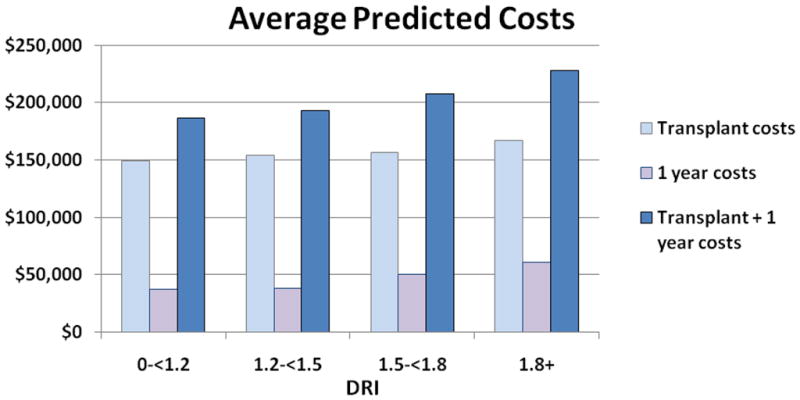
Relationship of Donor Risk Index (per DRI quartiles) and transplant and post-transplant costs, adjusted for: Sex, age, race, diagnosis (Hepatocellular carcinoma, Hepatitis B Virus, Hepatitis C Virus, other), recipient blood type, prior liver transplantation, pre-transplant dialysis, MELD, simultaneous liver-kidney transplantation and region. *P<0.0001 for difference between all DRI groups.
Interaction between MELD and DRI and liver transplant costs
The impact of donor quality on cost was found to vary across severity of illness. High DRI increased the cost of transplant at all MELD strata (Figure 2A). However, the magnitude of the cost differential according to organ quality was greatest in the high MELD patients. (Figure 2B). Patients in the lowest MELD quartile (6–14) had a minimal rise in cost when receiving donors from the highest DRI group. In the highest MELD quartile (>28), there was a clear and significant rise in the total cost of transplant care as a function of DRI.
Figure 2.
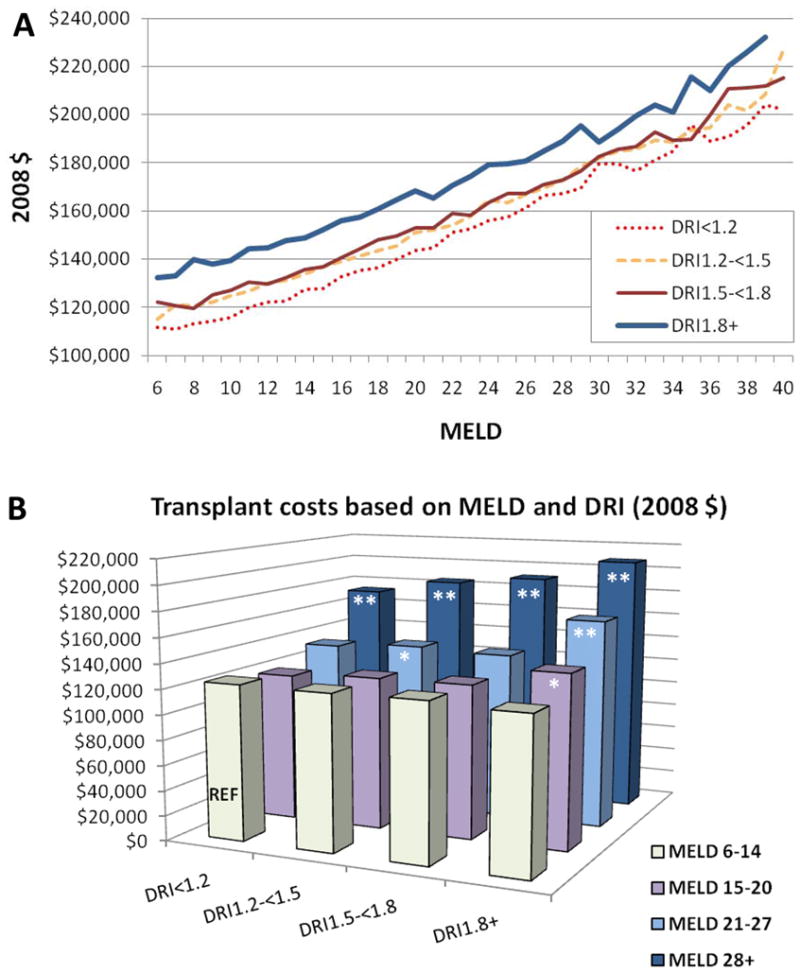
Interaction of DRI, MELD, and total transplant cost (in thousands of US dollars), n ¼ 7575, adjusted for: sex, age, race, diagnosis (HCC, HBV, HCV, other), recipient blood type, prior liver transplant, pretransplant dialysis, MELD score, simultaneous liver–kidney transplantation and region. (A) Relationship between MELD and DRI; (B) Synergistic effect between MELD and DRI. *P < 0.05; **P < 0.0001.
DRI vs. individual donor components as drivers of transplant costs
To assess the contribution of the components of the DRI equation on cost, each variable was individually considered in the fully adjusted model. Among the DRI components, DCD donation (+ $59,000 vs. brain dead donors), Black and Hispanic race (+$15,000 & $15,000 vs. white), nationally shared livers allografts (+$ 30,000 vs. regional) and older donors (+$34,000 vs. donors less than 40 years) were all found to increase the total cost of post-transplant care (Table 4).
Table 4.
Multivariate regression of donor characteristics related to hospital costs for liver transplant patients (in thousands of dollars) †
| (n= 9,059) | Transplant costs | 1 year post-transplant costs †† | Transplant + 1 year post-transplant costs ††† | |||||||||
|---|---|---|---|---|---|---|---|---|---|---|---|---|
| Regression coefficient | 95% Confidence Limits | P | Regression coefficient | 95% Confidence Limits | P | Regression coefficient | 95% Confidence Limits | P | ||||
| Donor age | ||||||||||||
| 18–<40 | Reference | Reference | Reference | |||||||||
| 40–<50 | 1,287 | −5,083 | 7,657 | 0.69 | 3,203 | −4,608 | 11,015 | 0.42 | 4,490 | −6,005 | 14,985 | 0.40 |
| 50–<60 | 2,960 | −3,853 | 9,773 | 0.39 | 15,973 | 7,619 | 24,328 | 0.00 | 18,933 | 7,708 | 30,158 | 0.0001 |
| 60–<70 | 7,843 | −979 | 16,664 | 0.08 | 8,321 | −2,497 | 19,139 | 0.13 | 16,164 | 1,629 | 30,698 | 0.03 |
| 70+ | −2,799 | −15,013 | 9,415 | 0.65 | 36,866 | 21,887 | 51,844 | <.0001 | 34,067 | 13,942 | 54,191 | 0.0001 |
| Donor race | ||||||||||||
| White | Reference | Reference | Reference | |||||||||
| Black | 5,798 | −676 | 12,273 | 0.08 | 9,357 | 1,417 | 17,297 | 0.02 | 15,155 | 4,487 | 25,823 | 0.01 |
| Hispanic | 10,363 | 2,852 | 17,873 | 0.01 | 4,659 | −4,551 | 13,868 | 0.32 | 15,021 | 2,647 | 27,395 | 0.02 |
| Other | 10,378 | −1,985 | 22,741 | 0.10 | 12,545 | −2,616 | 27,706 | 0.10 | 22,923 | 2,554 | 43,293 | 0.03 |
| Donor height | ||||||||||||
| <164 | Reference | Reference | Reference | |||||||||
| 164–<173 | −5,621 | −12,183 | 940 | 0.09 | 3,501 | −4,545 | 11,548 | 0.39 | −2,120 | −12,930 | 8,691 | 0.70 |
| 173–<181 | −6,260 | −12,651 | 132 | 0.05 | −3,510 | −11,348 | 4,328 | 0.38 | −9,769 | −20,300 | 761 | 0.07 |
| 181+ | −9,134 | −16,287 | −1,982 | 0.01 | 8,580 | −191 | 17,351 | 0.06 | −554 | −12,339 | 11,230 | 0.93 |
| Missing | −26,313 | −50,300 | −2,326 | 0.03 | −10,075 | −39,490 | 19,341 | 0.50 | −36,388 | −75,909 | 3,134 | 0.07 |
| Donor diabetes | −4,118 | −12,388 | 4,153 | 0.33 | 7,252 | −2,891 | 17,394 | 0.16 | 3,134 | −10,493 | 16,760 | 0.65 |
| Donor cause of death | ||||||||||||
| Trauma | −15,076 | −29,426 | −726 | 0.04 | −20,279 | −37,876 | −2,681 | 0.02 | −35,355 | −58,998 | −11,712 | 0.0001 |
| Anoxia | −15,459 | −30,647 | −270 | 0.05 | −27,972 | −46,597 | −9,346 | 0.00 | −43,430 | −68,455 | −18,406 | 0.0001 |
| CVA | −13,881 | −28,364 | 603 | 0.06 | −21,885 | −39,646 | −4,124 | 0.02 | −35,765 | −59,628 | −11,902 | 0.0001 |
| CNS tumor | −27,332 | −66,611 | 11,946 | 0.17 | −47,577 | −95,744 | 591 | 0.05 | −74,909 | −139,624 | −10,194 | 0.02 |
| Other/Not reported | Reference | Reference | Reference | |||||||||
| Donor share | ||||||||||||
| Regional | Reference | Reference | Reference | |||||||||
| National | 9,667 | −1,663 | 20,997 | 0.09 | 20,354 | 6,460 | 34,248 | 0.00 | 30,021 | 11,353 | 48,688 | 0.0001 |
| Local | −8,733 | −15,166 | −2,301 | 0.01 | 52 | −7,835 | 7,940 | 0.99 | −8,681 | −19,279 | 1,917 | 0.11 |
| Cold ischemia (hours) | ||||||||||||
| <7 | Reference | Reference | Reference | |||||||||
| 7–<13 | 10,598 | −1,137 | 22,333 | 0.08 | 24,053 | 9,663 | 38,444 | 0.00 | 34,651 | 15,317 | 53,986 | 0.0001 |
| 13+ | 26,725 | −11,173 | 64,623 | 0.17 | −29,876 | −76,350 | 16,599 | 0.21 | −3,150 | −65,591 | 59,291 | 0.92 |
| Missing | 1,044 | −5,769 | 7,856 | 0.76 | 7,450 | −904 | 15,805 | 0.08 | 8,494 | −2,730 | 19,719 | 0.14 |
| Asystole | 20,769 | 9,575 | 31,963 | 0.00 | 37,754 | 24,026 | 51,481 | <.0001 | 58,522 | 40,079 | 76,966 | <.0001 |
| (DCD vs brain-dead) | ||||||||||||
| Partial/split donation | −11,894 | −26,105 | 2,316 | 0.10 | −11,378 | −28,804 | 6,048 | 0.20 | −23,272 | −46,685 | 141 | 0.05 |
Adjusted for recipient sex, age, race, diagnosis (Hepatocellular carcinoma, Hepatitis B Virus, Hepatitis C Virus, other), blood type, prior liver transplantation, pre-transplant dialysis, MELD, simultaneous liver-kidney transplantation and region.
Cost of One year after the discharge from transplant surgery
The sum of transplant and 1 year post-transplant costs
DISCUSSION
In previous studies we described a correlation between DRI and liver transplant cost using hospital length of stay (10). We have also identified significant associations between recipient characteristics (mainly MELD) and liver transplant cost in the perioperative and post-transplant periods using a more granular private insurance database (17). In the current analysis, we demonstrated a significant impact on inpatient costs associated with the use of higher risk donors. We also examined the interaction of DRI and severity of illness throughout the period of peri-operative and posttransplant care.
To date, large scale post-transplant cost studies have been limited by the lack of a nationally representative, clinically detailed data source. The OPTN dataset has detailed clinical information related to transplantation, but does not contain cost data. Conversely, the database of the UHC contains information on cost data, comorbidities, and procedures and complications after liver transplantation, but it lacks crucial clinical and donor information specific to the transplant field. While not cost accounting data, the UHC utilizes hospital department specific cost to charge ratios to develop accurate method of assessing the resources utilized to provide care for patients with end stage liver disease. In this study, we used an innovative database created by linking these two large datasets to study transplant economics, resulting in enhanced statistical power and generalizability.
The analysis validated our previous finding that DRI has a significant impact on cost which is independent of recipient severity of illness. In the multivariate analysis, DRI remained statistically significant even after adjusting for other characteristics including MELD. As in other analyses, it appeared that MELD was significantly associated with costs at the time of the initial hospitalization but minimally impacts the post-transplant costs. While MELD controlled for most recipient characteristics, it appears that women remain more expensive. This may reflect the well known underestimation of the severity of liver disease in women using MELD which includes creatinine rather than glomerular filtration rate and, therefore, does not account for muscle mass (18). It is possible that under a MELD based allocation system, women must achieve a greater severity of illness to be allocated a deceased donor organ. Poor donor quality, conversely, has a smaller, but significant impact on transplant cost during the initial hospitalization and but has a greater impact on the first year post-transplant costs. Among the components of the DRI, it appears that DCD livers have the greatest overall impact on post transplant costs, likely reflecting the importance of ischemic cholangiopathy as has been reported by Jay and deVera (12, 19). This analysis demonstrated that increasing MELD and higher DRI appear to have a synergistic impact on overall transplant costs. This finding is particularly important in light of clinical findings suggesting that the survival benefit of high DRI organs is generally confined to the high MELD patients (21). Thus, transplant centers that appropriately choose to use marginal donors for patients with high waiting list mortality, may be significantly economically disadvantaged. As a result of the well established differences in the MELD score at transplant across centers and regions, it is possible that transplant centers will be impacted differentially by the economic implication of these two factors (20).
While significant survival benefit can be achieved through the appropriate use of marginal donors (21, 22) is important that disincentives to transplanting the sickest patients or utilizing marginal organs do not lead to systematic reduction in the use of these life saving procedures (23). Appropriate policy decisions at the national level, sound contracting strategies, and continuous improvement in clinical practices will be paramount to maintaining transplant center’s financial viability and moving the field forward (24, 25). As an example, the transplant reimbursements could be more tightly linked to severity of illness as has been implemented with the risk adjusted DRG within the Medicare system for some conditions. In liver transplantation, the adjustment could also include the impact of donor characteristics such as the DRI.
The design and utilization of the DRI has been scrutinized by the transplant community. Critics highlight that the index has a low receiver-operator characteristic (ROC), does not include all donor characteristics that are clinically relevant (such as surgeons’ assessment and liver’s histology), and, therefore, explains only a small proportion of the overall variation in transplant survival. The index may have limitation for daily decision-making, but may provide transplant centers with an estimate of the economic and early clinical implications of organ selection practices. We have demonstrated that the DRI index is more strongly associated with overall transplant costs than the isolated donor characteristics. Among the DRI factors, however, DCD donors appear to have the most profound effect on 1 year transplant costs. This finding likely reflects a greater need for interventions and possibly re-transplantation among DCD liver recipients.
Our study has several limitations. First, inherent to retrospective studies is the risk that past outcomes may not be representative of future costs. Thus, the impact of a learning curve in the use of marginal organs may be incompletely presented here. It is possible that improved experience with marginal liver donors, can result in improving clinical practice (e.g. reducing ischemic times) and a further reduction in disparity in transplant costs associated with high DRI organs (26). Unfortunately, the persistently high rate of biliary complications following DCD liver transplant is likely to keep one year costs high for this class of donors (27). Second, true economic cost of transplant readmissions to busy academic hospital is likely underestimated by this analysis, due to the failure to include opportunity costs. Third, there is a significant discrepancy in reimbursements across different regional, state and institutional markets by both public and private payers. Thus, to the extent that the costs incurred through the use of marginal organs are compensated for by higher reimbursement, the overall impact of these findings on hospital finances may be mitigated. However, the converse is more likely. Aggressive centers using marginal organs in appropriate, high MELD patients must contract with national transplant networks and, therefore, are unlikely to shift these cost to the payers. In addition, the societal costs incurred through greater use of high DRI organs represented here are not mitigated by increased reimbursement. Finally, the UHC includes cost data derived from institutional charges adjusted with department-specific cost–to-charge ratios for academic hospitals only. Although this activity-based costing metric is a surrogate measure for true provider costs, it is generally accepted to be highly accurate and a well-correlated metric of the total cost of care. Furthermore, although the majority of liver transplants occur within this type of institution, it may not be possible to generalize these conclusions to all liver transplant centers.
In summary, donor quality impacts the cost of liver transplantation across the spectrum of care. While clearly not as important as MELD in the initial transplant hospitalization, donor quality may, in fact, be a dominant factor in determining costs the post-transplant period. The impact of these findings on transplant centers will vary with local factors including the average MELD at transplant and the DRI of available organs. The increase in cost associated with the use of high DRI organs may dissuade centers from using higher risk organs, despite the clear survival benefit offered to patients who may end up dying on the growing liver transplant list.
Acknowledgments
The researchers were supported in part by an American Recovery and Reinvestment Act Grant from the National Institute of Diabetes Digestive and Kidney Diseases, 1RC1DK086450. This work was supported in part by Health Resources and Services Administration contract 234-2005-370011C. Dr. Lentine received career development support from an NIDDK grant, K08DK073036. The content is the responsibility of the authors alone.
Role of sponsor
The interpretation and reporting of these data are the responsibility of the authors and in no way should be seen as an official policy of or interpretation by the OPTN, University HealthSystem Consortium, the US Government, the NIDDK or the National Institutes of Health.
Footnotes
Abstracts describing portions of this work were presented at the 2010 American Transplant Congress and the 2010 ASTS Winter Symposium.
References
- 1.Evans R, Manninen D, Dong F. An economic analysis of liver transplantation: costs, insurance coverage, and reimbursement. Gastroenterol Clin North Am. 1993;22(2):451–73. [PubMed] [Google Scholar]
- 2.Bonsel G, Klompmaker I, Essink-Bot M, Habbema J, Slooff M. Cost-effectiveness analysis of the Dutch liver transplantation programme. Transplant Proc. 1990;22(4):1481–4. [PubMed] [Google Scholar]
- 3.Taylor M, Greig P, Detsky A, McLeod R, Abdoh A, Krahn M. Factors Associated with the High Cost of Liver Transplantation in Adults. Can J Surg. 2002;45(6):425–34. [PMC free article] [PubMed] [Google Scholar]
- 4.Showstack J, Katz P, Lake J, Jr, RB, Dudley R, Belle S, et al. Resource Utilization in Liver Transplantation: Effects of Patient Characteristics and Clinical Practice. JAMA. 1999;281(15):1381–76. doi: 10.1001/jama.281.15.1381. [DOI] [PubMed] [Google Scholar]
- 5.Freeman R. Model for End-Stage Liver Disease (MELD) for liver allocation: A 5-year score card. Hepatology. 2008;47(3):1052–7. doi: 10.1002/hep.22135. [DOI] [PubMed] [Google Scholar]
- 6.Merion R, Schaubel D, Dykstra D, Freeman R, Port F, Wolfe R. The Survival Benefit of Liver Transplantation. Am J Transplant. 2005;5:307–13. doi: 10.1111/j.1600-6143.2004.00703.x. [DOI] [PubMed] [Google Scholar]
- 7.Axelrod D, Koffron A, Baker T, Al-Saden P, Dixler I, McNatt G, et al. The economic impact of MELD on liver transplant centers. Am J Transplant. 2005;5:2297–301. doi: 10.1111/j.1600-6143.2005.01025.x. [DOI] [PubMed] [Google Scholar]
- 8.Washburn W, Pollock B, Nichols L, Speeg K, Halff G. Impact of Recipient MELD Score on Resource Utilization. Am J Transplant. 2006;6:2449–54. doi: 10.1111/j.1600-6143.2006.01490.x. [DOI] [PubMed] [Google Scholar]
- 9.Feng S, Goodrich N, Bragg-Gresham J, Dyskstra D, Punch J, DebRoy M, et al. Characteristics associated with liver graft failure: The concept of a Donor Risk Index. Am J Transplant. 2006;6:783–90. doi: 10.1111/j.1600-6143.2006.01242.x. [DOI] [PubMed] [Google Scholar]
- 10.Axelrod DA, Schnitzler M, Salvalaggio PR, Swindle J, Abecassis MM. The economic impact of the utilization of liver allografts with high donor risk index. Am J Transplant. 2007;7(4):990–7. doi: 10.1111/j.1600-6143.2006.01724.x. [DOI] [PubMed] [Google Scholar]
- 11.Washburn WK, Meo NA, Halff GA, Roberts JP, Feng S. Factors influencing liver transplant length of stay at two large-volume transplant centers. Liver Transpl. 2009;15(11):1570–8. doi: 10.1002/lt.21858. [DOI] [PubMed] [Google Scholar]
- 12.de Vera ME, Lopez-Solis R, Dvorchik I, Campos S, Morris W, Demetris AJ, et al. Liver transplantation using donation after cardiac death donors: long-term follow-up from a single center. Am J Transplant. 2009;9(4):773–81. doi: 10.1111/j.1600-6143.2009.02560.x. [DOI] [PubMed] [Google Scholar]
- 13.Abecassis M. Making dollars and sense out of liver transplantation. Liver Transpl. 2009;15(10):1159–61. doi: 10.1002/lt.21851. [DOI] [PubMed] [Google Scholar]
- 14.Wiesner R, Edwards E, Freeman R, Harper A, Kim R, Kamath P, et al. Model for end-stage liver disease (MELD) and allocation of donor livers. Gastroenterology. 2003;124(1):91–6. doi: 10.1053/gast.2003.50016. [DOI] [PubMed] [Google Scholar]
- 15.Washburn WK, Pollock BH, Nichols L, Speeg KV, Halff G. Impact of recipient MELD score on resource utilization. Am J Transplant. 2006;6(10):2449–54. doi: 10.1111/j.1600-6143.2006.01490.x. [DOI] [PubMed] [Google Scholar]
- 16.Gold M, Siegal J, LB R, Weinstein M. Cost-effectiveness in health and medicine. New York: Oxford University Press; 1996. [Google Scholar]
- 17.Buchanan P, Dzebisashvili N, Lentine KL, Axelrod DA, Schnitzler MA, Salvalaggio PR. Liver transplantation cost in the model for end-stage liver disease era: looking beyond the transplant admission. Liver Transpl. 2009;15(10):1270–7. doi: 10.1002/lt.21802. [DOI] [PubMed] [Google Scholar]
- 18.Moylan CA, Brady CW, Johnson JL, Smith AD, Tuttle-Newhall JE, Muir AJ. Disparities in liver transplantation before and after introduction of the MELD score. Jama. 2008;300(20):2371–8. doi: 10.1001/jama.2008.720. [DOI] [PMC free article] [PubMed] [Google Scholar]
- 19.Jay CL, Lyuksemburg V, Kang R, Preczewski L, Stroupe K, Holl JL, et al. The increased costs of donation after cardiac death liver transplantation: caveat emptor. Ann Surg. 2010;251(4):743–8. doi: 10.1097/SLA.0b013e3181d3d3da. [DOI] [PubMed] [Google Scholar]
- 20.Pomfret EA, Fryer JP, Sima CS, Lake JR, Merion RM. Liver and intestine transplantation in the United States, 1996–2005. Am J Transplant. 2007;7(5 Pt 2):1376–89. doi: 10.1111/j.1600-6143.2007.01782.x. [DOI] [PubMed] [Google Scholar]
- 21.Schaubel DE, Sima CS, Goodrich NP, Feng S, Merion RM. The survival benefit of deceased donor liver transplantation as a function of candidate disease severity and donor quality. Am J Transplant. 2008;8(2):419–25. doi: 10.1111/j.1600-6143.2007.02086.x. [DOI] [PubMed] [Google Scholar]
- 22.Merion RM, Goodrich NP, Feng S. How can we define expanded criteria for liver donors? J Hepatol. 2006;45(4):484–8. doi: 10.1016/j.jhep.2006.07.016. [DOI] [PubMed] [Google Scholar]
- 23.Ammori J, Pelletier S, Lynch R, Cohn J, Ads Y, Campbell D, et al. Incremental costs of post-liver transplantation complications. J Am Coll Surg. 2008;206(1):89–95. doi: 10.1016/j.jamcollsurg.2007.06.292. [DOI] [PubMed] [Google Scholar]
- 24.Englesbe M, Dimick J, Mathur A, Ads Y, Welling T, Pelletier S, et al. Who pays for biliary complications following liver transplant? A business case for quality improvement. Am J Transplant. 2006;6:2978–82. doi: 10.1111/j.1600-6143.2006.01575.x. [DOI] [PubMed] [Google Scholar]
- 25.Abecassis M. Financial outcomes in transplantation--a provider’s perspective. Am J Transplant. 2006;6(6):1257–63. doi: 10.1111/j.1600-6143.2006.01329.x. [DOI] [PubMed] [Google Scholar]
- 26.Axelrod DA, Swindle J, Salvalaggio PR, Buchanan P, Schnitzler M. Reducing the cost of marginal organ utilization: is there a national learning curve? Am J Transplant. 2007;7:283–284. [Google Scholar]; Am J Transplant. 2007;(Suppl 7):283–4. (Abstr) [Google Scholar]
- 27.Selck FW, Grossman EB, Ratner LE, Renz JF. Utilization, outcomes, and retransplantation of liver allografts from donation after cardiac death: implications for further expansion of the deceased-donor pool. Ann Surg. 2008;248(4):599–607. doi: 10.1097/SLA.0b013e31818a080e. [DOI] [PubMed] [Google Scholar]