Abstract
Purpose
To improve the extent over which whole brain quantitative 3D-MRSI maps can be obtained and be used to explore brain metabolism in a population of healthy volunteers.
Materials and Methods
Two short TE (20 ms) acquisitions of 3D Echo Planar Spectroscopic Imaging at two orientations, one in the anterior commissure – posterior commissure (AC-PC) plane and the second tilted in the AC-PC +15° plane were obtained at 3T in a group of ten healthy volunteers. B1+, B1−, and B0 correction procedures and normalization of metabolite signals with quantitative water proton density measurements were performed. A combination of the two spatially normalized 3D-MRSI, using a weighted mean based on the pixel wise standard deviation metabolic maps of each orientation obtained from the whole group, provided metabolite maps for each subject allowing regional metabolic profiles of all parcels of the automated anatomical labeling (AAL) atlas to be obtained.
Results
The combined metabolite maps derived from the two acquisitions reduced the regional inter-subject variance. The numbers of AAL regions showing NAA SD/Mean ratios lower than 30% increased from 17 in the AC-PC orientation and 41 in the AC-PC+15° orientation, to a value of 76 regions out of 116 for the combined NAA maps. Quantitatively, regional differences in absolute metabolite concentrations (mM) over the whole brain were depicted such as in the GM of frontal lobes (cNAA=10.03+1.71, cCho=1.78±0.55, cCr=7.29±1.69; cmIns=5.30±2.67) and in cerebellum (cNAA=5.28±1.77, cCho=1.60±0.41, cCr=6.95±2.15; cmIns=3.60±0.74).
Conclusion
A double-angulation acquisition enables improved metabolic characterization over a wide volume of the brain.
Keywords: MRSI, whole brain, proton MR spectroscopy, metabolite maps, template
INTRODUCTION
Fast proton magnetic resonance spectroscopic imaging (MRSI) enables mapping of magnetic resonance (MR)-observable metabolites within the brain in a time compatible with clinical exams (1–4). The feasibility of whole-brain 3D-MRSI has been demonstrated (5,6) and reproducibility evaluated (7,8), indicating the value of this technique for studies of physiology (9) or for clinical applications, such as studies of Parkinson’s disease (10), traumatic brain injury (11) or epilepsy (12).
The requirement to obtain information over a wide region of the brain places increased demands on the quality of B0 shimming and RF pulse profiles. First, susceptibility variations cause local B0 distortions that cannot be corrected for using the commonly available shim terms, resulting in both local (intra-voxel) inhomogeneities, which degrade the MRS signal quality, as well as regions with incomplete water suppression as a result of more global and slowly-varying inhomogeneities. The magnitude and distribution of the residual field inhomogeneity is influenced by the B0 shimming capabilities, the region over which shimming is performed, and the shape of structures within the head relative to the B0 field (13). The effect of the local inhomogeneity can be partially reduced by using spatial oversampling methods to obtain smaller nominal voxel volumes, although at the expense of some loss in the signal-to-noise ratio and increase in the spatial sampling requirements. Several orientations of the imaging volume relative to the brain have been used, with alignment in the anterior commissure – posterior commissure (AC-PC) plane (11,14), in the AC-PC +10° plane (5,15) or in the AC-PC+15° plane (11) to minimize B0 inhomogeneity; however, an analysis of the relative performance of these differences has not been presented. An additional factor that affects spectral quality is non-ideal RF pulse profiles and inhomogeneities, particularly at higher field strengths, combined with the effect of chemical-shift differences, which lead to variable signal intensity and loss of signal in distal parts of the excited region. Large brain coverage therefore requires correction for inhomogeneities of the transmit (B1+) and receive (B1−) radiofrequency fields (16–18).
A second limitation to the wider use of volumetric MRSI is the influence of strong signals from subcutaneous lipids that can contaminate voxels within the brain, which can occur even with the implementation of lipid suppression methods. To lessen the impact of these lipid signals, most previous clinical applications (6,11,14) have used medium to long TEs (≥70ms), which limits the observed metabolites to N-Acetyl Aspartate (NAA), total Creatine (Cr) and total choline (Cho) levels and incurs some T2 signal loss.
Finally, for comparative measurements of single metabolites the normalization procedures remain an important consideration. Accurate quantification methods are time consuming and complex, and therefore several semi-quantitative methods have been proposed (19–22) of which the most time efficient and robust uses normalization of spectroscopic data with tissue water density derived from a MRI measurement (19,20,23,24).
In this study acquisition and post-processing procedures have been developed to optimize the quality of quantitative metabolite maps covering a wide region of the brain, within a time that is compatible with a clinical exam.
MATERIALS AND METHODS
Subjects
Ten healthy volunteers (mean age=26.2±4.7 years, age range=20–36, five women and five men) were included in this protocol. All subjects gave their consent to participate to the study, which was approved by the local committee on ethics.
MRI
Data were acquired on a 3T Magnetom Verio system (Siemens SA, Erlangen, Germany) using a 32-channel receiver head coil.
For each acquisition orientation, the MRI protocol included: i) high resolution structural axial T1-weighted Magnetization Prepared Rapid Gradient Echo (MPRAGE) sequence (TR/TE/TI=2151ms/3.4ms/1100ms; α=8°; pixel size=1×1×1mm3, FOV=256×256mm2; matrix=256×256; number of partitions=176, TA=5min) ii) multiple gradient echo (MGE) sequence for T2* mapping (TR/TE1/TE2/TE3/TE4/TE5=4000ms/3.36ms/10ms/20ms/40ms/80ms; α=17°; 44 contiguous slices; thickness=3mm, FOV=220×220mm2; matrix=256×256; TA=3.6min), Driven Equilibrium Single Pulse Observation of T1 (DESPOT1) (25) sequence (TR/TE=20/4.9ms; α1/α2=2°/13°; 44 contiguous slices; thickness=3mm, FOV=200×200mm2; matrix=256×256; TA=4.1min) and B1+ mapping 3D-EPI (XEP) (26) sequence (TR/TE=20000/21ms; 22 slices; thickness=3.43mm; slice gap=2.57mm; FOV=220×220mm2; matrix=64×64; TA=0.7min) used to generate quantitative water proton density maps.
The protocol was used for both orientations to minimize realignment errors, but a rigid registration of the MRSI to the T1 MPRAGE could also have been used.
MRSI
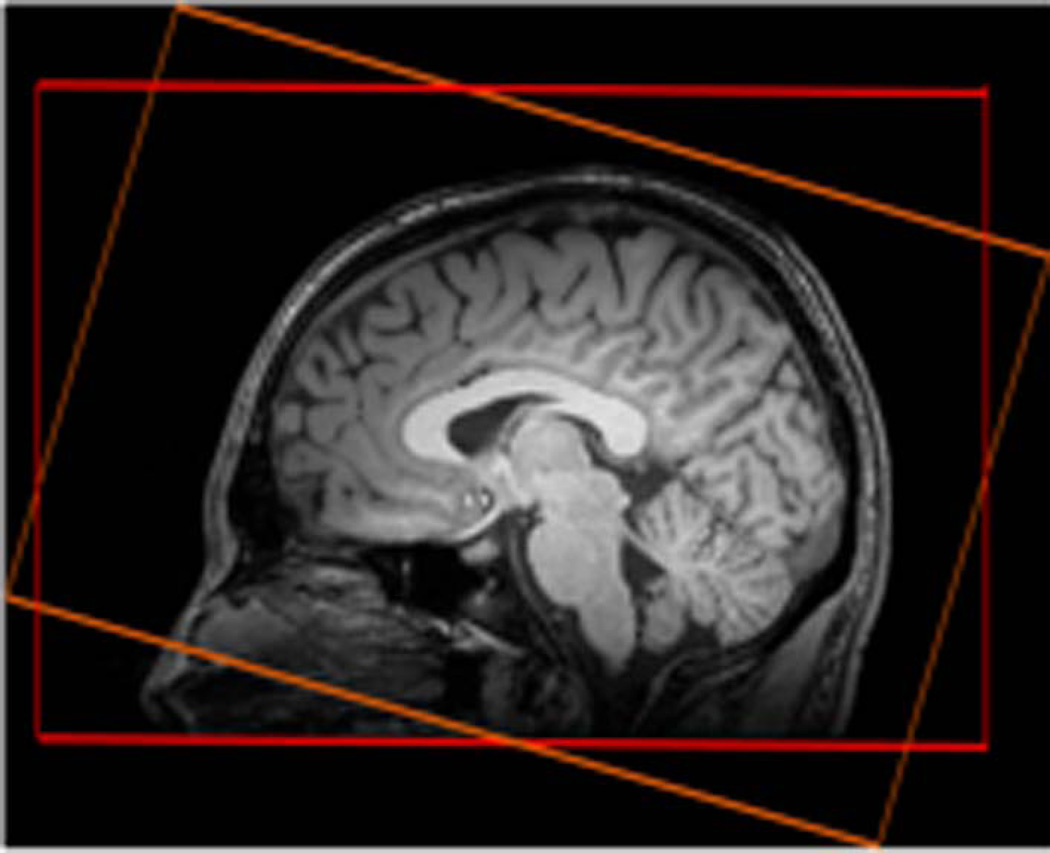
The MRSI protocol included two axial fast 3D-Echo-Planar spectroscopic imaging (EPSI) sequences (15) with two different angulations of slabs aligned along the AC-PC and the AC-PC+15° planes. The EPSI data were acquired with chemical shift-selective (CHESS) water suppression, lipid inversion nulling with TI=198 ms, and the following parameters (spin–echo acquisition TR/TE=1710ms/20ms; α=73°; 50×50×18 k-space points; FOV=280×280×180mm3; GRAPPA factor=2; TA=18min. The slab selection width was 140mm and slab selections were positioned as shown in Fig 1. An interleaved water reference acquisition was also obtained during the TR using a gradient-echo acquisition (TE=6.3ms; α=20°).
Figure 1.
Slab selection positions: AC-PC (in red) and AC-PC+15° (in orange)
For each orientation, the shim was first adjusted (1st order) using the automatic 3D mapshim procedure (performed at least two times to get a stable phase map). Then, manual shimming was performed until obtaining a water line width in the volume of adjustment below 30Hz. Frequency was adjusted before each acquisition. The FWHM of the water signal were checked for the two angulations to verify that the B0 shimming over the whole slabs were equivalent for both acquisitions. In addition, RF power settings remained unchanged for both acquisitions. The protocol was first conducted on an external phantom filled with NaCl (0.9%) and NAA solution (40mM). Data from the phantom was used to external reference for metabolite quantifications.
Data processing
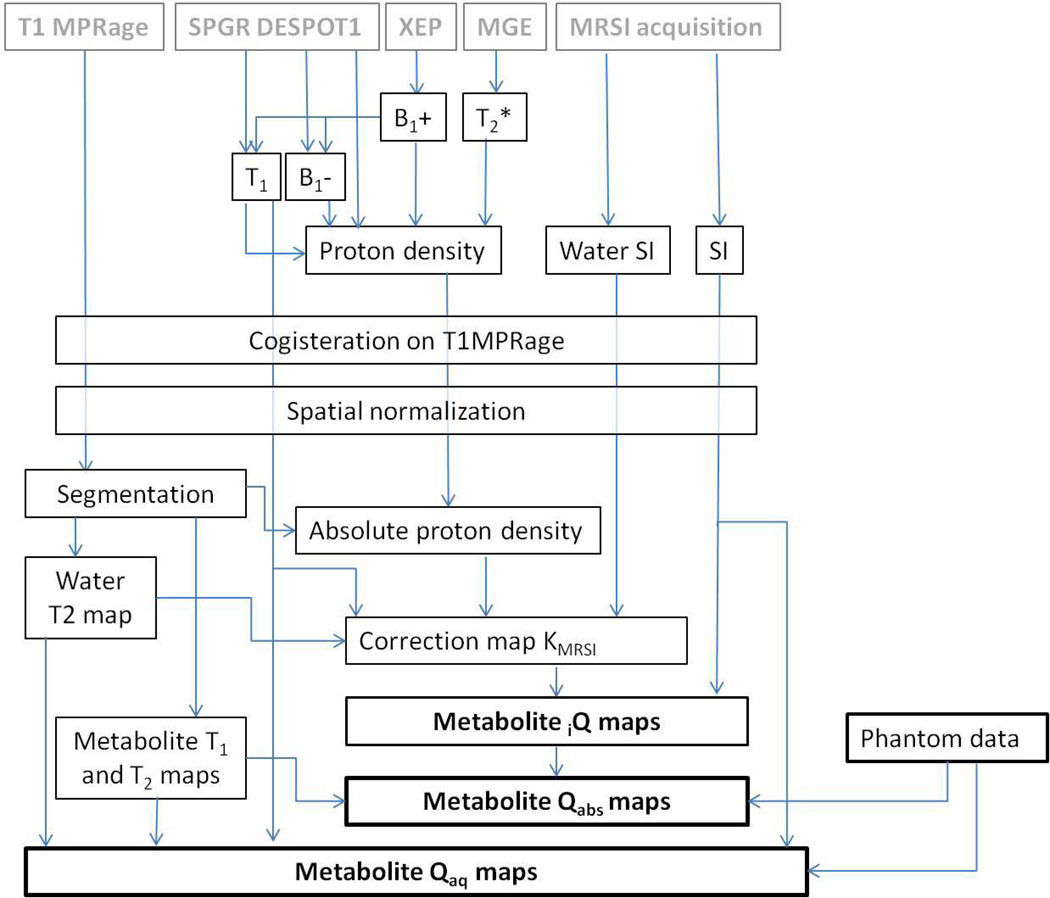
In Fig. 2 is shown the post-processing pipeline. Maps of T2*, T1, B1+, B1−, and the proton density ρ were generated using the CSIAPO software (27) developed using IDL (Exelis, USA). The water T2* map was assessed using a voxel-based least square fitting algorithm using five different TEs. B1+ mapping was generated using XEP data. T1, B1− and relative ρ maps were calculated using data acquired using the SPGR DESPOT1 sequence as previously described. The acquired multichannel MRSI data were processed with the MIDAS (Metabolic Imaging and Data Analysis System) software package to generate maps of water, NAA, Cr, Cho, and mIns. Spectral fitting and image reconstruction were based on the procedure described by Soher et al. (28) consisting in a parametric spectral modelling using acquisition specific, a priori information combined with a wavelet-based, nonparametric characterization of baseline signals (28). For image reconstruction, the initial fit estimates were additionally modified according to similarity with results in neighboring voxels from a previous iteration. Calculated ρ maps and water SI maps acquired at each angulation were co-registered and re-sliced on their respective T1-weighted MPRAGE (orientation AC-PC or AC-PC+15°) using SPM8 (Welcome Trust Institute, London, UK).
Figure 2.
Post-processing pipeline used to generate the metabolite maps.
The angulations of the two MRSI studies were chosen so as to be sufficiently large to enable good quality spectra to be obtained in all brain regions on at least one of the acquisitions, while also allowing accurate automatic spatial normalization using the SPM8 procedure. The transformation matrices of the SI maps onto the T1 images were applied to all metabolite maps for each acquisition, respectively. The two MPRAGE volumes were then normalized in the MNI template by a non-linear transformation. MPRAGE was also used to obtain GM and WM density through segmentation conducted using the VBM8 procedure (SPM8 toolbox). The transformation matrix was then applied on the coregistered ρ and metabolites maps.
The water concentration map was scaled using a region located in white matter (WM density mask thresholded at 75%) and assumed to be composed of 70% of water (17,29,30). Institutional metabolite quantification (iQ), metabolite quantification relative to absolute water concentration (Qabs) and metabolite quantification relative to aqueous water concentration (Qaq) maps were then generated as described below:
iQ maps
The unsuppressed water MRSI SH2O,MRSI was pixel-wise corrected by water relaxation effects RH2O (T1,H2O and T2,H2O effects) and by the absolute water proton-density map Sρ,abs which was down-sampled to the MRSI resolution. To correct for the effects of B1 inhomogeneities and slice selection profiles a correction factor, KMRSI,i, for each voxel i was derived from Eq. 1:
| [Eq.1] |
Metabolite maps Smet,MRSI,i were then multiplied by this previously calculating scaling factor KMRSI,i, to obtain normalized metabolite maps (Eq.2) which corresponded to the institutional quantification (iQmet,i) expressed in institutional units.
| [Eq.2] |
Qabs maps
Subject metabolite quantification maps Qabs,met_subj,i relative to absolute ρ maps were obtained from subject i,Q metabolite maps iQmet_subj,i corrected from relaxation effects of subject metabolites R(T1,met_subj,T2,met_subj) (35, 36) and from the extra acquisition on the reference phantom containing known metabolite concentration Qabs,met_ref that was performed before or after the subject scans. Metabolite quantification Qabs,met_subj maps expressed in mM were generated using Eq.3 and Eq.4.
| [Eq.3] |
The term Kabs,met_subj,ref,i took into account the metabolite and relaxation effects for both subjects and external phantom (Eq.4).
| [Eq.4] |
Qaq maps
Metabolite quantification maps relative to aqueous water concentration, in other words relative to the volume of the cellular water (22), were also generated using the phantom acquisition. Metabolite aqueous quantification maps were obtained using Eq.5.
| [Eq.5] |
Where RH2O and Rmet accounted for T1 and T2 effects in the phantom and subject data and Kaq for the NAA concentration in the phantom and the signal intensity of NAA in the phantom. While the brain water concentration was determined quantitatively using water acquisition interleaved with metabolite MRSI, the metabolite/water signals ratio were not corrected for coil loading and receiver gain.
Water T1 maps were reconstructed from the SPGR acquisition. Subjects water T2 maps used to calculate correction factors were generated from density probability maps of the three compartments, i.e. grey matter (GM), white matter (WM) and cerebrospinal fluid (CSF), assuming a priori values of 69 ms for WM, 88 ms for GM and 200 ms for CSF (31) Mono-exponential spin-lattice (32) and spin-spin relaxation times (33) were assumed to be 1470 ms and 236 ms for NAA, 1300 ms and 227 ms for Cho and 1460 ms and 156 ms for Cr, respectively in GM and 1350 ms and 290 ms for NAA, 1080 ms and 216 ms for Cho and 1240 ms and 153 ms for Cr, respectively in WM. Metabolite iQ, Qabs and Qaq maps were generated for NAA, Cho, Cr and mIns for each volunteer and each orientation plane.
Means (M) and normalized standard deviations nSD= σ/mean with across subjects were generated for all metabolites and both orientations. The quality criterion to include a pixel in the metabolic map consisted in applying a threshold of 1 SD on the group nSD maps in order to generate a robust metabolic template at the group level without numerous sparse excluded pixels. These global masks were then applied to the subject maps for each metabolite, respectively.
A weighted mean wM as defined in Eq.6 was used to combine the both oriented EPSI to generate optimized metabolite maps that favored the most reliable measurement. The generation of the combination map used AC-PC and AC-PC+15° metabolite maps before application of the quality criterion in order to preserve maximum information of both acquisitions. The threshold of 1 SD was applied on the map defined by the minimum between AC-PC and AC-PC+15° nSD across subjects.
| [Eq.6] |
To assess regional differences of brain metabolite levels, the mean values of the concentrations and SD maps were obtained in regions of interest as defined by the AAL atlas, which were obtained using Brain VISA (http://www.brainvisa.info), and from four external lobes, using WFU Pickatlas toolbox were applied.
Statistics
Spectral differences in terms of signal-to-noise ratio (SNR), linewidth and areas under the spectral curve were assessed in two extreme regions, the cerebellum and the fronto-parietal region, between AC-PC and AC-PC+15° data on all subjects using non parametric Wilcoxon test (p<0.05).
Statistical mapping (SPM8, paired two sample t-tests p<0.05, k=5, FDR corrected) was used to compare on a voxel-by-voxel basis the metabolite levels between the two orientations of the 3D-MRSI (AC-PC plane and AC-PC +15° respectively).
At the regional level, the AAL parcels were used to determine the metabolic levels in each brain regions.
Metabolic dependences of brain regions, hemisphere sides and subjects were assessed using one-way ANOVA (jmp9, http://www.jmp.com/).
RESULTS
Effect of 3D-MRSI orientations on spectral quality
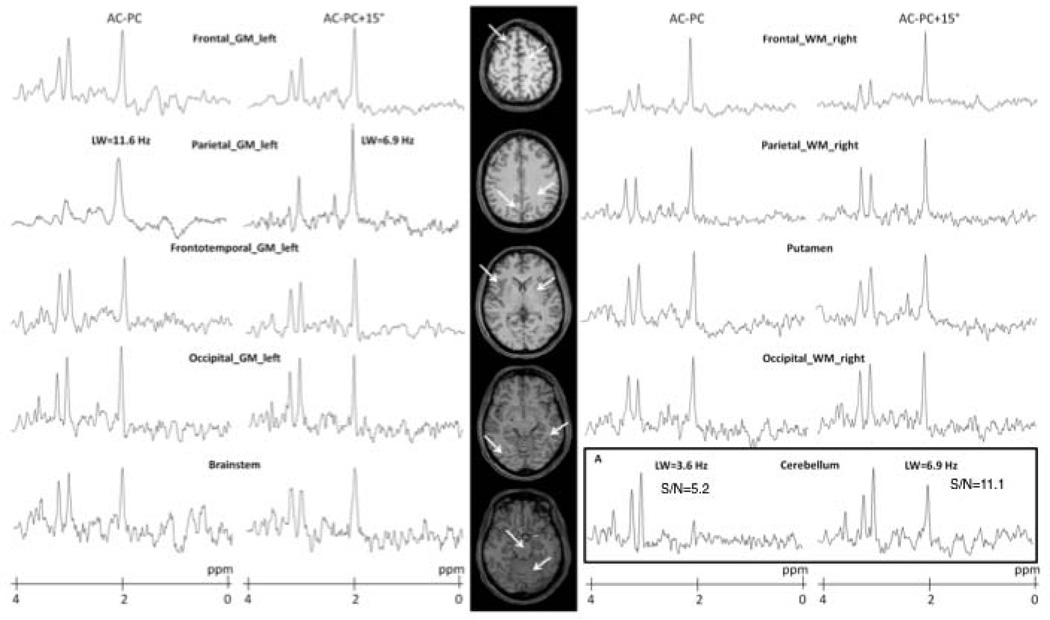
The impact of orientation on the water linewidth maps as well as statistical mapping of the differences are illustrated in supplemental figure 1. Examples of metabolite spectra obtained at short TE with the two 3D-MRSI studies are presented in Fig.3 for ten cerebral structures from a healthy subject. Comparing spectra acquired according the two orientations in two extreme regions (the cerebellum and the fronto-parietal region) a significant between-group difference in SNR and NAA area were observed in the cerebellum (p=0.022 and p=0.050, respectively) (Fig.3). Moreover, a linewidth significant difference was seen in the upper region (p=0.011). In Fig. 3A, the NAA peak was significantly decreased in AC-PC plane compared to AC-PC+15° plane.
Figure 3.
Spectra obtained at short TE acquisition (20 ms) acquired along AC-PC and AC-PC+15° line from five slices of one healthy volunteer. Examples are shown for data obtained in different areas for the two orientations. On the bottom right is shown a case where NAA signal has disappeared on the AC-PC MRSI while it is easily observed in the AC-PC +15° MRSI.
Differences in metabolite levels according to the 3D MRSI orientation
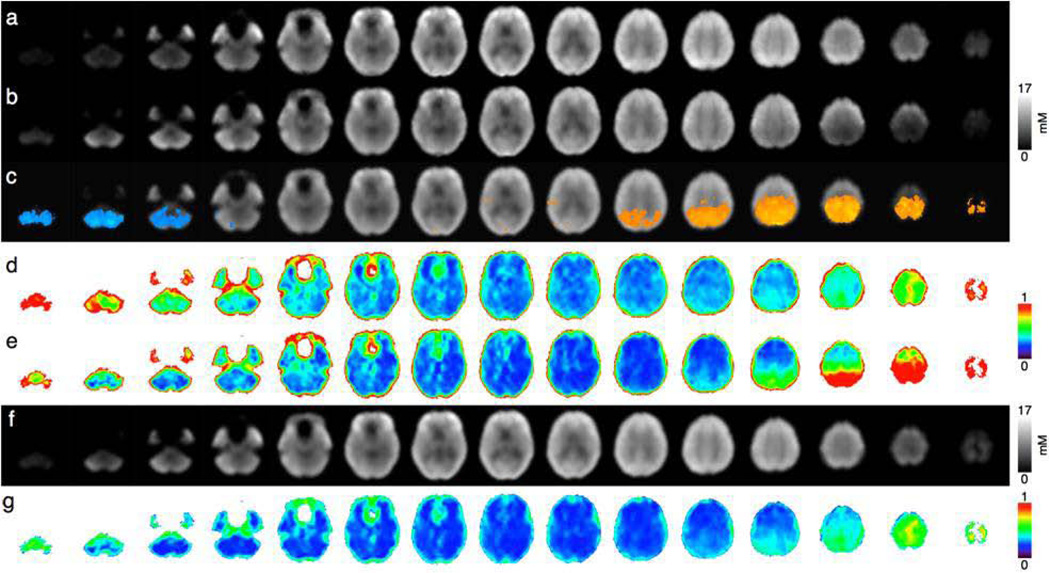
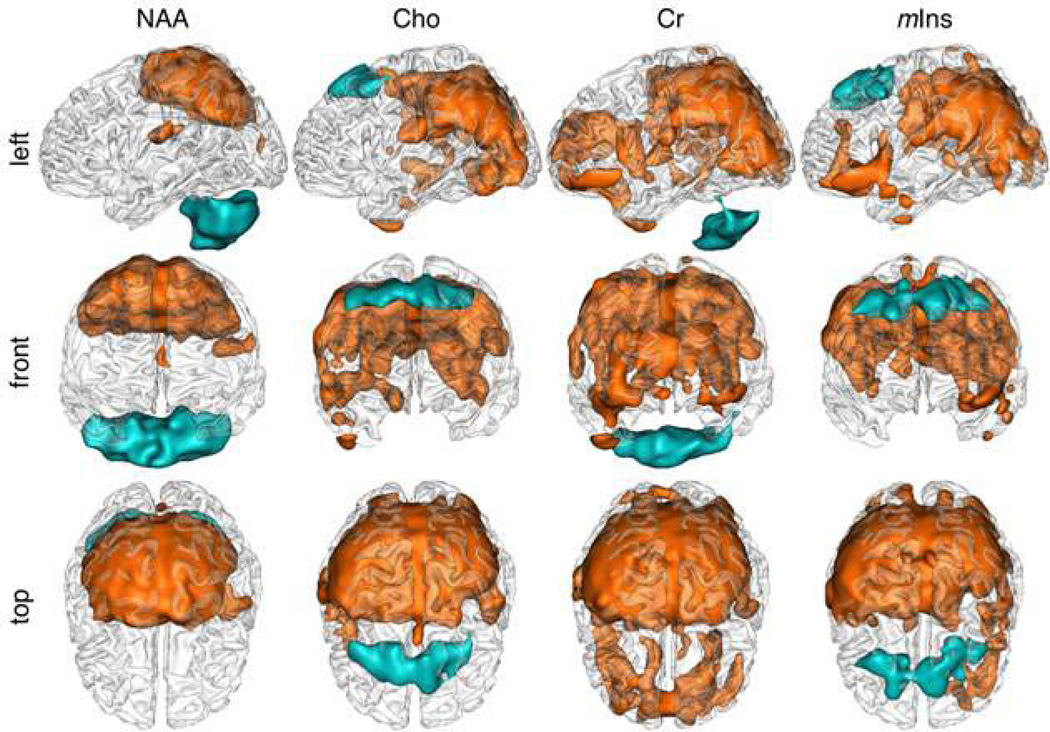
Spatially normalized Qabs NAA concentration maps reconstructed from the 3D-EPSI data are presented in Fig. 4a (AC-PC plane), and in Fig. 4b (AC-PC+15° plane). The statistical mapping analyses comparing the two maps are presented in Fig 4c. Significant differences in NAA values were seen in the cerebellum - with lower values for the AC-PC acquisition (Fig.4c and Fig 5 in blue) - and in upper slices - with lower values for AC-PC+15° acquisition (Fig.4c and Fig. 5 in orange). These regional differences matched with nSD maps from the 10 volunteers acquired in the AC-PC plane (Fig 4d) and in the AC-PC+15° plane (Fig 4e) from which the largest SD were found in the cerebellum in the AC-PC plane (Fig.4d) while in the AC-PC+15° plane the largest SD were observed in the upper slices (Fig.4e) bilaterally.
Figure 4.
Mean NAA concentration maps (Qabs) across 10 subjects for (a) AC-PC and (b) AC-PC+15°orientation lines, (c) mean maps with regions where AC-PC values are significantly higher (in orange) and lower (in blue) than AC-PC+15° values (p<0.05), nSD maps across subjects for (d) AC-PC and (e) AC-PC+15° orientations, (g) weighted NAA mean and (f) SD across subjects of weighted NAA means.
Figure 5.
Spatial representations (left (a), front (b) and top (c) views) of significant differences between AC-PC and AC-PC+15° Qabs mean values for NAA, Cho, Cr and mIns: mean AC-PC values significantly higher than AC-PC+15° values (p<0.05, k=5, FDR corrected) in orange and lower in blue.
Pixel-wise 3D-displays of significant differences in metabolite concentrations between the two orientations (Fig.5) showed comparable patterns for NAA, Cr, Cho and mIns, with larger differences in the cerebellum for NAA and Cr and larger differences in the medial prefrontal cortex for Cho and mIns.
Combination of the two 3D-MRSI acquisitions with different orientations
Pixel-based weighted mean were performed for each metabolite. As shown in Figs. 4a, 4b and 4f and in Figs. 4d, 4e and 4g, respectively, the combination provided more homogeneous metabolic maps and SD maps with lower values for all metabolites
Regional Metabolite concentrations using the AAL atlas
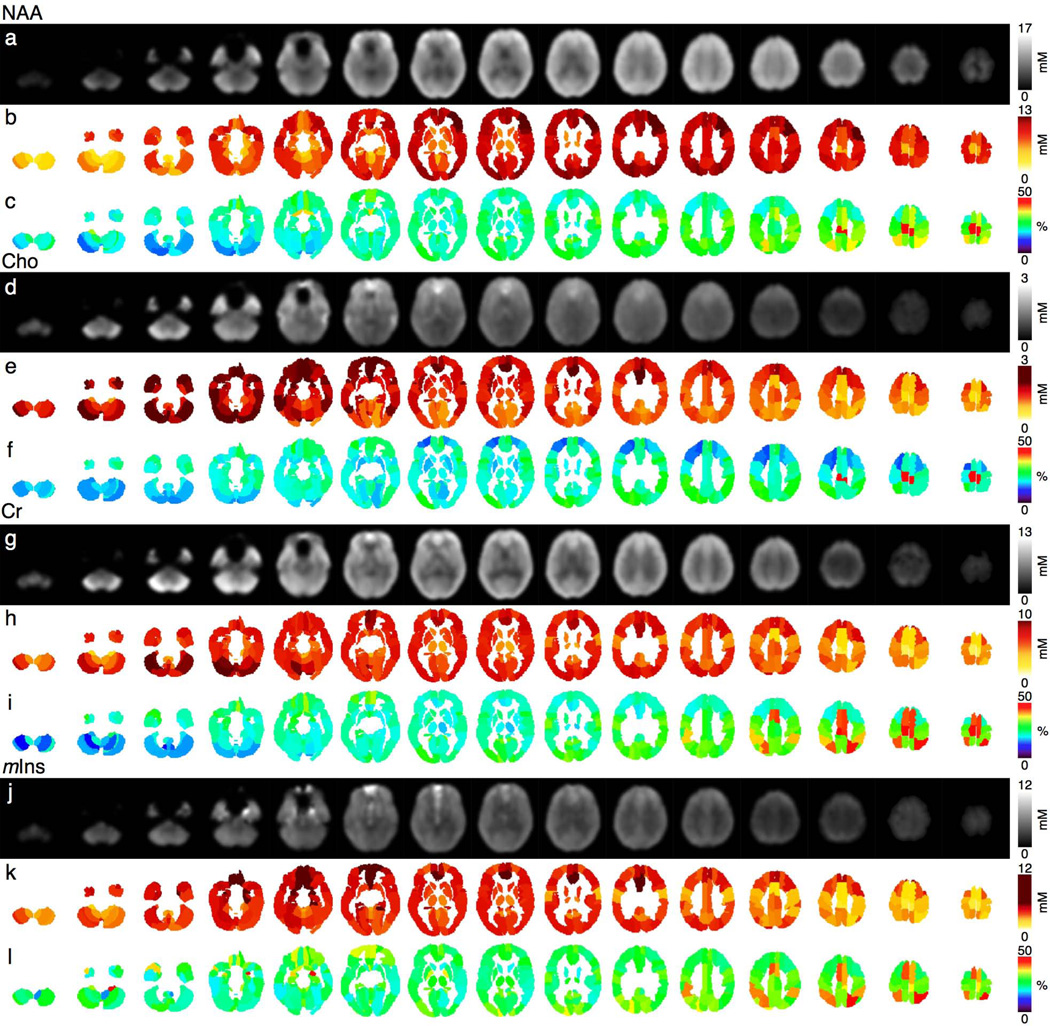
Using the AAL parcellation, metabolite concentrations from the spatially normalized metabolic maps were extracted from each brain regions (Fig.6) for the two orientations and the combined maps.
Figure 6.
(a,d,g,j) Pixel-based weighted mean, (b,e,h,k) averaged weighted mean and (c,f,i,l) SD (% of the mean) in AAL regions for NAA, Cho, Cr and mIns Qabs, averaged for10 healthy volunteers, respectively.
At the regional level, metabolic mean and SD values across subjects derived from the weighted combination maps were found to be more homogeneous compared to single orientation maps. The numbers of regions with the NAA SD/Mean ratios lower than 30% were 17 and 41 for single AC-PC and AC-PC+15° oriented 3D-MRSI respectively, while the combination showed up to 76 out of the 116 regions with NAA SD/mean ratios below 30%. NAA SD/Mean ratios in the range of 30%–50% were observed in 94, 64 and 38 regions for the AC-PC-oriented, ACPC+15°-oriented and combined 3D-MRSI respectively. NAA SD/mean ratios above 50% were observed in five regions of the AC-PC oriented MRSI (L/R paracentral lobules, L/R cerebellum, L olfactory cortex), in eleven of the AC-PC+15° oriented MRSI (L/R paracentral lobules, L/R superior parietal cortices, L/R cerebellum, L/R orbital medium frontal cortices, R olfactory cortex, R inferior parietal lobule and L middle temporal lobe) but only in two regions for the combination (L/R paracentral lobules). For the other metabolites, regional inter-subject SD/mean below 30% were observed for the combination within 95 regions for Cho, 79 regions for Cr and 41 regions for mIns, within 119 regions for Cho, 31 for Cr and 71 for mIns in the range of 30%–50% and within 2 regions for Cho (L/R paracentral lobule), 6 for Cr (L/R paracentral lobule, L/R superior parietal, L/R supplementary motor area) and 4 for mIns (R amygdala, R cerebellum, R superior parietal lobule, L supplementary motor area) for SD/mean >50% (Fig. 6c).
Metabolite concentrations (relative and absolute) of AAL regions are reported in supplementary Table 1. Based on these data, it is possible to determine for example the average absolute GM metabolite concentrations (mM) in the frontal lobes (cNAA=10.03+1.71, cCho=1.78±0.55, cCr=7.29±1.69; cmIns=5.30±2.67), in the temporal lobes (cNAA=9.84±0.77, cCho=1.94±0.36, cCr=8.01±0.43; cmIns=4.75±0.40) or in the cerebellum (cNAA=5.28±1.77, cCho=1.60±0.41, cCr=6.95±2.15; cmIns=3.60±0.74).
The ANOVA analysis applied to determine the impact on metabolic concentrations of brain regions (AAL parcels, left and right laterality) and of subjects showed a significant global effect (F<0.0001) with significant subject effect (p<0.0001), regional area effect (p<0.0001) and hemispheric side effect (p<0.0001) except for mIns, which did not show significant laterality effect (p=0.081).
DISCUSSION
This study has demonstrated the advantage of combining two axial 3D-MRSI acquisitions with a relative tilt of 15° to improve accuracy and reliability of whole-brain metabolic maps. Inhomogeneity field corrections and signal normalization also allowed us to provide quantitative measures of NAA, Cho, Cr and mIns measured at short echo times (TE=20ms).
The first step used to improve reliability of large brain coverage with 3D-MRSI at high field was to correct for radiofrequency field inhomogeneities and B0 inhomogeneities responsible for spatial variations in contrast and sensitivity. The protocol used to calculate proton density allowed correcting for the different parameters such as B1−, B1+, T1 and T2* within a reasonable clinical scan time. Various methods have been proposed to map B1+ inhomogeneities such as DREAM sequence (Dual Refocusing Echo Acquisition Mode) (16) or the XEP sequence presently used that has the advantage to be robust and sufficiently short compared to the conventional in-vivo AFI (Actual Flip Angle) method (18) due to reduced acquisition times.
To optimize the sampling of distal regions, we adopted an original approach that combined two 3D-MRSI acquisitions acquired in two different orientation planes in order to benefit from the best spectrum quality of each acquisition. Optimizing the orientation of 3D-MRSI has already been proposed to improve the spectral quality of SI in clinically relevant regions leading to the authors to choose 3D-MRSI volumes aligned in the AC-PC (11,14), the AC-PC+10° (5,15) or the AC-PC+15° (11) planes. But, to our knowledge, combination of two different 3D-MRSI volumes has not yet been reported. The current choice of AC-PC and AC-PC +15° planes was dominated by the need to get sufficiently different brain coverage with the two MRSI volumes provided by a large difference in the orientation tilt but also to enable the coregistration step to be accurately performed to get the two volumes transferred in the MNI template. After spatial normalization and alignment in the MNI template, it was possible to compare the SD maps of the two acquisitions. The AC-PC aligned 3D-MRSI was better for the superior slices, while the AC-PC+15° performance was better for the cerebellum and inferior slices. These observations were in line with the B0 homogeneity profiles of each orientation as assessed by the water linewidth maps. The combination of the two minimized local SD and provided more reliable metabolite concentrations than a single orientation acquisition.
MRSI signal normalization was also implemented to make full use of the available information, to convert metabolite signal into absolute or relative concentrations and permit comparisons with normative values. Among the different techniques proposed in the literature used to standardize metabolite signal such as electronic reference (ERETIC) (34), internal water standard (35), and external standard with compartmental analysis (19). Of these, the use of internal tissue water as a reference (20,21) is relatively convenient to implement, and was used in this study. Moreover, this technique allowed us to correct for RF pulse profiles. Using optimal post-processing and fitting procedures developed in the MIDAS software, it was possible to accurately fit the spectra even in the presence of macromolecules and residual unsuppressed water signal (14). This study has also presented normative values of metabolites evaluated at short TE with a wide sampling of the brain, whereas previously-reported values were obtained at short TE’s were derived from single-voxel spectroscopy (22,24,36) or MRSI covering only part of the brain (37).
For voxel-based comparisons between or within subjects, or atlas-based ROI measurement, it is necessary to apply spatial registration to a standard reference. The AAL atlas is a widely used manual macroanatomical division of the single subject MNI-space template brain.
The ROI analyses of whole brain metabolite maps using the AAL atlas demonstrates that metabolite distributions are spatially dependent. We were able to report the average values and SD of metabolite concentrations (absolute, aqueous, relative) in the 116 regions of AAL obtained from the ten healthy controls that could be used to evaluate regional metabolic abnormalities in a given subject.
From a qualitative point of view, the combination of the two 3D-MRSI acquisitions improved the robustness of the metabolite measurements, with lower SD/Mean ratios in the final combined metabolite maps. Only 2 out of the 116 AAL regions showed inter-subject NAA SD/mean above 50% (in the SMA and PCC), The poor accuracy in these regions has to be taken into account during regional or pixel-wise group analyses.
The primary cause of signal variations in the superior and inferior brain regions was due to the effect of the RF pulse profiles, which covered a 14 cm full-width-half-maximum slab, and the chemical shift artifact. In spite of RF pulse profile correction via SI normalization, the signal-to-noise (SNR) ratios in these regions were low, which impacted spectral fitting and introduced high inter-subject variability. The combination of the two maps with different orientations compensated for this effect and improved homogeneity of the MRSI signal across the volume. Alternatively, the use of RF adiabatic pulses and a wider selection profile should alleviate this artifact, although may introduce additional concerns due to the effects of unsuppressed water and lipid signals. It should also be noted that improved performance can be obtained in either one of the distal regions by moving the slab selection; however, the aim of this study was to sample a wide region of the brain and therefore a more centrally-located slab selection was used.
The present results were derived from a limited sample of subjects (n=10) that cannot be considered as a sufficient population to provide normative values. Increasing the numbers of healthy subjects and accounting for age, gender (22,38–40) are prerequisite for moving to real clinical application of this method. Moreover, concentration values in this study were not corrected from CSF contribution which can be expected to lead to an underestimation of metabolite concentrations in cortical and ventricular regions. As a result, the standard deviation/mean expressed in % determined in this study are larger than those presented in a previous study (6) using a longer TE of 70 ms and a group of 44 subjects, where values were largely under 10%. An additional limitation of this study is that the effect of B0 inhomogeneity on the spectral quality was not directly analyzed. Previous studies have shown that angulation of the head relative to the B0 direction can impact whole-brain B0 field maps (13) although the impact of the volume selected for B0 shimming has not been specifically investigated. To improve robustness of the metabolic maps supplementary exclusion criteria should be included to exclude voxels based on Cramer Rao bounds (CRB) and linewidth values. Moreover, the use of the EPSI sequence, though allowing fast acquisition time, makes the data sensitive to spatial distortion that can lead to some extent to misregistration with the AAL atlas derived from high resolution T1-weighted images. Finally, strategies to combine the two 3D-MRSI at the individual level without considering the whole group of controls would be of interest in cases when statistical mapping analyses would not be the main goal.
In conclusion, the combination of two short-TE 3D-MRSI acquisitions with different orientations coupled with procedures for inhomogeneity corrections and signal normalization enabled generation of high quality metabolite maps of the whole brain, with improved inter-subject variation. These results indicated improved methods for future statistical mapping analyses of 3D-MRSI derived metabolic data.
Supplementary Material
Acknowledgments
The first author (AL) is the recipient of a PhD grant (CIFRE) supported by Siemens France and the French Ministry of Research (ANRT). Additional support was provided by NIH grant R01EB000822 (AAM).
ABBREVIATIONS
- 3D-MRSI
volumetric magnetic resonance spectroscopic imaging
- AAL
automated anatomical labeling
- AC-PC
anterior commissure – posterior commissure
- MNI
Montreal neurological institute
- Qabs
absolute quantification
- Qaq
aqueous quantification
- iQ
institutional quantification
REFERENCES
- 1.Cunningham CH, Vigneron DB, Chen AP, et al. Design of fly back echo-planar readout gradients for magnetic resonance spectroscopic imaging. Magn Reson Med. 2005;54(5):1286–1289. doi: 10.1002/mrm.20663. [DOI] [PubMed] [Google Scholar]
- 2.Hanson LG, Schaumburg K, Paulson OB. Reconstruction strategy for echo planar spectroscopy and its application to partially under sampled imaging. Magn Reson Med. 2000;44(3):412–417. doi: 10.1002/1522-2594(200009)44:3<412::aid-mrm11>3.0.co;2-p. [DOI] [PubMed] [Google Scholar]
- 3.Otazo R, Tsai SY, Lin FH, Posse S. Accelerated short-TE 3D proton echo-planar spectroscopic imaging using 2D-SENSE with a 32-channel array coil. Magn Reson Med. 2007;58(6):1107–1116. doi: 10.1002/mrm.21426. [DOI] [PubMed] [Google Scholar]
- 4.Posse S, DeCarli C, Le Bihan D. Three-dimensional echo-planar MR spectroscopic imaging at short echo times in the human brain. Radiology. 1994;192(3):733–738. doi: 10.1148/radiology.192.3.8058941. [DOI] [PubMed] [Google Scholar]
- 5.Ebel A, Soher BJ, Maudsley AA. Assessment of 3D proton MR echo-planar spectroscopic imaging using automated spectral analysis. Magn Reson Med. 2001;46(6):1072–1078. doi: 10.1002/mrm.1301. [DOI] [PubMed] [Google Scholar]
- 6.Maudsley AA, Domenig C, Govind V, et al. Mapping of brain metabolite distributions by volumetric proton MR spectroscopic imaging (MRSI) Magn Reson Med. 2009;61(3):548–559. doi: 10.1002/mrm.21875. [DOI] [PMC free article] [PubMed] [Google Scholar]
- 7.Maudsley AA, Domenig C, Sheriff S. Reproducibility of serial whole-brain MR spectroscopic imaging. NMR Biomed. 2010;23(3):251–256. doi: 10.1002/nbm.1445. [DOI] [PMC free article] [PubMed] [Google Scholar]
- 8.Gu M, Kim DH, Mayer D, Sullivan EV, Pfefferbaum A, Spielman DM. Reproducibility study of whole-brain 1H spectroscopic imaging with automated quantification. Magn Reson Med. 2008;60(3):542–547. doi: 10.1002/mrm.21713. [DOI] [PMC free article] [PubMed] [Google Scholar]
- 9.Posse S, Olthoff U, Weckesser M, Jancke L, Muller-Gartner HW, Dager SR. Regional dynamic signal changes during controlled hyperventilation assessed with blood oxygen level-dependent functional MR imaging. AJNR Am J Neuroradiol. 1997;18(9):1763–1770. [PMC free article] [PubMed] [Google Scholar]
- 10.Levin BE, Katzen HL, Maudsley A, et al. Whole-brain proton MR spectroscopic imaging in Parkinson's disease. J Neuroimaging. 2014;24(1):39–44. doi: 10.1111/j.1552-6569.2012.00733.x. [DOI] [PMC free article] [PubMed] [Google Scholar]
- 11.Govind V, Gold S, Kaliannan K, et al. Whole-brain proton MR spectroscopic imaging of mild-to-moderate traumatic brain injury and correlation with neuropsychological deficits. J Neurotrauma. 2010;27(3):483–496. doi: 10.1089/neu.2009.1159. [DOI] [PMC free article] [PubMed] [Google Scholar]
- 12.Maudsley AA, Domenig C, Ramsay RE, Bowen BC. Application of volumetric MR spectroscopic imaging for localization of neocortical epilepsy. Epilepsy Res. 2010;88(2–3):127–138. doi: 10.1016/j.eplepsyres.2009.10.009. [DOI] [PMC free article] [PubMed] [Google Scholar]
- 13.Tyszka JM, Mamelak AN. Quantification of B0 homogeneity variation with head pitch by registered three-dimensional field mapping. J Magn Reson. 2002;159(2):213–218. doi: 10.1016/s1090-7807(02)00101-5. [DOI] [PubMed] [Google Scholar]
- 14.Maudsley AA, Darkazanli A, Alger JR, et al. Comprehensive processing, display and analysis for in vivo MR spectroscopic imaging. NMR in biomedicine. 2006;19(4):492–503. doi: 10.1002/nbm.1025. [DOI] [PMC free article] [PubMed] [Google Scholar]
- 15.Ebel A, Maudsley AA. Improved spectral quality for 3D MR spectroscopic imaging using a high spatial resolution acquisition strategy. Magn Reson Imaging. 2003;21(2):113–120. doi: 10.1016/s0730-725x(02)00645-8. [DOI] [PubMed] [Google Scholar]
- 16.Nehrke K, Versluis MJ, Webb A, Bornert P. Volumetric B1 (+) mapping of the brain at 7T using DREAM. Magn Reson Med. 2014;71(1):246–256. doi: 10.1002/mrm.24667. [DOI] [PubMed] [Google Scholar]
- 17.Volz S, Noth U, Rotarska-Jagiela A, Deichmann R. A fast B1-mapping method for the correction and normalization of magnetization transfer ratio maps at 3 T. Neuroimage. 2010;49(4):3015–3026. doi: 10.1016/j.neuroimage.2009.11.054. [DOI] [PubMed] [Google Scholar]
- 18.Yarnykh VL. Actual flip-angle imaging in the pulsed steady state: a method for rapid three-dimensional mapping of the transmitted radiofrequency field. Magnetic resonance in medicine : official journal of the Society of Magnetic Resonance in Medicine / Society of Magnetic Resonance in Medicine. 2007;57(1):192–200. doi: 10.1002/mrm.21120. [DOI] [PubMed] [Google Scholar]
- 19.Ernst T, Kreis R, Ross BD. Absolute Quantitation of Water and Metabolites in the Human Brain. I. Compartments and Water. J Magn Reson. 1993;102:1–8. [Google Scholar]
- 20.Gasparovic C, Song T, Devier D, et al. Use of tissue water as a concentration reference for proton spectroscopic imaging. Magn Reson Med. 2006;55(6):1219–1226. doi: 10.1002/mrm.20901. [DOI] [PubMed] [Google Scholar]
- 21.Kreis R, Ernst T, Ross BD. Absolute Quantitation of Water and Metabolites in the Human Brain. II. Metabolite Concentrations. J Magn Reson. 1993;102:9–19. [Google Scholar]
- 22.Tisell A, Leinhard OD, Warntjes JB, Lundberg P. Procedure for quantitative (1)H magnetic resonance spectroscopy and tissue characterization of human brain tissue based on the use of quantitative magnetic resonance imaging. Magn Reson Med. 2013;70(4):905–915. doi: 10.1002/mrm.24554. [DOI] [PubMed] [Google Scholar]
- 23.Barker PB, Soher BJ, Blackband SJ, Chatham JC, Mathews VP, Bryan RN. Quantitation of proton NMR spectra of the human brain using tissue water as an internal concentration reference. NMR Biomed. 1993;6(1):89–94. doi: 10.1002/nbm.1940060114. [DOI] [PubMed] [Google Scholar]
- 24.Kreis R, Ernst T, Ross BD. Development of the human brain: in vivo quantification of metabolite and water content with proton magnetic resonance spectroscopy. Magn Reson Med. 1993;30(4):424–437. doi: 10.1002/mrm.1910300405. [DOI] [PubMed] [Google Scholar]
- 25.Deoni SC, Rutt BK, Peters TM. Rapid combined T1 and T2 mapping using gradient recalled acquisition in the steady state. Magn Reson Med. 2003;49(3):515–526. doi: 10.1002/mrm.10407. [DOI] [PubMed] [Google Scholar]
- 26.Lecocq A, Le Fur Y, Amadon A, et al. Fast water concentration mapping to normalize H MR spectroscopic imaging. MAGMA. 2014 doi: 10.1007/s10334-014-0451-6. [DOI] [PubMed] [Google Scholar]
- 27.Le Fur Y, Nicoli F, Guye M, Confort-Gouny S, Cozzone PJ, Kober F. Grid-free interactive and automated data processing for MR chemical shift imaging data. MAGMA. 2010;23(1):23–30. doi: 10.1007/s10334-009-0186-y. [DOI] [PubMed] [Google Scholar]
- 28.Soher BJ, Young K, Govindaraju V, Maudsley AA. Automated spectral analysis III: application to in vivo proton MR spectroscopy and spectroscopic imaging. Magnetic resonance in medicine : official journal of the Society of Magnetic Resonance in Medicine / Society of Magnetic Resonance in Medicine. 1998;40(6):822–831. doi: 10.1002/mrm.1910400607. [DOI] [PubMed] [Google Scholar]
- 29.Gasparovic C, Neeb H, Feis DL, et al. Quantitative spectroscopic imaging with in situ measurements of tissue water T1, T2, and density. Magn Reson Med. 2009;62(3):583–590. doi: 10.1002/mrm.22060. [DOI] [PubMed] [Google Scholar]
- 30.Neeb H, Ermer V, Stocker T, Shah NJ. Fast quantitative mapping of absolute water content with full brain coverage. Neuroimage. 2008;42(3):1094–1109. doi: 10.1016/j.neuroimage.2008.03.060. [DOI] [PubMed] [Google Scholar]
- 31.Lu H, Nagae-Poetscher LM, Golay X, Lin D, Pomper M, van Zijl PC. Routine clinical brain MRI sequences for use at 3.0 Tesla. J Magn Reson Imaging. 2005;22(1):13–22. doi: 10.1002/jmri.20356. [DOI] [PubMed] [Google Scholar]
- 32.Mlynarik V, Gruber S, Moser E. Proton T (1) and T (2) relaxation times of human brain metabolites at 3 Tesla. NMR Biomed. 2001;14(5):325–331. doi: 10.1002/nbm.713. [DOI] [PubMed] [Google Scholar]
- 33.Tsai SY, Posse S, Lin YR, et al. Fast mapping of the T2 relaxation time of cerebral metabolites using proton echo-planar spectroscopic imaging (PEPSI) Magn Reson Med. 2007;57(5):859–865. doi: 10.1002/mrm.21225. [DOI] [PubMed] [Google Scholar]
- 34.Barantin L, Le Pape A, Akoka S. A new method for absolute quantitation of MRS metabolites. Magn Reson Med. 1997;38(2):179–182. doi: 10.1002/mrm.1910380203. [DOI] [PubMed] [Google Scholar]
- 35.Christiansen P, Henriksen O, Stubgaard M, Gideon P, Larsson HB. In vivo quantification of brain metabolites by 1H-MRS using water as an internal standard. Magn Reson Imaging. 1993;11(1):107–118. doi: 10.1016/0730-725x(93)90418-d. [DOI] [PubMed] [Google Scholar]
- 36.Brief EE, Moll R, Li DK, Mackay AL. Absolute metabolite concentrations calibrated using the total water signal in brain (1)H MRS. NMR Biomed. 2009;22(3):349–354. doi: 10.1002/nbm.1349. [DOI] [PubMed] [Google Scholar]
- 36.Tal A, Kirov II, Grossman RI, Gonen O. The role of gray and white matter segmentation in quantitative proton MR spectroscopic imaging. NMR Biomed. 2012;25(12):1392–1400. doi: 10.1002/nbm.2812. [DOI] [PMC free article] [PubMed] [Google Scholar]
- 38.Charles HC, Lazeyras F, Krishnan KR, et al. Proton spectroscopy of human brain: effects of age and sex. Prog Neuropsychopharmacol Biol Psychiatry. 1994;18(6):995–1004. doi: 10.1016/0278-5846(94)90125-2. [DOI] [PubMed] [Google Scholar]
- 39.Leary SM, Brex PA, MacManus DG, et al. A (1)H magnetic resonance spectroscopy study of aging in parietal white matter: implications for trials in multiple sclerosis. Magn Reson Imaging. 2000;18(4):455–459. doi: 10.1016/s0730-725x(00)00131-4. [DOI] [PubMed] [Google Scholar]
- 40.Maudsley AA, Govind V, Arheart KL. Associations of age, gender and body mass with 1H MR-observed brain metabolites and tissue distributions. NMR Biomed. 2012;25(4):580–593. doi: 10.1002/nbm.1775. [DOI] [PMC free article] [PubMed] [Google Scholar]
Associated Data
This section collects any data citations, data availability statements, or supplementary materials included in this article.


