

Abstract
Compared with the dorsal hippocampus, relatively few studies have characterized neuronal responses in the ventral hippocampus. In particular, it is unclear whether and how cells in the ventral region represent space and/or respond to contextual changes. We recorded from dorsal and ventral CA1 neurons in freely moving mice exposed to manipulations of visuospatial and olfactory contexts. We found that ventral cells respond to alterations of the visuospatial environment such as exposure to novel local cues, cue rotations, and contextual expansion in similar ways to dorsal cells, with the exception of cue rotations. Furthermore, we found that ventral cells responded to odors much more strongly than dorsal cells, particularly to odors of high valence. Similar to earlier studies recording from the ventral hippocampus in CA3, we also found increased scaling of place cell field size along the longitudinal hippocampal axis. Although the increase in place field size observed toward the ventral pole has previously been taken to suggest a decrease in spatial information coded by ventral place cells, we hypothesized that a change in spatial scaling could instead signal a shift in representational coding that preserves the resolution of spatial information. To explore this possibility, we examined population activity using principal component analysis (PCA) and neural location reconstruction techniques. Our results suggest that ventral populations encode a distributed representation of space, and that the resolution of spatial information at the population level is comparable to that of dorsal populations of similar size. Finally, through the use of neural network modeling, we suggest that the redundancy in spatial representation along the longitudinal hippocampal axis may allow the hippocampus to overcome the conflict between memory interference and generalization inherent in neural network memory. Our results indicate that ventral population activity is well suited for generalization across locations and contexts.
Keywords: ventral hippocampus, interference, generalization, decoding, reconstruction, population coding
Introduction
Recent evidence suggests that the hippocampus may be functionally divided along its longitudinal axis (Bannerman et al., 2004; Fanselow and Dong, 2010). The ventral hippocampus (VH) contains higher concentrations of several neuromodulators and neuropeptides relative to the dorsal hippocampus (DH) (Gall et al., 1981; Amaral and Kurz, 1985; Haring and Davis, 1985; Verney et al., 1985; Köohler et al., 1987; Garcia Ruiz et al., 1993). Furthermore, the DH primarily receives input from visual, somatosensory, and spatial regions (Amaral and Witter, 1989), while the VH is heavily connected with areas that control emotion and anxiety (Saunders et al., 1988; Pitkäanen et al., 2000; Petrovich et al., 2001; Kishi et al., 2006; Cenquizca and Swanson, 2007). These differences suggest that the DH may have privileged access to spatial information, while the VH may be involved in processing emotional information (Bannerman et al., 2004; Fanselow and Dong, 2010). However, intra-hippocampus associational and collateral networks and intra-entorhinal connections may allow spatial information to reach all regions along this axis (Amaral and Witter, 1989; Dolorfo and Amaral, 1998; Steffenach et al., 2002; Kjelstrup et al., 2008).
At present, few studies have compared neuronal activity in the DH and VH at the electrophysiological level. Although neuronal activity in the DH primarily represents space, the specific responses of ventral cells to spatial changes have not been fully characterized. Specifically, traditional manipulations of the spatial context such as cue rotations, contextual expansions, and exposures to similar contexts with different cues have not been tested (Muller and Kubie, 1987; Muller et al., 1987; Bostock et al., 1991). Additionally, while some studies have assessed the effects of unrewarded olfactory cues on dorsal place cells (Save et al., 2000; Anderson and Jeffery, 2003; Aikath et al., 2014), no electrophysiological studies have examined the effects of olfactory cues of distinct emotional valence in the VH (but see Komorowski et al., 2013, for the effects of learned olfactory associations). This characterization is particularly important in ventral CA1 because this region receives the heaviest olfactory afferents (Majak and Pitkäanen, 2003; Kerr et al., 2007) and olfactory cues provide critical spatial cues for rodents.
The few studies that have characterized neuronal activity along the longitudinal axis have revealed a gradient in the scale of spatial representation paralleling the structural differences along this axis. Specifically, the place field size of individual neurons increases from the dorsal to the ventral pole (Jung et al., 1994; Maurer et al., 2005; Kjelstrup et al., 2008; Royer et al., 2010). This gradient has been taken to suggest that the precision with which space is represented declines when progressing toward the ventral pole, perhaps to allow for representation of additional nonspatial information (Royer et al., 2010). Although there may be computational advantages to representing space on multiple scales even at the cost of precision (Maurer et al., 2005), the existence of a scaling gradient in place fields does not necessarily imply a loss of high-resolution spatial information. An alternative possibility is that this spatial gradient instead signals a transition from sparse coding in the DH to distributed population coding in the VH. At the population level, prior studies have demonstrated that population activity in the DH becomes decorrelated over small distances, corresponding to a fine spatial scale, whereas in the VH population activity remains correlated over much larger distances, corresponding to a broad spatial scale (Maurer et al., 2005; Kjelstrup et al., 2008; Royer et al., 2010; Komorowski et al., 2013). However, even if activity in the VH is correlated over large distances, small changes in the population activity may contain spatial information that serves to decode precise spatial location.
In this study, we recorded and analyzed single-unit activity from area CA1 in either the DH or VH while mice explored several visuospatial and olfactory environments to compare the spatial characteristics of cells in these regions. We then analyzed population activity using several computational techniques, including principal component analysis (PCA) and neural location reconstruction methods, to assess whether spatial representations coded by dorsal and ventral populations are comparably accurate. Our results confirm that ventral cells indeed display some spatial tuning. Importantly, even though the spatial information of independent single ventral cells does not match the precision of dorsal cells, the population activity of ventral cells provides a faithful representation of space, comparable to dorsal populations of equal size. To examine the function of the apparent longitudinal redundancy in spatial coding, we modeled the activity of the DH and VH neuronal populations. We found that representational differences along the longitudinal axis may circumvent the competition between interference and generalization inherent in neural network memory. Specifically, in the DH the details of memories are robustly guarded against interference but fail to generalize, while in the VH the details are lost but commonalities among memories are successfully generalized. Together, these data indicate that there is precise spatial information in the VH and that the spatial gradient observed along the longitudinal axis may provide an important mnemonic advantage.
Materials and Methods
Subjects
Male C57BL/6 mice, 2 to 5 months old (Jackson Laboratory, Bar Harbor, ME), were housed individually and kept on a 12-hr light/dark cycle for at least 2 weeks before the beginning of the experiments. Mice had access to food and water ad libitum. Animal living conditions were consistent with the standards set forth by the Association for Assessment and Accreditation of Laboratory Animal Care (AAALAC). All experiments were approved by the Institution of Animal Care and Use Committee of the University of Pennsylvania, and were conducted in accordance with NIH guidelines.
Surgery
Mice were anesthetized with a mixture of ketamine (100 mg/kg) and xylazine (10 mg/kg), administered intraperitoneally (0.1 mL/kg) and placed in a stereotaxic frame in a flat skull position (David Kopf Instruments, Tujunga, CA). Two independent groups of C57Bl6 mice were implanted in area CA1 in either the dorsal or ventral hippocampus (from Bregma in mm: dorsal: AP = −1.8; ML = −1.5; DV = −1.0; ventral: AP = −3.0, ML = −3.9; DV = −2.8) with movable tetrodes (Fig. 1A,B). Coordinates were selected according to the neuroanatomical markers recently characterized in C57Bl6 mice along the longitudinal axis (Fanselow and Dong, 2010).
Figure 1.
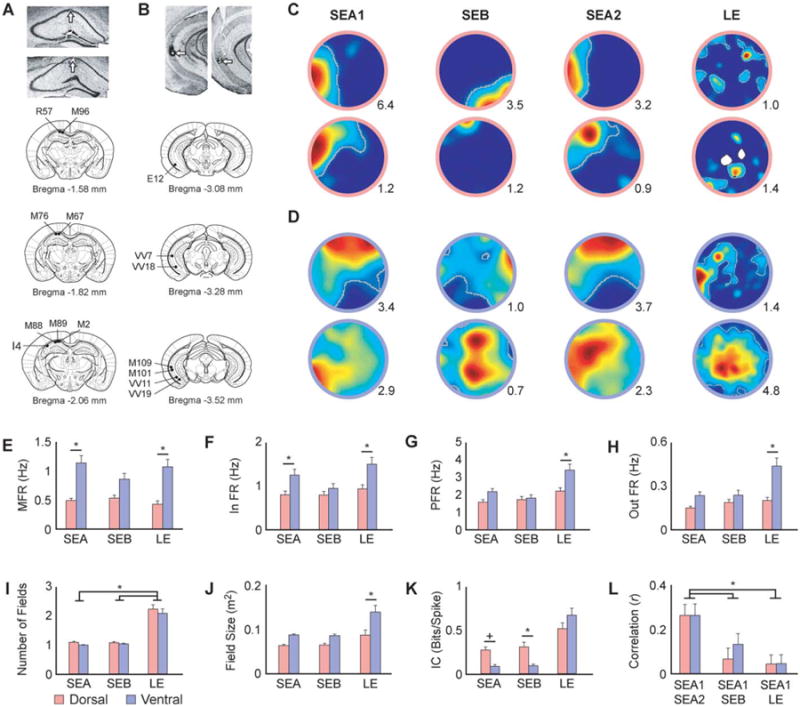
Histology and single cell visuospatial responses. A, B) Representative photomicrographs of rostrocaudal DH and VH coronal sections after Nissl staining (top panels) and coronal schematic representations showing the location of the electrodes in all animals. Tetrodes were moved in unison and lesions indicate location of the bundle. Dorsal: visuospatial: N = 6; olfactory: N = 5; three animals were run in both conditions. Ventral: visuospatial: N = 5; olfactory: N = 4; two animals were run in both conditions. C, D) Example place cell rate maps depicting the activity of dorsal (C) and ventral (D) cells during visuospatial trials. Cells in both regions remapped in the SEB and LE, but remained stable during exposures to the same environment (SEA). The peak firing rate is shown in the lower right corner of each map. Place fields are outlined in grey. E, F) Ventral cells exhibited higher mean (E) and in field (F) firing rates than dorsal cells across all visuospatial conditions (Table 1; A and B). G, H) Ventral cells did not significantly differ from dorsal cells in peak (G) or out of field (H) firing rates, except in the mildly anxiogenic LE (Table 1; C and D). I) The number of fields did not differ between regions, but more cells in both regions displayed multiple fields in the LE (Table 1; E). J) Consistent with prior work, ventral cells displayed larger fields than dorsal cells, an effect that was significant in the LE (Table 1; F). K) Ventral cells displayed lower information content than dorsal cells in the small environments, but there were no differences between the groups in the LE (Table 1; G). L) Pixel-by-pixel cross-correlations of place field maps quantifying stability across conditions. Dorsal and ventral cells showed comparable remapping across sessions. In both regions more remapping was observed when the visuospatial cues were replaced (SEB) and when the environment was expanded (LE) than when the animals were tested in the same original environment (SEA1/SEA2; Table 1; H). SEA: standard environment A, SEB: standard environment B; LE: large environment. MFR: mean firing rate, In FR: in field firing rate, PFR: peak firing rate, out FR: out of field firing rate, IC: information content. Error bars indicate +1 standard error. *Indicates significant SNK post hoc comparison at α = 0.05. +Indicates a trend toward significance (P between 0.05 and 0.09).
Free Exploration Tasks
Visuospatial trials
We recorded neuronal activity from area CA1 in either the DH or VH in two groups of mice that explored cylindrical environments containing visuospatial cues. Neuronal activity was recorded in the following configurations: (a) A 35 cm cylinder (standard environment, SEA) containing a distinct configuration of seven black visual cues on the cylinder's white walls (animals were tested in the SEA at the beginning and at the end of the session); this trial tested general characteristics of DH and VH fields. (b) The SEA rotated 90° counterclockwise; this trial examined if the dorsal and ventral fields were locked to the external cues. (c) A second environment of identical size and color but with different visual cues (SEB); this trial tested if the fields remapped in the presence of different visuospatial cues. (d) A scaled-up large environment identical in shape, color, and cue configuration to the SEA (LE, 70 cm in diameter); this trial tested if the dorsal and ventral fields displayed expansions in size. A comparison of the first and final trials in the SEA served as a measure of short-term place field stability. Free exploration in each trial lasted 10 minutes, with the exception of the LE trial that lasted 20 min to ensure proper sampling. In the visuospatial conditions, we recorded from the DH of six animals (89 cells) and the VH of five animals (65 cells).
Olfactory trials
Before conducting the olfactory trials, odor preference was determined in a separate group of animals. Two neutral (vanilla or cocoa) and two aversive odors (10% acetic acid or 20% 2-methyl butyric acid, a synthetic odor similar to that of spoiled food) were used to assess the effects of valence independent of he intrinsic characteristics of each odor. As previously described (Wang et al., 2013), odor preference was determined by examining approach-avoidance responses to singly presented odorants relative to water (no odor) in different groups of mice.
Neuronal activity was recorded in a 35 cm white cylinder with no visual cues in which the different odors were presented. In each trial, a paper towel (2 × 2 cm) was placed in the center of the platform wetted with water (no odor), the neutral, or the aversive odorant. Olfactory trials consisted of two sessions of three trials each, with an intersession interval of 1 hr. Odors were presented in a semi-random order across animals; however, the no odor condition was always presented first. Pixel by pixel cross-correlations between the first and second session served to examine short-term stability of olfactory representations. Correlations between the no odor and odor conditions served to test if the cells remapped between odor conditions. All trials lasted 10 min with a 10-min inter-trial interval (ITI). During the ITI, the room was ventilated and contexts were cleaned with 70% ethanol to remove all traces of the odors. In the olfactory conditions, we recorded from the DH of five animals (89 cells) and the VH of four animals (42 cells). Three dorsal and two ventral animals were run in the visuospatial and olfactory conditions, though in these animals different cells were recorded in each condition.
Electrophysiology
The headstage was connected to a tethered unity gain amplifier equipped with green and orange LEDs used for tracking the position of the animal. The tether cable was connected to a distribution panel and units were amplified using a 32-channel amplifier (Neuralynx, Bozeman, MT). Electrical signals were amplified between 2,500 and 10,000 times, and filtered between 400 and 9,000 Hz. The amplifier output was digitized at 30.3 kHz. Both the position of the animal and the electrophysiological data were recorded by Cheetah Data Acquisition software (Neuralynx, Bozeman, MT) on an HP xw4400 workstation computer. Beginning at least one week after surgery, neural activity from each tetrode was screened daily. The search for cells was conducted in the animal's home cage. The electrode bundle was advanced by 15 to 20 mm per day. The tetrodes were lowered in small steps to increase the stability of the recordings (Kentros et al., 2004; Muzzio et al., 2009). Pyramidal cells were identified by their characteristic firing patterns characterized by the presence of bursts of two to seven spikes of decreasing amplitude that fire with short interspike intervals (Ranck, 1973). Once pyramidal cells were identified, individual cells were isolated to assess recording stability. The following criteria was used to assess recording stability: (1) the cells must have the same cluster boundaries in sessions spaced at least 12 hr apart and (2) the waveforms obtained on all four wires of the tetrode must be qualitatively identical in all recorded sessions. Experiments were begun when these conditions were met.
Single Cell Analysis
All data were imported into and analyzed in MATLAB (Release 2010a, The MathWorks, Inc., Natick, MA). Units were cluster cut using MClust software (David Redish, University of Minnesota). Cells were only accepted for further analysis if they formed isolated Gaussian clusters and exhibited minimal overlap with surrounding cells and noise. Only cells with mean firing rates exceeding 0.12 Hz (50 spikes in 10 min) during a trial were included in the analyses. In the dorsal region, principal cells and interneurons have been well characterized based on previously established criteria for firing rates and shape of spike autocorrelograms (Csicsvari et al., 1998). Using these criteria, we identified four interneurons in the DH that were not included in the analysis (mean overall firing rate: 3.7 Hz). Since bursting activity decreases along the dorsoventral axis in CA3 (Royer et al., 2010) and CA1 (bursting computed as the percent of spikes occurring with an interspike interval less than or equal to 10msec; SEA: DH: 6.3 ± 0.8%, VH: 3.2 ± 0.5%, t(152) = 2.94, P < 0.01, data not shown), the shape of the aurocorrelogram is not a useful measure to discriminate pyramidal cells from interneurons. Therefore, we used the criteria developed by Royer et al., 2010, which included cells with mean firing rates of 10 Hz, displaying fields with 5 Hz per pixel that covered 80% of the arena. We minimized the encounter of interneurons by lowering the electrodes straight down to directly reach the stratum pyramidale. Three cells fitting the interneuron description were observed in the recorded ventral populations and were not included in the overall analysis.
Place field maps were generated by first dividing the arena into a 70 × 70 pixel grid and computing an activity map, e.g., the total number of spikes in each pixel, and a sampling map, e.g., the total amount of time spent in each pixel. Both maps were then smoothed with a 3 cm standard deviation Gaussian kernel (Royer et al., 2010). The activity map was then divided by the sampling map, which yielded the place field map. Any location sampled for less than 1 s was considered unsampled. Only periods of movement with velocity exceeding 3 cm/s were included in the analyses.
Place fields were defined as any set of contiguous pixels totaling at least 80 cm2 in which the average firing rate was at least 20% of the peak firing rate (Rowland et al., 2011). In the event that a cell yielded multiple place fields, the sum of all fields was taken as the place field size. Firing rate patterns were further characterized by computing the mean overall, mean in field (average within all fields), mean out of field (average outside of all fields), and peak (maximum) firing rates. All recordings were conducted under unrewarded conditions and the reported firing rates in the dorsal region are similar to those described in mice under similar conditions (Kentros et al., 2004). The information content, a parameter that estimates how well the firing pattern of a given cell predicts the location of the animal, was computed as previously described (Skaggs et al., 1993) using the following formula IC = Σpi(Ri/R)log(Ri/R), where pi is the probability of occupying location i, Ri is the firing rate at location i, and R is the overall mean firing rate.
In addition to these parameters, place field stability and remapping was assessed by performing pixel-by-pixel Pearson R cross-correlations between maps (using a 70 × 70 pixel grid for the large environment for comparisons with standard environments). Low Pearson R correlation scores indicated remapping and higher correlations scores indicated similarity between the fields. Field angular rotations were computed as the angle of rotation that maximized the pixel-by-pixel Pearson R cross-correlation between the first SEA trial and the SEA rotation trial place field maps, computed in 5° increments. Because it has been shown that approximately one-third of place fields spontaneously remap during multiple exposures to the same environment in mice (Kentros et al., 2004), we restricted our rotation analysis to only cells that remained stable (r > 0.3) across both standard environment A (SEA) exposures (Aikath et al., 2014).
Population Principal Component Analysis
To ensure an adequate estimation of the population covariance, the population activity vector for each trial was created by binning the population activity in 1 s intervals. The activity of each cell was then z-scored, and Principle Component Analysis was performed on this normalized population vector. To calculate spatial variance of principal components, a component place field map was computed for each dimension using the same procedure as described above (See Single Cell Analysis). The standard deviation of this vectorized component place field map was then computed as the index of spatial variance.
To determine if the spatial variance of a component was significantly above chance, a random distribution was generated for each component. To this end, the location of each animal during each session was randomly shuffled, preserving the sampling statistics of the animal, and a new shuffled component place field map was generated. The random spatial variance was computed from this map. This procedure was repeated 100 times yielding the appropriate random distribution. A component was considered a spatial component if its spatial variance exceeded the 95th percentile value of its random distribution.
Location Reconstruction
To reconstruct the location of the animal on the basis of neural activity, a standard two-step Bayesian algorithm with a continuity constraint was used (Zhang et al., 1998). First, place field maps were generated as described above (See Single Cell Analysis), using the first 75% of the session. Trajectories during periods of movement in the last 25% of the session were then reconstructed, using the following equation:
where P is the sampling probability map, Mi is the place field map of cell i, τ is the time interval, n is the population activity vector at time t, G is a two-dimensional Gaussian continuity constraint centered on the location reconstructed at time t – 1 with a standard deviation equal to the velocity in pixels/s at time t, and all multiplication is element-wise. A time interval of 1 s was used, as this has been found to yield near optimal reconstructions from the DH (Zhang et al., 1998). The inclusion of a continuity constraint improved performance of both DH and VH populations, as has been previously reported (Zhang et al., 1998; Agarwal et al., 2014), but did not qualitatively change the results. Only sessions with at least 30 s of movement in the last 25% of the session, and at least three cells meeting criteria were included in this analysis.
Chance performance for each reconstruction was calculated by first randomly shuffling the population activity vector relative to the position vector during the first 75% of the session to create shuffled place field maps. Activity during the latter 25% of the session was unaltered. Chance performance was then the average of 25 randomly shuffled reconstructions. This control accounts for both differences in sampling, as well as the possibility of prediction due to spurious correlation.
Modeling
An AB/AC paradigm, in which two lists of paired associates sharing common elements (the A items) were sequentially learned, was used to model DH and VH learning. Each list consisted of eight paired associates, and was learned at a unique location to be remembered in conjunction with the list of associates. The AB list was learned first, followed by the AC list. The models of DH and VH mnemonic performance were identical, except for the tuning of their spatial representations. Each population was modeled as a fully connected autoassociator in which an encoding layer of 75 units attempted to encode and reproduce the activity of 11 spatial units and 24 nonspatial units. The reported results were robust across more sparsely connected network configurations. All transfer functions were log-sigmoid.
Each associate pair consisted of two active nonspatial units (set to 1), e.g. item A1 and item B1 with all other nonspatial inputs inactive (set to 0). Spatial representation consisted of either a single active unit (DH) or a normally distributed pattern of activity with a standard deviation of 2 units. All items on a list had the same spatial location. To insure equal contributions of the spatial representation to the error across both populations, the spatial representation was normalized to sum to one at all times.
The network was tested on each list by providing the spatial representation for that list, as well as the A item, and measuring the activity of the correct associate (either the B or C item). If the activity of the correct associate unit exceeded 0.5, the item was considered correctly recalled (McCloskey and Cohen, 1989). Generalization was tested by providing the network with the spatial representation of a location nearby the original AB list location (centered 1 unit away from the AB location), as well as the A item, and testing for correct recall of item B.
The network was first exclusively trained on the AB list for 10,000 epochs, which was sufficient to yield a 95% level of performance in both populations. At this point, generalization was tested using the spatial representation of a nearby location. Then, the network was trained on the AC list for 50 epochs, with performance on both lists tested every five epochs. Interference was measured as the difference between AB list performance before AC list learning and AB list performance after the 50 epochs of AC list learning. The network was trained to minimize the cross-entropy error function via gradient descent with a learning rate of 0.5. No bias weights were used to encourage the network to encode all aspects of the list within network weights. Similar results are obtained if small negative bias weights are permitted. All model simulations were conducted in LENS (http://tedlab.mit.edu/∼dr/Lens/).
Histology
Electrode placement was verified after the completion of the experiments by passing a current (0.1 mA for 5 s) through the tetrodes that yielded unit data (52500 Lesion Making Device, Ugo Basile, Comerio VA, Italy). Then, animals were perfused with 10% formalin solution (Fisher Scientific, Hampton, NH). The brains were removed and fixed at 4°C for at least 24 hrs in 10% formalin containing 3% potassium ferrocyanide (J.T Baker, Deventer, Netherlands) for Prussian blue staining. The brains were then transferred to a 30% sucrose solution and kept for at least 24 hrs at 4°C for cryoprotection. The tissue was cryosectioned (30μm thick, coronal) and Nissl stained using standard histological procedures (Powers and Clark, 1955). Fig. 1A,B shows examples of Nissl stained micrographs and schematics of the location of the electrodes in all the animals included in the study.
Statistical Analyses
For all single cell analyses, two-way ANOVAS with repeated measures were used to determine the significance of all parameters. Student Newman Keuls (SNK) post hoc tests were used to determine which groups displayed significant differences. In all single cell figures, markers denote significant SNK post hoc contrasts. Watson-Williams circular statistics were used to compare angular rotations between dorsal and ventral populations. ANCOVAS, t-test, and Pearson r correlations were used for population analyses. ANOVAs were run to verify the significance of modeling results. In all figures and tables, error bars represent +1 standard error of the mean. F values, degrees of freedom, and probability levels of all statistical tests reported in the main text can be found in the main text or the accompanying table where indicated.
Results
Visuospatial Single Cell Responses
Across all visuospatial trials, ventral cells fired much more diffusely than dorsal cells, similar to what has been previously shown (Kjelstrup et al., 2008; Royer et al., 2010; Figs. 1C,D). In agreement with a previous report from area CA3 (Kjelstrup et al., 2008), we found that ventral cells exhibited higher firing rates than dorsal cells including mean and in-field rates (P < 0.03, Figs. 1E,F, Table 1; A and B). There were no differences in peak and out of field firing rates except in the mildly anxiogenic LE where ventral cells displayed higher rates than dorsal cells (P < 0.001, Figs. 1G,H, Table 1; C and D). Furthermore, ventral cells exhibited lower spatial information content, a parameter that estimates how well the firing pattern of that cell predicts the location of the animal, than dorsal cells. However, this effect was not observed in the LE, where cells in both groups exhibited high information content (P < 0.008, Fig. 1K, Table 1; G). There were no differences in the number of fields between the groups (P > 0.05; Fig. 1I, Table 1; E).
Table 1. Single Cell Statistical Analyses.
| Visuospatial conditions | Olfactory conditions | ||||
|---|---|---|---|---|---|
|
|
|
||||
| Variable | Statistic | P-Value | Statistic | P-Value | |
| A. Mean Firing Rate | Region | F(1,198)=22.5 | <0.001 | F(1,164)=26.8 | <0.001 |
| Condition | F(2,205)=3.7 | <0.03 | F (2,196)=2.8 | <0.07 | |
| Interaction | F(2,205)=4.6 | <0.02 | F(2,196)=0.42 | <0.03 | |
| B. In Field Firing Rate | Region | F(1,198)=5.7 | <0.02 | F(1,164)=7.8 | <0.006 |
| Condition | F(2,205)=11.0 | <0.001 | F(2,196)=3.3 | <0.05 | |
| Interaction | F(2,205)=2.5 | <0.09, n.s. | F(2,196)=2.04 | n.s. | |
| C. Peak Firing Rate | Region | F(1,197)=3.4 | <0.07, n.s. | F(1,164)=6.2 | <0.02 |
| Condition | F(2,203)=25.2 | <0.001 | F(2,196)=6.3 | <0.02 | |
| Interaction | F(2,203)=4.0 | <0.02 | F(2,196)=6.6 | <0.003 | |
| D. Out of Field Firing Rate | Region | F(1,193)=0.1 | n.s. | F(1,159)=18.0 | <0.001 |
| Condition | F(2,205)=11.1 | <0.001 | F(2,196)=0.3 | n.s. | |
| Interaction | F(2,205)=4.7 | <0.02 | F(2,196)=0.3 | n.s. | |
| E. Number of Fields | Region | F(1,198)=0.1 | n.s. | F(1,164)=4.2 | <0.05 |
| Condition | F(2,205)=62.4 | <0.001 | F(2,196)=1.8 | n.s. | |
| Interaction | F(2,205)=1.1 | n.s. | F(2,196)=4.1 | <0.02 | |
| F. Field Size | Region | F(1,197)=5.9 | <0.02 | F(1,164)=12.3 | <0.006 |
| Condition | F(2,203)=21.2 | <0.001 | F(2,196)=2.7 | <0.07 | |
| Interaction | F(2,203)=4.4 | <0.02 | F(2,196)=10.0 | <0.001 | |
| G. Information Content | Region | F(1,198)=3.1 | <0.08, n.s. | F(1,164)=9.7 | <0.003 |
| Condition | F(2,205)=34.6 | <0.001 | F(2,196)=0.2 | n.s. | |
| Interaction | F(2,205)=7.6 | <0.02 | F(2,196)=3.4 | <0.04 | |
| H. Stability Between Conditions | Region | F(1,138)=0.4 | n.s. | F(1,123)=9.0 | <0.004 |
| Condition | F(2,139)=11.0 | <0.001 | F(1,153)=2.4 | n.s. | |
| Interaction | F(2,139)=0.7 | n.s. | F(1,153)=0.02 | n.s. | |
| I. Stability Within Odor Conditions | Region | F(1,85)=1.9 | <0.001 | ||
| Condition | F(2,96)=0.8 | n.s. | |||
| Interaction | F(2,96)=0.2 | n.s. | |||
To examine whether ventral cells would be influenced by changes in external cues, we tested the cellular responses to several manipulations of the spatial layout. DH place cells in rats and mice have been shown to follow rotations of contextual cues (Muller and Kubie, 1987; Cho et al., 1998; Kentros et al., 1998). This has also been observed in a subset of medioventral cells in rats (Poucet et al., 1994). To determine if this was also the case for cells in the most ventral regions in mice, we rotated the SEA cylinder with its visuospatial cues 90° clockwise. Place field rotations following the cues were observed in both the DH and VH. However, while DH cells appeared tightly coupled to the rotated visual cues, ventral cells tended to rotate only partially, displaying significantly smaller angular rotations than DH cells (P < 0.05, Fig. 2, see Materials and Method).
Figure 2.
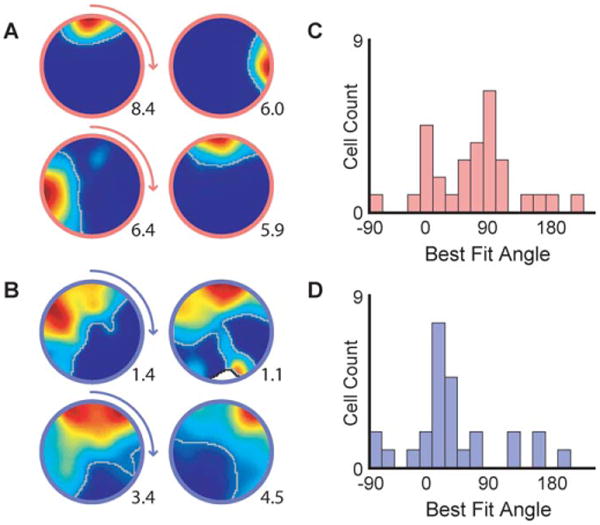
Cue rotations. A, B) Example place field maps for dorsal (A) and ventral (B) cells when the local visual cues are rotated. C, D) Histograms of best-fit rotation angles for C) dorsal and D) ventral cells. The majority of dorsal cells displayed rotations of the fields that were tightly coupled to the cue rotations. However, ventral rotations systematically fell between the original and the rotated position of the cues (Watson-Williams circular test: F(1,56) = 5.12, P = 0.03). The peak firing rate is shown in the lower right corner of each map. Place fields are outlined in grey.
Next, we examined the effects of changing proximal cues on dorsal and ventral cells by calculating the degree of remapping between SEA and SEB. We performed pixel by pixel cross-correlations between SEA and SEB and compared those correlations with those obtained between the two sessions in the SEA. The results indicated that cells in both the DH and VH displayed significantly more remapping in SEB than in the original environment SE (P < 0.001, Fig. 1L, Table 1; H). Finally, we examined the effects of contextual expansion by placing animals in the LE. Previously, it has been observed that 36% of dorsal cells in rats fire in a similar relative location with a slight expansion of place fields in response to contextual scaling (Muller and Kubie, 1987), but this effect has not been tested in the mouse or the VH. Place field size exhibited by VH cells increased significantly in the LE compared to the SE (P < 0.001), while those of dorsal cells on average did not significantly expand (Fig. 1J, Table 1; F). The expansion observed in ventral cells could be a reflection of the normally large and diffuse characteristic of ventral place cells, a property that may be constrained in the SE. Interestingly, both in the DH and VH, we typically observed remapping in the LE rather than expansion of the place fields, suggesting that the LE was perceived as a novel context rather than an expanded version of the same environment. In summary, single cells in the VH display some sensitivity to alterations in the visuospatial context; however, these responses in general lack the precision observed in dorsal cells.
Olfactory Single Cell Responses
We first determine odor preference by examining approach/avoidance behaviors. We found that mice significantly avoided both 10% acetic acid and 20% 2-MB (two-tailed t-test: t(1,23) = 2.80, P = 0.010; t(1,27) = 3.48, P = 0.002, respectively), but not cocoa or vanilla (t(1,23) = 0.78, P = 0.539; t(1,29) = 0.88, P = 0.386, respectively; data not shown). Since no significant differences were observed between either the two neutral or the two aversive odors, the data for each valence condition were pooled.
In the olfactory trials ventral cells displayed more diffuse fields than dorsal cells (Figs. 3A,B). Additionally, aversive odors elicited strong responses in the VH. This was manifested by significant increases in firing rate in ventral cells in comparison to relatively stable firing rates in dorsal cells. These effects were observed in overall, in-field, out-of-field, and peak firing rates (P < 0.02, Figs. 3C–F, Table 1; A–D). The ventral increase in firing rate in the aversive odor condition was not related to field expansions because the ventral field size decreased in the presence of the aversive odor (Fig. 3H, Table 1; F), although the number of fields increased (Fig. 3G, Table 1; E).
Figure 3.
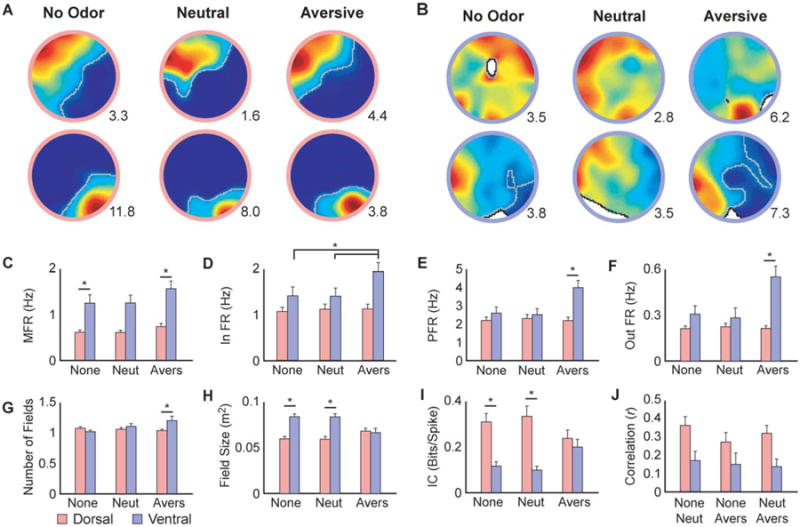
Single cell olfactory responses. A, B) Example place cell rate maps depicting the activity of A) DH and B) VH cells during olfactory trials. The peak firing rate is shown in the lower right corner of each map. Place fields are outlined in grey. C–F) Ventral cells exhibited higher mean (C), in field (D), peak (E), and out-of-field (F) firing rate than dorsal cells in the aversive odor condition (Table 1; A–D). G) Ventral cells displayed more place fields than dorsal cells in the aversive odor condition (Table 1; E). H) Place field size of ventral cells was larger than that of dorsal cells in the no odor and neutral odor conditions. However, there were no differences between the groups in the aversive odor condition (Table 1; F). I) Ventral cells displayed lower information content than dorsal cells in the no odor and neutral odor conditions. Since information content decreased in dorsal cells during the aversive odor condition, there were no differences between the groups during this trial (Table 1; G). J) Pixel-by-pixel cross-correlations of place field rate maps. Dorsal place fields remained significantly more stable across odor conditions than ventral place fields (Table 1; H). None: no odor, Neut: neutral odor, Avers: aversive odor. MFR: mean firing rate, In FR: in field firing rate, PFR: peak firing rate, out FR: out of field firing rate, IC: information content. Error bars indicate +1 standard error. *Indicates significant SNK post hoc comparison at α = 0.05.
We tested the stability of the place fields by comparing the first and second olfactory sessions. While dorsal cells exhibited high short-term stability, ventral cells displayed substantial remapping between same odor trials (P < 0.001, Table 1; H, data not shown). Additionally, to determine how the cells responded between odor conditions, we tested the stability between no odor and odor conditions (P < 0.004, Fig. 3J, Table 1; I). Dorsal cells remained stable across all conditions, while ventral cells displayed significant remapping. These results indicate that as long as the odors are presented in the same spatial location, dorsal spatial representations are unaffected by odor type or valence. Conversely, ventral cells are more sensitive to odors and display remapping. These results corroborate previous lesion studies showing that the VH plays an important role in odor discrimination (Kesner, 2013; Weeden et al., 2014). In summary, ventral cells appear to be more sensitive than dorsal cells to valence and olfactory cues as indicated by increases in firing rate and remapping, respectively. Altogether, the single cell analysis revealed that ventral cells do respond to spatial alterations, although the precision of these changes may be lower than that observed in dorsal cells.
Analysis of Population Activity
An important question that arises from the previous analysis is, given that ventral cells do respond to the spatial characteristics of the environment, does their broader tuning in fact reflect a decrease in the precision of spatial representation? Several other brain regions exhibit broadly tuned representations similar to those observed in the VH (Stopfer et al., 1997; Jones et al., 2006; Osborne et al., 2008; van Duuren et al., 2008). In these cases, most notably in the olfactory system, it has been informative to estimate the representation of a particular stimulus as a function of temporally coordinated activity across a population of neurons rather than as the sum of individual representational units (MacLeod and Laurent, 1996; Stopfer et al., 1997, 2003; Laurent et al., 2001). One technique that has proven useful for the analysis of distributed representations is PCA (Hiroi et al., 2013). PCA is a statistical tool for restructuring highly correlated, high dimensional data into a low dimensional representation that makes common correlations more apparent. Principal components are rank-ordered by the amount of variance they capture, so simply examining the leading principal components can reduce the dimensionality of the data while preserving much of the structure. In the context of neural population activity, PCA extracts weighted combinations of firing activity hidden within the distributed population activity and re-represents these combinations in a more accessible, low dimensional space.
In the case of individual dorsal place cells, space is represented by the larger-than-chance variance in activity across different spatial locations, from the maximum firing rate at the peak of the place field to the silence at locations outside the place field. Similarly, if the VH were to represent spatial location with a population code, then the network activity along certain principle components should vary with location more than would be expected by chance. Furthermore, if this spatial information is more distributed in VH populations, then ventral spatial components should weight the activity of multiple cells more highly than DH spatial components.
We tested these predictions by analyzing the spatial variance of the PCA transform of population activity in the DH and VH. Because unequal sampling of the environment and limited time of exploration could yield spatial variance in activity unrelated to spatial coding, a random distribution of spatial variances was created for each component and trial by repeatedly shuffling the position of the animal relative to population activity, and measuring the resulting spatial variances (see Materials and Methods). If the spatial variance of the population activity along any component was larger than the 95th percentile of the shuffled control distribution, that component was considered to be a spatial component.
In both the DH and the VH, the percentage of spatial components in each population exceeded the 5% which would be expected by chance, indicating that location is a critical determinant of population activity in both regions (DH: t(38) = 20.2, P < 0.001; VH: t(48) = 6.4, P < 0.001). A region × population size ANCOVA, with the number of spatial components as the dependent variable, revealed significant effects of region, population size, and an interaction (F(1,84) = 56.3, P < 0.001, F(1,84) = 118.0, P < 0.001, F(1,84) = 13.2, P < 0.001, respectively). This reflects that, while the number of spatial components increases with population size in both regions, the increase occurs more rapidly in the DH than the VH. Follow-up correlations confirmed significant large positive relationships between the number of spatial components and population size in both regions (P < 0.001; Fig. 4A). The difference between regions in rate of increase of spatial dimensions with population size may be the result of additional representational content in the VH that is uncorrelated with space. Alternatively, a distributed population code may diminish our capacity to distinguish informative spatial variance from noise in VH populations with limited sample sizes. Despite these differences, both regions do show evidence of representational content of space. Finally, the average absolute cell weighting of the spatial principal components in the VH exceeded that of the DH (t(64) = 3.8, P < 0.001; Fig. 4B), indicating a more distributed representation of spatial variance in the VH than in the DH.
Figure 4.
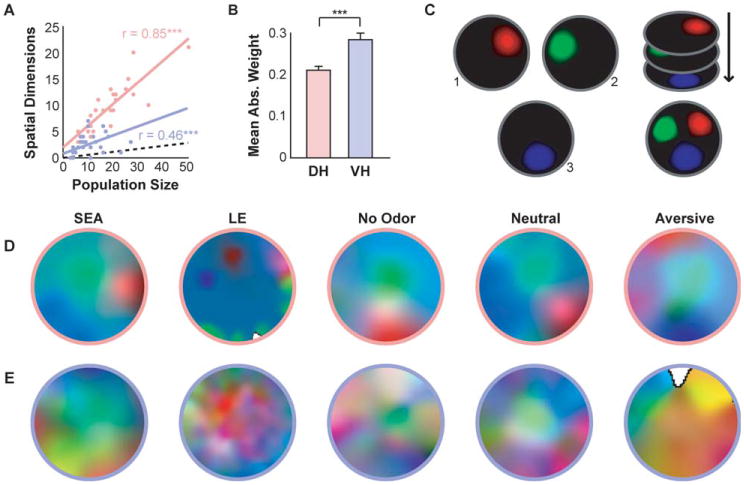
Principle component analysis (PCA) of spatial population activity. A) In both the DH and the VH, the percent of spatial components significantly exceeded chance (black dotted line). The number of spatial components also significantly correlated with population size in both regions, although this correlation was higher in the dorsal than ventral region. B) The mean absolute weight of ventral spatial components exceeds that of dorsal populations, which reflects a more distributed spatial representation. C) Schematic showing construction of composite place field maps for the three leading spatial components. Place field maps were generated for each spatial component, treating the activity along each component as if it were a cell. Spatial component place field maps were then normalized and represented in red, green, and blue, respectively. If position were well represented by distinct network states, we predicted a patchwork pattern with unique colors (network states) at unique locations. D, E) Example composite place field maps. Note that in both D) dorsal and E) ventral populations, particular locations are uniquely represented. However, while unique locations are sparsely represented in the DH (often driven by the activity of a single cell), in the VH unique locations are only apparent when the conjoint activity of many cells, and often many components, is considered.
Since the leading components extracted by PCA capture a larger proportion of the population variance, only a subset of the leading spatial components is necessary to assess the spatial population activity. To visualize the population variance representing space in the DH and VH, the three leading spatial components were selected, and a composite place field map was created for each trial (Fig. 4C). These composite PCA place field maps depict the average normalized and color-coded population activity along the three selected components at each location. If position in space were represented in the activity of the neural population, then distinct colors, corresponding to unique population activity, should be observed at different spatial locations. This was observed in the visuospatial and olfactory conditions in both DH and VH populations (Figs. 4D,E). However, there is a noticeable qualitative difference between the DH and VH in location representation. In the DH, where spatial location is coded by finely tuned activity, the composite PCA place field maps resemble discrete, largely orthogonal representations, with each principal component representing a single precise location (typically the place field of a single cell). Conversely, in the VH composite PCA place field maps reveal a distributed representation of location. In these maps, location is represented with high precision but the activity of the entire population must be considered to disambiguate locations: the activity of a single cell, or even a single principal component, is insufficient.
Location Reconstruction
While the PCA-aided analyses reveal much about the representational differences between the DH and the VH, the most direct way to evaluate total spatial information content at the population level is to reconstruct the spatial location of the animal on the basis of neuronal activity. Though several approaches to location reconstruction have been proposed, the Bayesian approach, developed for the sparse DH cells, has become the standard method because it is typically the most precise (Zhang et al., 1998). Using a two-step Bayesian algorithm with a continuity constraint, we reconstructed trajectories during periods of movement in both the DH and the VH. Reconstruction performance was compared to shuffled controls to ensure that neither sampling differences nor spurious correlations could account for accurate performance. Shuffled controls were generated by randomly shuffling the activity vector for each cell relative to the position vector of the animal during the learning portion of the algorithm, and reconstructing the location of the animal on the basis of this shuffled activity (see Materials and Methods for additional details).
Performance on both olfactory and visuospatial trials was comparable, so all data were collapsed for further analysis. Reconstruction accuracy was computed by calculating the difference between the mean reconstruction error (the distance between the actual and the reconstructed locations) of the neural data and the shuffled control, with positive values indicating more accurate reconstructions. Accuracy in both the DH and the VH was significantly higher than the shuffled control (DH: t(37) = 7.8, P < 0.001; VH: t(19) = 2.6, P < 0.02). A region × population size ANCOVA for accuracy revealed only a main effect of population size (F(1,70) = 9.9, P < 0.003), indicating that larger populations yield more accurate reconstructions (Fig. 5A). Neither the main effect of region nor the interaction between population size and region was significant (F(1,70) = 2.1, P > 0.1, F(1,70) = 0.3, P > 0.1, respectively). These results indicate the presence of precise spatial information in both the DH and VH, with VH activity often attaining remarkable accuracy despite the broad tuning of individual cells. This is further illustrated in example trajectories showing the performance of the decoding algorithm in comparison to the actual path of the animal (Fig. 5B).
Figure 5.
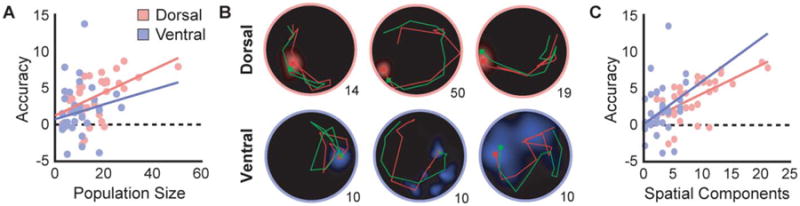
Location reconstructions. Since no differences were observed between visuospatial and olfactory conditions, data were collapsed to determine the relationship between accuracy and both population size and spatial components. A) Reconstruction accuracy was significantly greater than chance (dotted line) and increased with population size in both the DH and VH. B) Examples of 10s trajectories reconstructed from dorsal and ventral neural populations during different trials. Note that even smaller ventral population sizes can represent trajectories with striking accuracy. Population size is indicated in the lower right corner of each trajectory map. Actual trajectory is shown in green, reconstructed trajectory in red. C) Reconstruction accuracy and the number of spatial components show a significant relationship, with no difference between regions.
As an independent measure of spatial information, reconstruction accuracy can be used to validate the procedure used to select PCA spatial components. A region × number spatial components ANCOVA, with reconstruction accuracy as the dependent measure, revealed only a significant main effect of the number of spatial components (F(1,64) = 17.7, P < 0.001; Fig. 5C). Neither an effect of region nor an interaction with region was significant (F(1,64) = 0.4, P > 0.1, F(1,64) = 0.6, P > 0.1, respectively). This result suggests that the spatial components identified by our PCA analysis do indeed capture spatial information.
Modeling the Effect of a Spatial Gradient on Memory
The results of the preceding analyses suggest that there is redundancy in spatial representation along the longitudinal axis raising the question of what function this may serve. It has recently been suggested that differential spatial coding strategies along the longitudinal hippocampal axis may contribute to a gradient that shifts processing from pattern separation in DH populations to pattern completion in VH populations (Poppenk et al., 2013). We extend this hypothesis by suggesting that a redundant spatial gradient could provide a mnemonic advantage. Specifically, sparse dorsal representations should be resilient to interference, while distributed ventral representations should excel at generalizing across locations.
Dorsal cells represent space with sparse, finely tuned activity. Thus, population representations in the DH even at similar locations can be very different from one another. As a consequence of this representational dissimilarity, spatial and non-spatial commonalities in the environment may be represented by very different patterns of activity, minimizing interference but limiting the capacity of the DH to generalize to locations extending beyond the place field size. In the VH, on the other hand, this situation is reversed. Because space is represented in this region by the conjoint activity of many broadly tuned cells, representations of even dissimilar locations may be similar. These distributed representations may allow the VH to extract appropriate commonalities between different situations, and thus better generalize to new or similar events, at the cost of interference.
Thus to assess the impact that a spatial representational gradient may have on episodic memory more generally, we modeled the ability of the DH and VH to store and retrieve nonspatial associations learned at different spatial locations (Fig. 6A). Because we were particularly interested in interference and generalization in these populations, we used a traditional AB/AC paradigm, in which two lists of paired associates, sharing common elements (the A items) and thereby subject to cross-list interference, are learned sequentially (Briggs, 1954; McCloskey and Cohen, 1989). Consistent with previous work, each population was modeled as an autoassociator (O'Reilly and McClelland, 1994; Rolls, 1996), taking both spatial and nonspatial inputs. Each population had to remember the lists of nonspatial paired associates in conjunction with the location where each list was learned. Modeled DH and VH populations only differed in the sparseness of the spatial representation (Fig. 6B).
Figure 6.
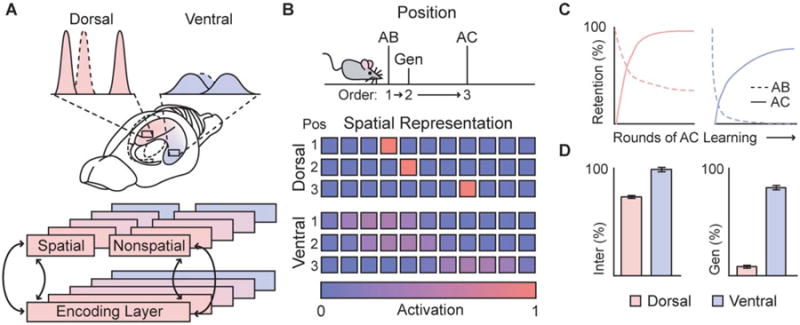
Modeling of the mnemonic impact of a spatial representational gradient. A, B) Diagrams of model details. A) Each hippocampal population was modeled with an identical autoassociator. DH and VH simulations only differed in the sparseness of their spatial representations, with no differences in their nonspatial input. B) An AB/AC paradigm was used to test the influence of sparse and distributed spatial representations on interference and generalization of nonspatial associates. AB and AC lists were learned at different locations, corresponding to different spatial representations. C) Learning and forgetting curves for both lists during the course of AC list learning. AB associations were learned above 95% performance level before AC list learning. D) Magnitude of interference and generalization effects in both populations. nter: interference, Gen: generalization. Histogram bars represent mean plus one standard error of the mean.
Learning and forgetting curves, as well as aggregated interference and generalization performance of each of the populations are shown in Figures 6C,D. As expected, the magnitude of both interference and successful generalization increased from the dorsal to the ventral populations (F(2,147) = 65.8, P < 0.001; F(2,147) = 305.5, P < 0.001, respectively; Fig. 6D). It is also worth noting that in dorsal populations, interference was well below catastrophic levels (where prior information is completely forgotten before new information is learned), with learning and forgetting curves comparable to those previously reported (Briggs, 1954; McCloskey and Cohen, 1989). Finally, since the representation of nonspatial information was identical in both the dorsal and ventral populations, these results highlight the impact that a gradient in spatial representation alone may have on memory. In sum, these results demonstrate that a redundant spatial gradient along the longitudinal axis can offset the competition between interference and generalization inherent in network memory, biasing ventral populations toward learning generalizations across locations.
Discussion
Differences in connectivity along the dorso-ventral axis have suggested that the dorsal and ventral regions may function separately and process different types of information, with the DH specializing in spatial processing and the VH in emotional information (Bannerman et al., 2004; Kesner, 2013). This functional dichotomy has recently been challenged by studies suggesting that the DH represents space (e.g. location on a map), while the VH codes for context (e.g. which map to use; Komorowski et al., 2013; Nadel et al., 2013). However, under both perspectives, the general consensus in the field is that spatial information in the VH lacks precision (Royer et al., 2010; Komorowski et al., 2013). In this study we demonstrate that despite spatial information projecting primarily to the DH, the VH also precisely represents space. Our single-cell analyses indicate that individual ventral cells are sensitive to changes in the spatial characteristics of an environment. Additionally, despite the broadly tuned nature of individual cells, we demonstrate that it is possible to extract high-resolution spatial information from population activity in the VH. Thus, our data suggest that the gradient in spatial scaling along the longitudinal hippocampal axis signals a shift from sparse to distributed coding rather than a loss of high-resolution spatial information. To partially account for this redundancy, we propose a neural network model indicating that redundant spatial coding may provide a mechanism by which the hippocampus can simultaneously protect the specifics of memories from interference in the DH while learning and supporting generalization in the VH. These data suggest that accurate representation of space on multiple scales may provide a mnemonic advantage.
Spatial Versus Emotional Processing
In agreement with previous reports (Royer et al., 2010), we also found that cells in the VH are more sensitive to emotional valence than those in the DH. This is evident in the aversive odor conditions and the mildly anxiogenic LE, where ventral cells displayed increases in firing rate but dorsal cells did not. It is possible that in addition to providing a population code of space, ventral cells also respond to emotional valence through changes in firing rate. In the DH, analysis of individual trajectories through a firing field have revealed significant variability in firing rate (Fenton and Muller, 1998; Fenton et al., 2010). This has been taken to suggest that while the location in which a particular cell fires serves to represent space, firing rate variability above the threshold needed to form a spatial representation may convey non-spatial information (for review, see O'Keefe and Burgess, 2005). Indeed, increases in firing rate in the DH have been shown to code for several task contingencies, behavioral variables, and objects (O'Keefe, 1976; Wiener et al., 1989; Markus et al., 1994; Deadwyler et al., 1996; Sakurai, 1996; Wood et al., 1999; Kennedy and Shapiro, 2009; Muzzio et al., 2009). Thus, similar alterations in firing rate in the VH may code for emotional valence. Interestingly, even though the mildly anxiogenic cues used in this study did not produce changes in firing rate in the DH, previous studies have shown that very strong emotional cues do lead to increases in firing rate in the DH (Moita et al., 2003; Wang et al., 2012). Therefore, it is possible that responsiveness to emotional cues is not exclusive to the VH, and that there exists an emotional processing gradient along the hippocampal axis. In the future, it would be important to determine whether emotional information can also be extracted from population activity in both hippocampal regions.
While the previous data indicate that the VH is indeed responsive to emotional cues, the idea of an exclusive spatial-emotional functional dichotomy along the longitudinal axis is at odds with recent work demonstrating contextual representations in the VH (Komorowski et al., 2013; Nadel et al., 2013). Additionally, this segregation creates a conundrum for circuits underlying forms of learning that require precise spatial information, such as spatial working memory, contextual fear conditioning, and extinction. The VH is the only hippocampal area that directly projects to the medial prefrontal cortex and sends robust projections to the amygdala (Pitkäanen et al., 2000; Hoover and Vertes, 2007), two brain regions that are critical for several forms of contextual learning (for review see Marek et al., 2013; Maroun, 2013). As a consequence, the VH region must directly or indirectly convey spatial information. Since there are substantial connections between the DH and VH (Amaral and Witter, 1989), it is likely that the VH controls the transfer of information between the DH and the prefrontal cortex. In support of this idea, a recent study found that inhibition of the VH reduces the synchronization between the prefrontal cortex and the DH, important for spatial working memory tasks (O'Neill et al., 2013). Our results indicate that the VH is not just passively transferring spatial information but rather further processing this information at the population level, which places the VH in a key position to modulate contextual learning.
Contextual Versus Precise Spatial Processing
The idea that the VH is important for encoding contextual information has been previously suggested by fMRI and electrophysiological studies (Komorowski et al., 2013; Nadel et al., 2013; Poppenk et al., 2013). These studies indicated that while the DH is critical for spatial relationships, the VH is necessary for the identification of places (Nadel et al., 2013). Our single-cell data support this idea by showing that cells in the VH remap in response to changes in the spatial layout, display expansions when environments are enlarged, and are sensitive to cue rotations. Interestingly, although ventral cells appear to be locked to external landmarks, the angular rotation of the fields fell midway between the original and rotated position of the cues. This finding suggests that while the contextual change is coded, other aspects of the context may be integrated within the ventral representation at the single cell level. One possibility is that since all cue rotations are performed in the same room, ventral cells may be integrating between the proximal reference frame (e.g., rotated cue) and a distal reference frame (e.g., room light). It has been shown that different dorsal cells within a population simultaneously lock to distinct reference frames when cues are in conflict (Knierim et al., 1998; Zinyuk et al., 2000; Gothard et al., 2001; Jackson and Redish, 2007; Kelemen and Fenton, 2010); however, this has not been tested in VH cells. Our data suggest that rather than locking to a single reference frame or fluctuating between different reference frames over time, ventral cells may instead integrate several types of information when particular landmarks are altered. As we further demonstrate that ventral populations can provide very accurate spatial information, the VH may be in a unique position to form complex representations that incorporate precise trajectories with contextual as well as non-spatial information.
The Role of the VH in Generalization Across Space
The results of the modeling conducted in this study suggest that the hippocampus may employ a representational gradient in part to bypass the tradeoff between interference and generalization inherent in network memory. Specifically, rather than encoding memories in a single population, the hippocampus may redundantly encode the same memory in a number of populations, each varying in its sparsity and, by extension, its bias toward interference and generalization. Our model suggests that in the DH, generalization is restricted to immediately neighboring locations, reducing the amount of interference between memories formed at different locations, while in the VH generalization is supported across a much wider range of spatial locations, at the cost of interference between these memories. This would allow the hippocampus to robustly generalize while protecting the specifics of memories from catastrophic interference (McCloskey and Cohen, 1989). As we have shown in our interference results, a spatial representational gradient would not only directly impact spatial associations, but could influence memory for nonspatial information as well. Therefore, we suggest that the function of this spatial gradient may not reflect a change in the representation of spatial information per se, but may instead reflect a balance of competing demands on an episodic memory system.
Our population coding analyses demonstrate that place field overlap is crucial for broadly tuned ventral representations to precisely code spatial location. If ventral place fields were large but not overlapping or unreliable, the ability of the VH to learn to generalize across place field boundaries would be greatly compromised. By providing evidence that spatial precision is preserved in ventral populations, we show that ventral populations are well positioned to learn generalizations across locations.
We observe that ventral cells, like dorsal cells, remap between contexts, raising the question of whether ventral cells retain the ability to generalize between locations across different contexts. As we have noted, the ability to generalize is a product of representational similarity between locations. In the DH, finely tuned place fields, in conjunction with random remapping across contexts, reduces the likelihood that locations across contexts where generalization is appropriate also share representational similarity. However, because ventral cells are broadly tuned and frequently span the entirety of the environment, changes in the spatial code do not result in completely orthogonal representations of locations across environments. Thus, despite remapping, the overlap of ventral fields could potentially support generalization across contextual boundaries.
Recent work demonstrated that ventral representations gradually change with experience as rewarded odor associations are learned (Komorowski et al., 2013). Specifically, as rats learned the reward contingencies of two connected contexts containing the same two odor cues but differentially rewarded, ventral cells originally active across both contexts gradually became context selective. This suggests that ventral representations are shaped with experience to avoid behaviorally detrimental generalizations across events as the reward contingency is learned. Our work compliments and further extends these results by demonstrating that in novel, non-rewarded environments, coding precise spatial location is an organizing principle of distributed ventral representations, which may allow ventral cells to support behavioral generalization across locations, contextual boundaries, and events.
Other Potential Roles of the VH
It is worth noting that the scaling of spatial representations along the longitudinal hippocampal axis may also serve non-mnemonic functions. For example, precise distributed ventral representation may be useful for estimating distances on larger scales. Because representations of nearby locations are correlated (Maurer et al., 2005; Kjelstrup et al., 2008), representational overlap can be used as a distance metric, but only when representations of the two locations overlap. Thus, maximum estimable distance would be bound by the distribution of the representation across the population. In the DH where spatial representations are sparse, nearby locations may be represented by a completely new set of place cells, thereby rendering population activity alone insufficient to determine the distance separating these locations. The broader representations of the VH could support the estimation of distances over a much larger scale. Distance estimation can be critical for planning and goal-directed navigation, and evidence of this function and its segregation along the longitudinal hippocampal axis has been reported in humans (Morgan et al., 2011). Given that the hippocampus integrates many aspects of episodic memory, including spatial and nonspatial events such as emotional and motivational information (Wood et al., 1999; Moita et al., 2003, 2004; Kennedy and Shapiro, 2009; Wang et al., 2012), it is likely that the purpose of the redundant spatial gradient along the longitudinal hippocampal axis is multifaceted. This work highlights the existence and importance of precise spatial coding as a critical determinant of activity along the longitudinal axis.
Acknowledgments
The authors thank Michael Kahana and Russell Epstein for valuable comments on an earlier version of this article.
Grant sponsor: NSF CAREER (to I.M.); Grant number: 1256941; Grant sponsor: NSF IGERT (to A.K.).
References
- Agarwal G, Stevenson IH, Berényi A, Mizuseki K, Buzsáki G, Sommer FT. Spatially distributed local fields in the hippocampus encode rat position. Science. 2014;344:626–630. doi: 10.1126/science.1250444. [DOI] [PMC free article] [PubMed] [Google Scholar]
- Aikath D, Weible AP, Rowland DC, Kentros CG. Role of self-generated odor cues in contextual representation. Hippocampus. 2014;24:1039–1051. doi: 10.1002/hipo.22289. [DOI] [PMC free article] [PubMed] [Google Scholar]
- Amaral D, Witter M. The three-dimensional organization of the hippocampal formation: A review of anatomical data. Neuroscience. 1989;31:571–591. doi: 10.1016/0306-4522(89)90424-7. [DOI] [PubMed] [Google Scholar]
- Amaral DG, Kurz J. An analysis of the origins of the cholinergic and noncholinergic septal projections to the hippocampal formation of the rat. J Comp Neurol. 1985;240:37–59. doi: 10.1002/cne.902400104. [DOI] [PubMed] [Google Scholar]
- Anderson MI, Jeffery KJ. Heterogeneous modulation of place cell firing by changes in context. J Neurosci. 2003;23:8827–8835. doi: 10.1523/JNEUROSCI.23-26-08827.2003. [DOI] [PMC free article] [PubMed] [Google Scholar]
- Bannerman DM, Rawlins JNP, McHugh SB, Deacon RMJ, Yee BK, Bast T, Zhang WN, Pothuizen HHJ, Feldon J. Regional dissociations within the hippocampus–memory and anxiety. Neurosci Biobehav Rev. 2004;28:273–283. doi: 10.1016/j.neubiorev.2004.03.004. [DOI] [PubMed] [Google Scholar]
- Bostock E, Muller RU, Kubie JL. Experience-dependent modifications of hippocampal place cell firing. Hippocampus. 1991;1:193–205. doi: 10.1002/hipo.450010207. [DOI] [PubMed] [Google Scholar]
- Briggs GE. Acquisition, extinction, and recovery functions in retroactive inhibition. J Exp Psychol. 1954;47:285–293. doi: 10.1037/h0060251. [DOI] [PubMed] [Google Scholar]
- Cenquizca LA, Swanson LW. Spatial organization of direct hippocampal field CA1 axonal projections to the rest of the cerebral cortex. Brain Res Rev. 2007;56:1–26. doi: 10.1016/j.brainresrev.2007.05.002. [DOI] [PMC free article] [PubMed] [Google Scholar]
- Cho YH, Giese KP, Tanila H, Silva AJ, Eichenbaum H. Abnormal hippocampal spatial representations in alphaCaMKIIT286A and CREBalphaDelta- mice. Science. 1998;279:867–869. doi: 10.1126/science.279.5352.867. [DOI] [PubMed] [Google Scholar]
- Csicsvari J, Hirase H, Czurko A, Buzsáki G. Reliability and state dependence of pyramidal cell-interneuron synapses in the hippocampus: An ensemble approach in the behaving rat. Neuron. 1998;21:179–189. doi: 10.1016/s0896-6273(00)80525-5. [DOI] [PubMed] [Google Scholar]
- Deadwyler SA, Bunn T, Hampson RE. Hippocampal ensemble activity during spatial delayed-nonmatch-to-sample performance in rats. J Neurosci. 1996;16:354–372. doi: 10.1523/JNEUROSCI.16-01-00354.1996. [DOI] [PMC free article] [PubMed] [Google Scholar]
- Dolorfo CL, Amaral DG. Entorhinal cortex of the rat: topographic organization of the cells of origin of the perforant path projection to the dentate gyrus. J Comp Neurol. 1998;398:25–48. [PubMed] [Google Scholar]
- Van Duuren E, Lankelma J, Pennartz CMA. Population coding of reward magnitude in the orbitofrontal cortex of the rat. J Neurosci. 2008;28:8590–8603. doi: 10.1523/JNEUROSCI.5549-07.2008. [DOI] [PMC free article] [PubMed] [Google Scholar]
- Fanselow MS, Dong HW. Are the dorsal and ventral hippocampus functionally distinct structures? Neuron. 2010;65:7–19. doi: 10.1016/j.neuron.2009.11.031. [DOI] [PMC free article] [PubMed] [Google Scholar]
- Fenton AA, Muller RU. Place cell discharge is extremely variable during individual passes of the rat through the firing field. Proc Natl Acad Sci USA. 1998;95:3182–3187. doi: 10.1073/pnas.95.6.3182. [DOI] [PMC free article] [PubMed] [Google Scholar]
- Fenton AA, Lytton WW, Barry JM, Lenck-Santini PP, Zinyuk LE, Kubík S, Bures J, Poucet B, Muller RU, Olypher AV. Attention-like modulation of hippocampus place cell discharge. J Neurosci. 2010;30:4613–4625. doi: 10.1523/JNEUROSCI.5576-09.2010. [DOI] [PMC free article] [PubMed] [Google Scholar]
- Gall C, Brecha N, Karten HJ, Chang KJ. Localization of enkephalin-like immunoreactivity to identified axonal and neuronal populations of the rat hippocampus. J Comp Neurol. 1981;198:335–350. doi: 10.1002/cne.901980211. [DOI] [PubMed] [Google Scholar]
- Garcia Ruiz AJ, Zambelli M, La Porta C, Ladinsky H, Consolo S. Differences between rat dorsal and ventral hippocampus in muscarinic receptor agonist binding and interaction with phospholipase C. Eur J Pharmacol. 1993;244:125–131. doi: 10.1016/0922-4106(93)90017-4. [DOI] [PubMed] [Google Scholar]
- Gothard KM, Hoffman KL, Battaglia FP, McNaughton BL. Dentate gyrus and ca1 ensemble activity during spatial reference frame shifts in the presence and absence of visual input. J Neurosci. 2001;21:7284–7292. doi: 10.1523/JNEUROSCI.21-18-07284.2001. [DOI] [PMC free article] [PubMed] [Google Scholar]
- Haring JH, Davis JN. Differential distribution of locus coeruleus projections to the hippocampal formation: Anatomical and biochemical evidence. Brain Res. 1985;325:366–369. doi: 10.1016/0006-8993(85)90342-7. [DOI] [PubMed] [Google Scholar]
- Hiroi M, Ohkura M, Nakai J, Masuda N, Hashimoto K, Inoue K, Fiala A, Tabata T. Principal component analysis of odor coding at the level of third-order olfactory neurons in Drosophila. Genes Cells. 2013;18:1070–1081. doi: 10.1111/gtc.12094. [DOI] [PubMed] [Google Scholar]
- Hoover WB, Vertes RP. Anatomical analysis of afferent projections to the medial prefrontal cortex in the rat. Brain Struct Funct. 2007;212:149–179. doi: 10.1007/s00429-007-0150-4. [DOI] [PubMed] [Google Scholar]
- Jackson J, Redish AD. Network dynamics of hippocampal cell-assemblies resemble multiple spatial maps within single tasks. Hippocampus. 2007;17:1209–1229. doi: 10.1002/hipo.20359. [DOI] [PubMed] [Google Scholar]
- Jones LM, Fontanini A, Katz DB. Gustatory processing: A dynamic systems approach. Curr Opin Neurobiol. 2006;16:420–428. doi: 10.1016/j.conb.2006.06.011. [DOI] [PubMed] [Google Scholar]
- Jung MW, Wiener SI, McNaughton BL. Comparison of spatial firing characteristics of units in dorsal and ventral hippocampus of the rat. J Neurosci. 1994;14:7347–7356. doi: 10.1523/JNEUROSCI.14-12-07347.1994. [DOI] [PMC free article] [PubMed] [Google Scholar]
- Kelemen E, Fenton AA. Dynamic grouping of hippocampal neural activity during cognitive control of two spatial frames. PLoS Biol. 2010;8:e1000403. doi: 10.1371/journal.pbio.1000403. [DOI] [PMC free article] [PubMed] [Google Scholar]
- Kennedy PJ, Shapiro ML. Motivational states activate distinct hippocampal representations to guide goal-directed behaviors. Proc Natl Acad Sci USA. 2009;106:10805–10810. doi: 10.1073/pnas.0903259106. [DOI] [PMC free article] [PubMed] [Google Scholar]
- Kentros C, Hargreaves E, Hawkins RD, Kandel ER, Shapiro M, Muller RV. Abolition of long-term stability of new hippocampal place cell maps by NMDA receptor blockade. Science. 1998;280:2121–2126. doi: 10.1126/science.280.5372.2121. [DOI] [PubMed] [Google Scholar]
- Kentros CG, Agnihotri NT, Streater S, Hawkins RD, Kandel ER. Increased attention to spatial context increases both place field stability and spatial memory. Neuron. 2004;42:283–295. doi: 10.1016/s0896-6273(04)00192-8. [DOI] [PubMed] [Google Scholar]
- Kerr K, Agster K, Furtak S, Burwell R. Functional neuroanatomy of the parahippocampal region: the lateral and medial entorhinal areas. Hippocampus. 2007;708:697–708. doi: 10.1002/hipo.20315. [DOI] [PubMed] [Google Scholar]
- Kesner RP. Role of the hippocampus in mediating interference as measured by pattern separation processes. Behav Processes. 2013;93:148–154. doi: 10.1016/j.beproc.2012.09.018. [DOI] [PubMed] [Google Scholar]
- Kishi T, Tsumori T, Yokota S, Yasui Y. Topographical projection from the hippocampal formation to the amygdala: A combined anterograde and retrograde tracing study in the rat. J Comp Neurol. 2006;496:349–368. doi: 10.1002/cne.20919. [DOI] [PubMed] [Google Scholar]
- Kjelstrup KB, Solstad T, Brun VH, Hafting T, Leutgeb S, Witter MP, Moser EI, Moser MB. Finite scale of spatial representation in the hippocampus. Science. 2008;321:140–143. doi: 10.1126/science.1157086. [DOI] [PubMed] [Google Scholar]
- Knierim JJ, Kudrimoti HS, McNaughton BL. Interactions between idiothetic cues and external landmarks in the control of place cells and head direction cells. J Neurophysiol. 1998;80:425–446. doi: 10.1152/jn.1998.80.1.425. [DOI] [PubMed] [Google Scholar]
- Köohler C, Eriksson LG, Davies S, Chan-Palay V. Co-localization of neuropeptide tyrosine and somatostatin immunoreactivity in neurons of individual subfields of the rat hippocampal region. Neurosci Lett. 1987;78:1–6. doi: 10.1016/0304-3940(87)90551-9. [DOI] [PubMed] [Google Scholar]
- Komorowski RW, Garcia CG, Wilson A, Hattori S, Howard MW, Eichenbaum H. Ventral hippocampal neurons are shaped by experience to represent behaviorally relevant contexts. J Neurosci. 2013;33:8079–8087. doi: 10.1523/JNEUROSCI.5458-12.2013. [DOI] [PMC free article] [PubMed] [Google Scholar]
- Laurent G, Stopfer M, Friedrich RW, Rabinovich MI, Volkovskii A, Abarbanel HD. Odor encoding as an active, dynamical process: Experiments, computation, and theory. Annu Rev Neurosci. 2001;24:263–297. doi: 10.1146/annurev.neuro.24.1.263. [DOI] [PubMed] [Google Scholar]
- MacLeod K, Laurent G. Distinct mechanisms for synchronization and temporal patterning of odor-encoding neural assemblies. Science. 1996;274:976–979. doi: 10.1126/science.274.5289.976. [DOI] [PubMed] [Google Scholar]
- Majak K, Pitkäanen A. Projections from the periamygdaloid cortex to the amygdaloid complex, the hippocampal formation, and the parahippocampal region: A PHA-L study in the rat. Hippocampus. 2003;13:922–942. doi: 10.1002/hipo.10134. [DOI] [PubMed] [Google Scholar]
- Marek R, Strobel C, Bredy TW, Sah P. The amygdala and medial prefrontal cortex: Partners in the fear circuit. J Physiol. 2013;591:2381–2391. doi: 10.1113/jphysiol.2012.248575. [DOI] [PMC free article] [PubMed] [Google Scholar]
- Markus EJ, Barnes CA, McNaughton BL, Gladden VL, Skaggs WE. Spatial information content and reliability of hippocampal CA1 neurons: Effects of visual input. Hippocampus. 1994;4:410–421. doi: 10.1002/hipo.450040404. [DOI] [PubMed] [Google Scholar]
- Maroun M. Medial prefrontal cortex: Multiple roles in fear and extinction. Neuroscientist. 2013;19:370–383. doi: 10.1177/1073858412464527. [DOI] [PubMed] [Google Scholar]
- Maurer AP, Vanrhoads SR, Sutherland GR, Lipa P, McNaughton BL. Self-motion and the origin of differential spatial scaling along the septo-temporal axis of the hippocampus. Hippocampus. 2005;15:841–852. doi: 10.1002/hipo.20114. [DOI] [PubMed] [Google Scholar]
- McCloskey M, Cohen N. Catastrophic interference in connectionist networks: The sequential learning problem. In: Bower GH, editor. The Psychology of Learning and Motivation. Vol. 24. San Diego, CA: Academic Press; 1989. pp. 109–164. [Google Scholar]
- Moita MAP, Rosis S, Zhou Y, LeDoux JE, Blair HT. Hippocampal place cells acquire location-specific responses to the conditioned stimulus during auditory fear conditioning. Neuron. 2003;37:485–497. doi: 10.1016/s0896-6273(03)00033-3. [DOI] [PubMed] [Google Scholar]
- Moita MAP, Rosis S, Zhou Y, LeDoux JE, Blair HT. Putting fear in its place: Remapping of hippocampal place cells during fear conditioning. J Neurosci. 2004;24:7015–7023. doi: 10.1523/JNEUROSCI.5492-03.2004. [DOI] [PMC free article] [PubMed] [Google Scholar]
- Morgan LK, Macevoy SP, Aguirre GK, Epstein RA. Distances between real-world locations are represented in the human hippocampus. J Neurosci. 2011;31:1238–1245. doi: 10.1523/JNEUROSCI.4667-10.2011. [DOI] [PMC free article] [PubMed] [Google Scholar]
- Muller RU, Kubie JL, Ranck JB. Spatial firing patterns of hippocampal complex-spike cells in a fixed environment. J Neurosci. 1987;7:1935–1950. doi: 10.1523/JNEUROSCI.07-07-01935.1987. [DOI] [PMC free article] [PubMed] [Google Scholar]
- Muller RU, Kubie JL. The effects of changes in the environment on the spatial firing of hippocampal complex-spike cells. J Neurosci. 1987;7:1951–1968. doi: 10.1523/JNEUROSCI.07-07-01951.1987. [DOI] [PMC free article] [PubMed] [Google Scholar]
- Muzzio IA, Levita L, Kulkarni J, Monaco J, Kentros C, Stead M, Abbott LF, Kandel ER. Attention enhances the retrieval and stability of visuospatial and olfactory representations in the dorsal hippocampus. PLoS Biol. 2009;7:e1000140. doi: 10.1371/journal.pbio.1000140. [DOI] [PMC free article] [PubMed] [Google Scholar]
- Nadel L, Hoscheidt S, Ryan L. Spatial cognition and the hippocampus: The anterior–posterior axis. J Cogn Neurosci. 2013;25:22–28. doi: 10.1162/jocn_a_00313. [DOI] [PubMed] [Google Scholar]
- O'Keefe J, Burgess N. Dual phase and rate coding in hippocampal place cells: Theoretical significance and relationship to entorhinal grid cells. Hippocampus. 2005;15:853–866. doi: 10.1002/hipo.20115. [DOI] [PMC free article] [PubMed] [Google Scholar]
- O'Keefe J. Place units in the hippocampus of the freely moving rat. Exp Neurol. 1976;51:78–109. doi: 10.1016/0014-4886(76)90055-8. [DOI] [PubMed] [Google Scholar]
- O'Neill PK, Gordon JA, Sigurdsson T. Theta oscillations in the medial prefrontal cortex are modulated by spatial working memory and synchronize with the hippocampus through its ventral subregion. J Neurosci. 2013;33:14211–14224. doi: 10.1523/JNEUROSCI.2378-13.2013. [DOI] [PMC free article] [PubMed] [Google Scholar]
- O'Reilly RC, McClelland JL. Hippocampal conjunctive encoding, storage, and recall: avoiding a trade-off. Hippocampus. 1994;4:661–682. doi: 10.1002/hipo.450040605. [DOI] [PubMed] [Google Scholar]
- Osborne LC, Palmer SE, Lisberger SG, Bialek W. The neural basis for combinatorial coding in a cortical population response. J Neurosci. 2008;28:13522–13531. doi: 10.1523/JNEUROSCI.4390-08.2008. [DOI] [PMC free article] [PubMed] [Google Scholar]
- Petrovich GD, Canteras NS, Swanson LW. Combinatorial amygdalar inputs to hippocampal domains and hypothalamic behavior systems. Brain Res Brain Res Rev. 2001;38:247–289. doi: 10.1016/s0165-0173(01)00080-7. [DOI] [PubMed] [Google Scholar]
- Pitkänen A, Pikkarainen M, Nurminen N, Ylinen A. Reciprocal connections between the amygdala and the hippocampal formation, perirhinal cortex, and postrhinal cortex in rat. A review. Ann NY Acad Sci. 2000;911:369–391. doi: 10.1111/j.1749-6632.2000.tb06738.x. [DOI] [PubMed] [Google Scholar]
- Poppenk J, Evensmoen HR, Moscovitch M, Nadel L. Long-axis specialization of the human hippocampus. Trends Cogn Sci. 2013;17:230–240. doi: 10.1016/j.tics.2013.03.005. [DOI] [PubMed] [Google Scholar]
- Poucet B, Thinus-Blanc C, Muller RU. Place cells in the ventral hippocampus of rats. Neuroreport. 1994;5:2045–2048. doi: 10.1097/00001756-199410270-00014. [DOI] [PubMed] [Google Scholar]
- Powers MM, Clark G. An evaluation of cresyl echt violet acetate as a Nissl stain. Stain Technol. 1955;30:83–88. doi: 10.3109/10520295509113749. [DOI] [PubMed] [Google Scholar]
- Ranck JB. Studies on single neurons in dorsal hippocampal formation and septum in unrestrained rats. I. Behavioral correlates and firing repertoires. Exp Neurol. 1973;41:461–531. doi: 10.1016/0014-4886(73)90290-2. [DOI] [PubMed] [Google Scholar]
- Rolls ET. A theory of hippocampal function in memory. Hippocampus. 1996;6:601–620. doi: 10.1002/(SICI)1098-1063(1996)6:6<601::AID-HIPO5>3.0.CO;2-J. [DOI] [PubMed] [Google Scholar]
- Rowland DC, Yanovich Y, Kentros CG. A stable hippocampal representation of a space requires its direct experience. Proc Natl Acad Sci USA. 2011;108:14654–14658. doi: 10.1073/pnas.1105445108. [DOI] [PMC free article] [PubMed] [Google Scholar]
- Royer S, Sirota A, Patel J, Buzsáki G. Distinct representations and theta dynamics in dorsal and ventral hippocampus. J Neurosci. 2010;30:1777–1787. doi: 10.1523/JNEUROSCI.4681-09.2010. [DOI] [PMC free article] [PubMed] [Google Scholar]
- Sakurai Y. Hippocampal and neocortical cell assemblies encode memory processes for different types of stimuli in the rat. J Neurosci. 1996;16:2809–2819. doi: 10.1523/JNEUROSCI.16-08-02809.1996. [DOI] [PMC free article] [PubMed] [Google Scholar]
- Saunders RC, Rosene DL, Van Hoesen GW. Comparison of the efferents of the amygdala and the hippocampal formation in the rhesus monkey: II. Reciprocal and non-reciprocal connections. J Comp Neurol. 1988;271:185–207. doi: 10.1002/cne.902710203. [DOI] [PubMed] [Google Scholar]
- Save E, Nerad L, Poucet B. Contribution of multiple sensory information to place field stability in hippocampal place cells. Hippocampus. 2000;10:64–76. doi: 10.1002/(SICI)1098-1063(2000)10:1<64::AID-HIPO7>3.0.CO;2-Y. [DOI] [PubMed] [Google Scholar]
- Skaggs WE, McNaughton BL, Gothard KM, Markus EJ. An information-theoretic approach to deciphering the hippocampal code. In: Hanson SJ, Cowan JD, editors. Giles CL, editors Advances in Neural Information Processing. Vol. 5. San Mateo, CA: Morgan Kaufmann; 1993. pp. 1030–1037. [Google Scholar]
- Steffenach HA, Sloviter RS, Moser EI, Moser MB. Impaired retention of spatial memory after transection of longitudinally oriented axons of hippocampal CA3 pyramidal cells. Proc Natl Acad Sci USA. 2002;99:3194–3198. doi: 10.1073/pnas.042700999. [DOI] [PMC free article] [PubMed] [Google Scholar]
- Stopfer M, Bhagavan S, Smith BH, Laurent G. Impaired odour discrimination on desynchronization of odour-encoding neural assemblies. Nature. 1997;390:70–74. doi: 10.1038/36335. [DOI] [PubMed] [Google Scholar]
- Stopfer M, Jayaraman V, Laurent G. Intensity versus identity coding in an olfactory system. Neuron. 2003;39:991–1004. doi: 10.1016/j.neuron.2003.08.011. [DOI] [PubMed] [Google Scholar]
- Verney C, Baulac M, Berger B, Alvarez C, Vigny A, Helle KB. Morphological evidence for a dopaminergic terminal field in the hippocampal formation of young and adult rat. Neuroscience. 1985;14:1039–1052. doi: 10.1016/0306-4522(85)90275-1. [DOI] [PubMed] [Google Scholar]
- Wang ME, Fraize NP, Yin L, Yuan RK, Petsagourakis D, Wann EG, Muzzio IA. Differential roles of the dorsal and ventral hippocampus in predator odor contextual fear conditioning. Hippocampus. 2013;23:451–466. doi: 10.1002/hipo.22105. [DOI] [PubMed] [Google Scholar]
- Wang ME, Wann EG, Yuan RK, Ramos Álvarez MM, Stead SM, Muzzio IA. Long-term stabilization of place cell remapping produced by a fearful experience. J Neurosci. 2012;32:15802–15814. doi: 10.1523/JNEUROSCI.0480-12.2012. [DOI] [PMC free article] [PubMed] [Google Scholar]
- Weeden CSS, Hu NJ, Ho LUN, Kesner RP. The role of the ventral dentate gyrus in olfactory pattern separation. Hippocampus. 2014;24:553–559. doi: 10.1002/hipo.22248. [DOI] [PubMed] [Google Scholar]
- Wiener SI, Paul CA, Eichenbaum H. Spatial and behavioral correlates of hippocampal neuronal activity. J Neurosci. 1989;9:2737–2763. doi: 10.1523/JNEUROSCI.09-08-02737.1989. [DOI] [PMC free article] [PubMed] [Google Scholar]
- Wood ER, Dudchenko PA, Eichenbaum H. The global record of memory in hippocampal neuronal activity. Nature. 1999;397:613–616. doi: 10.1038/17605. [DOI] [PubMed] [Google Scholar]
- Zhang K, Ginzburg I, McNaughton BL, Sejnowski TJ. Interpreting neuronal population activity by reconstruction: Unified framework with application to hippocampal place cells. J Neurophysiol. 1998;79:1017–1044. doi: 10.1152/jn.1998.79.2.1017. [DOI] [PubMed] [Google Scholar]
- Zinyuk L, Kubik S, Kaminsky Y, Fenton AA, Bures J. Understanding hippocampal activity by using purposeful behavior: Place navigation induces place cell discharge in both task-relevant and task-irrelevant spatial reference frames. Proc Natl Acad Sci USA. 2000;97:3771–3776. doi: 10.1073/pnas.050576397. [DOI] [PMC free article] [PubMed] [Google Scholar]