
Figure 4.
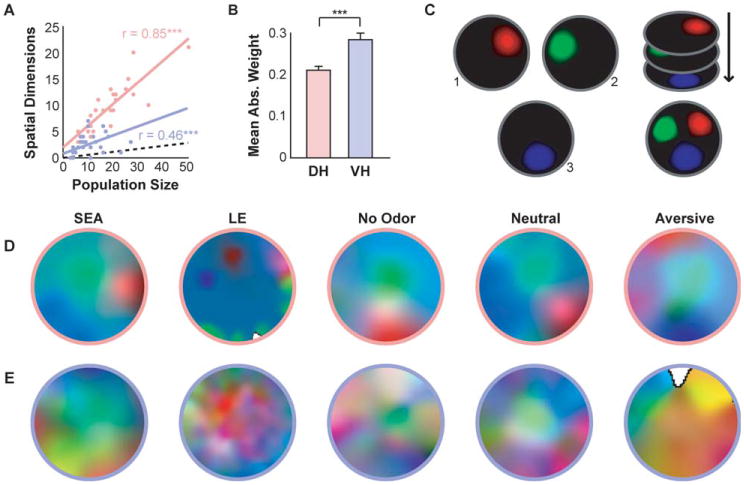
Principle component analysis (PCA) of spatial population activity. A) In both the DH and the VH, the percent of spatial components significantly exceeded chance (black dotted line). The number of spatial components also significantly correlated with population size in both regions, although this correlation was higher in the dorsal than ventral region. B) The mean absolute weight of ventral spatial components exceeds that of dorsal populations, which reflects a more distributed spatial representation. C) Schematic showing construction of composite place field maps for the three leading spatial components. Place field maps were generated for each spatial component, treating the activity along each component as if it were a cell. Spatial component place field maps were then normalized and represented in red, green, and blue, respectively. If position were well represented by distinct network states, we predicted a patchwork pattern with unique colors (network states) at unique locations. D, E) Example composite place field maps. Note that in both D) dorsal and E) ventral populations, particular locations are uniquely represented. However, while unique locations are sparsely represented in the DH (often driven by the activity of a single cell), in the VH unique locations are only apparent when the conjoint activity of many cells, and often many components, is considered.