Abstract
We synthesized Gd2O3 and Gd2O3 doped by europium (Eu) (2% to 10%) nanoplatelets using the polyol chemical method. The synthesized nanoplatelets were characterized by X-ray diffraction (XRD), FESEM, TEM, and EDX techniques. The optical properties of the synthesized nanoplatelets were investigated by photoluminescence spectroscopy. We also studied the magnetic resonance imaging (MRI) contrast enhancement of T1 relaxivity using 3 T MRI. The XRD for Gd2O3 revealed a cubic crystalline structure. The XRD of Gd2O3:Eu3+ nanoplatelets were highly consistent with Gd2O3 indicating the total incorporation of the Eu3+ ions in the Gd2O3 matrix. The Eu doping of Gd2O3 produced red luminescence around 612 nm corresponding to the radiative transitions from the Eu-excited state 5D0 to the 7F2. The photoluminescence was maximal at 5% Eu doping concentration. The stimulated CIE chromaticity coordinates were also calculated. Judd-Ofelt analysis was used to obtain the radiative properties of the sample from the emission spectra. The MRI contrast enhancement due to Gd2O3 was compared to DOTAREM commercial contrast agent at similar concentration of gadolinium oxide and provided similar contrast enhancement. The incorporation of Eu, however, decreased the MRI contrast due to replacement of gadolinium by Eu.
Keywords: Rare earth nanoparticles, MRI contrast, Photoluminescent nanoparticles
Background
Gadolinium is a rare earth (RE) metal that has paramagnetic properties that enhance the magnetic resonance imaging (MRI) signal [1]. Gadolinium ions have seven unpaired electrons in the valence shell and hence have a high magnetic moment suitable for MRI. Gadolinium accelerates proton relaxation and hence shortens the T1 relaxation time. Gadolinium complexes such as Gd-DTPA and Gd-DOTA are some of the most commonly used clinical MRI contrast agents [2,3]. Gadolinium is a good host material for luminescence applications due to its thermal, chemical, and photochemical stability [4-6].
The gadolinium oxide doped with Eu3+ (Gd2O3:Eu3+) is paramagnetic with attractive photoluminescence (PL) properties. It is widely used in fluorescence lamps, television tubes, biological fluorescent labeling [5,7,8], MRI contrast [9-11], hyperthermia [12], immunoassays [13,14], and display applications [15-18]. Eu3+-doped Gd2O3 nanoparticles are red-emitting phosphors with bright luminescence and long-term photothermal stability [19]. Gd2O3:Eu3+ is also a very efficient X-ray and thermoluminescent phosphor [20]. Eu3+-doped CaF2-fluorophosphate glass composites has intense IR fluorescence and is a promising candidate for IR lasers and amplifiers [21].
Gadolinium oxide and RE gadolinium oxide have been synthesized by many groups using different techniques such as sol-gel [22], polyol [23], flame-spray pyrolysis [24,25], laser ablation [26], hydrothermal [17,27,28], and direct precipitation [29].
In the present work, Gd2O3 and Gd2O3:Eu3+ nanoplatelets were synthesized using the simple and novel polyol chemical method. Detailed structural analysis such as field emission scanning electron microscopy (FESEM), transmission electron microscopy (TEM), and energy-dispersive X-ray EDX are reported. The photoluminescent properties of Eu3+-activated gadolinium oxide were investigated. Judd-Ofelt analysis was used to determine the radiative properties of the synthesized nanoparticles from their PL emission spectra. The attractive multifunctional Gd2O3 and Gd2O3:Eu3+ nanoplatelets were investigated form MRI contrast enhancement.
Methods
Synthesis of Gd2O3 and Gd2O3:Eu3+
All reagents were of analytical grade and were used without further purification in the experiment. In this experiment, 0.5 M gadolinium acetate (Gd(OAC)3) was dissolved in ethanol under continuous stirring. Then 50 wt.% polyethylene glycol (mol. wt 600) was transferred in the solution under continuous stirring. After sometime, dropwise addition of 0.1 M diethylamine was carried out into the reaction solution. For the doping purpose, 2% Eu (EuCl3) was transferred in the solution. The resultant solution was refluxed at 100°C for 48 h. After the reaction, the flask was cooled to room temperature. The precipitates of Gd2O3 were separated from the solution by centrifuging for 30 min with a rotation speed of 3,000 rpm and then washed using deionized water. The rinsing was repeated three to five times to totally remove organic and inorganic ions adsorbed on the surface of the product. The white grayish color product was dried in an oven at 80°C for 24 h. In order to obtain highly crystalline nature of Eu-Gd2O3, the product was further calcinated in ambient atmosphere at approximately 600°C for 12 h. Similar procedure was adopted for 5% and 10% europium (Eu) doping.
Characterization
The synthesized products were characterized using X-ray diffraction (XRD), FESEM, TEM, PL, and MRI. The crystal structure of the synthesized nanoparticles was investigated by XRD using a (XRD Shimadzu 6000; Shimadzu, Kyoto, Japan) advance X-ray diffractometer with Cu-Kα radiation source (λ = 1.5418 Å). The FESEM analysis was done using (FESEM JSM-6700F). TEM analysis was done on a high-resolution transmission electron microscope (HRTEM; JEOL, Tokyo, Japan). The PL spectrum was recorded using Shimadzu spectrofluorometer (Shimadzu). The excitation source was a 150-W Xenon lamp with excitation wavelength fixed at 350 nm, and the emission monochromator was scanned in the 450 to 900-nm wavelength range. The MRI contrast enhancement due to different Gd2O3 concentrations from a commercial contrast agent, Dotarem® (Guerbet LLC, Bloomington, IN, USA), was compared to the contrast due to Gd2O3 nanoparticles and Gd2O3 nanoparticles doped with Eu (2% to 10%). The different concentrations were placed in plastic 10 ml test tubes. The test tubes were placed in a plastic test tube holder and imaged in a 3 T MRI scanner (General Electric, Fairfield, CT, USA). A pulse echo T1 sequence was used with pulse repetition rates of 20, 30, 50, 100, 200, 300, 400, 500, and 1,000 ms. The images were then analyzed in order to determine the contrast enhancement due to the nanoparticles and to obtain the T1 relaxation times.
Results and discussion
Structural properties
XRD measurements were used to explore the phase and structure of Gd2O3 and Gd2O3:Eu3+ nanostructures. Figure 1a demonstrates the XRD pattern of Gd2O3 and 2%, 5%, and 10% Gd2O3:Eu3+, respectively. These results confirmed the cubic structure of Gd2O3 and Gd2O3:Eu3+ with spatial group Ia3 (JCPDS card No. 00-012-0797). No other peaks were observed in the XRD spectrum related to impurities. Due to Eu doping, a high-intensity (222) peak shift was observed as shown in Figure 1b. The presence of strong peaks indicates the highly crystalline nature of Gd2O3 nanostructures.
Figure 1.
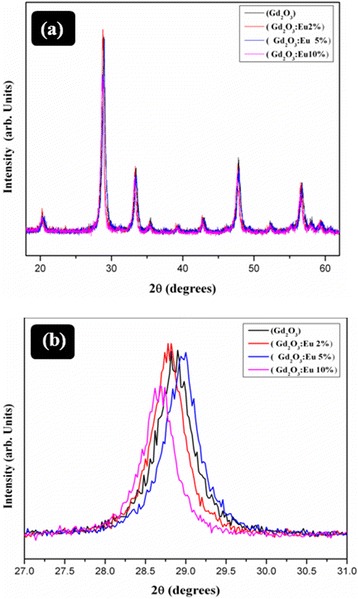
XRD pattern of Gd2O3, 2% 5%, and 10% Eu:Gd2O3 (a) and high-intensity (222) plane resolved for different Eu concentrations (b).
Figure 2a,b,c,d shows the FESEM images of Gd2O3 and Gd2O3:Eu3+ with different doping concentrations of 2%, 5%, and 10%, respectively. Figure 2a shows fine nanoflakes of Gd2O3. It is interesting to note that the thickness of the nanostructures augmented when doped with 2% Eu. Figure 2b shows FESEM micrograph of 2% Gd2O3:Eu3+ nanoplatelets with some nanocrystals. When the concentration of Eu3+ increased to 5%, highly uniform nanoplatelets were formed. The thickness of each nanoplatelet is about 15 to 25 nm (Figure 2c). Figure 2d shows FESEM micrograph of 10% Gd2O3:Eu3+ irregularly thick nanoplatelets. It is observed that by further increasing the concentration of Eu, the thickness and diameter of nanoplatelets increased significantly. FESEM observation showed clear change in the morphology due to doping from Gd2O3 nanoflakes to thick Gd2O3:Eu3+ nanoplatelets.
Figure 2.
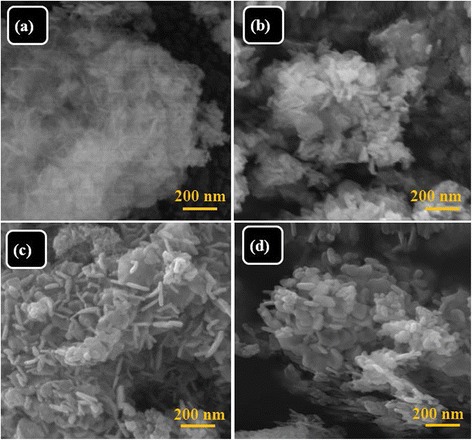
FESEM micrograph of (a) Gd2O3, (b) Gd2O3:Eu 2%, (c) Gd2O3:Eu 5%, and (d) Gd2O3:Eu 10%.
Figure 3a,b,c,d,e,f,g,h shows TEM HRTEM images of Gd2O3 with different Eu concentrations (2%, 5%, and 10%). The TEM analysis is in agreement with FESEM results in which the evolution of nanoplatelets is observed. The growth of Gd2O3:Eu3+ nanoplatelets is seen in TEM micrographs. From the HRTEM, the interspacing between the lattice fringes was found to be 0.316 nm which corresponds to growth plane (110) indicating the growth of nanoplatelets along the axis in [001] direction. The energy-dispersive spectrum (EDS) investigation (Figure 4) also confirmed that all the detected peaks are related to Gd, O, and Eu, indicating a chemically pure Gd2O3:Eu3+ phase. No other peak related to impurities was found in the samples.
Figure 3.
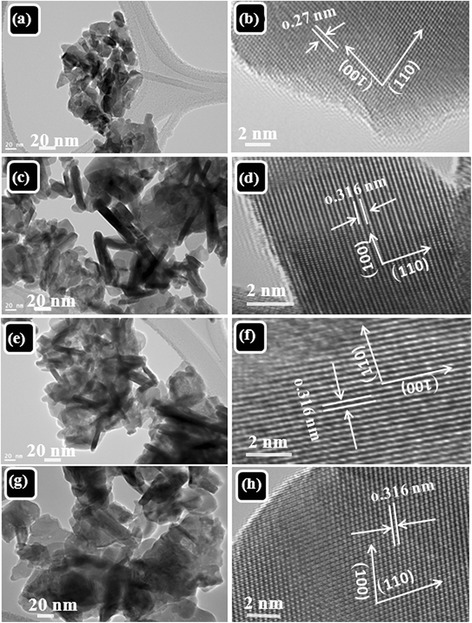
TEM micrographs of (a,b) Gd2O3, (c,d) Gd2O3:Eu 2%, (e,f) Gd2O3:Eu 5%, and (g,h) Gd2O3:Eu 10%.
Figure 4.
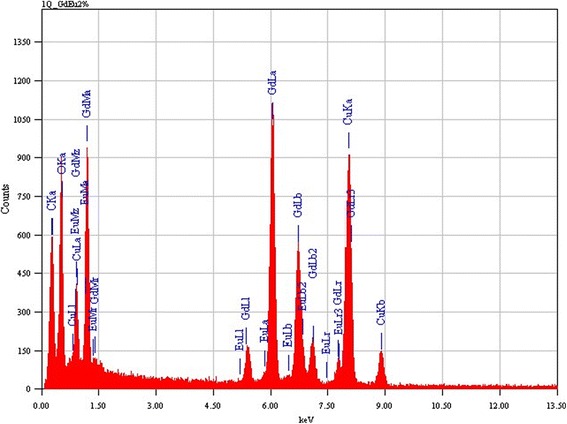
Energy dispersion spectrum (EDS) obtained from Gd2O3:Eu 2%.
Fluorescence properties
Figure 5 shows the PL spectra of Eu3+-doped Gd2O3 nanoparticles for different dopant concentrations (2%, 5%, and 10%) recorded in the 450 to 900-nm wavelength range. The spectra have five emission lines at 580, 593, 612, 652, and 708 nm corresponding to 5D0 → 7FJ (J = 0, 1, 2, 3, 4) transitions, respectively. The two transitions corresponding to 5D0 → 7FJ (J = 5, 6) are presented in the inset of Figure 5. We recorded a strong PL peak centered around 612 nm in addition to many smaller peaks for three different concentrations of Eu in Gd2O3. The high red luminescence signal intensity for Eu-doped samples around 612 nm corresponds to the radiative transitions from the Eu-excited state 5D0 to the 7F2 state (Figure 5). This sharp intense line indicates a complete incorporation of the dopant ions into Gd2O3 nanocrystals by replacing Gd3+ in a preferred C2 site symmetry compared to the S6 symmetry indicated by the 5D0 to the 7F1 transition [30]. In addition to the intense peak, numerous smaller peaks have been identified in the visible spectral range between 500 and 800 nm corresponding to the transitions from excited to the ground energy level of Eu. We also observed an increase of the emission intensities when the Eu3+ concentration increases to reach a maximal value at 5 mol%. Then the emission intensities decrease because of the concentration quenching. This emission behavior resembles exactly the fluorescence of Eu3+-doped phosphors [29,31]. Based on these measurements, we deduced an energy level scheme (Grotrian diagram) of the observed transition in PL spectra as shown in Figure 6 and Table 1.
Figure 5.
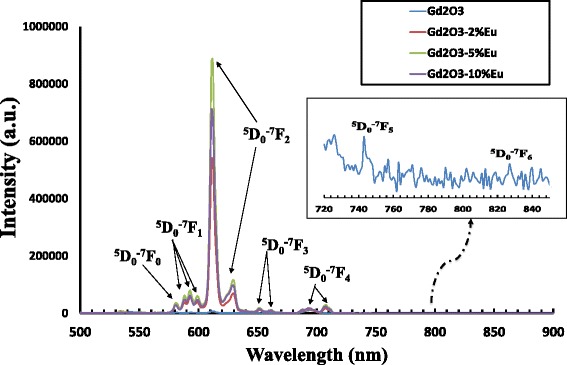
Photoluminescence spectrum of Gd2O3 and Eu (2% to 10%) doping of Gd2O3.
Figure 6.
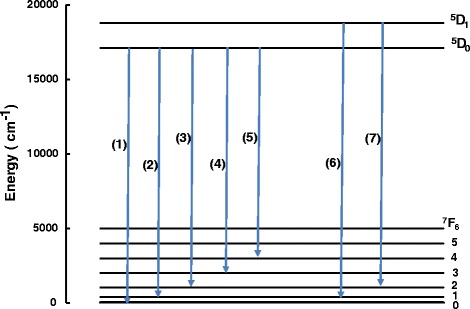
Schematic presentation of photoluminescence observed energy transitions.
Table 1.
Photoluminescence transitions observed for Gd 2 O 3 :Eu 3+ nanoplatelets
| label | Wavelength (nm) | Transition from | To |
|---|---|---|---|
| 1 | 580 | 5D0 → | 7F0 |
| 2 | 593 | 5D0 → | 7F1 |
| 3 | 612 | 5D0 → | 7F2 |
| 4 | 652 | 5D0 → | 7F3 |
| 5 | 708 | 5D0 → | 7F4 |
| 6 | 538 | 5D1 → | 7F1 |
| 7 | 554 | 5D1 → | 7F2 |
CIE chromaticity coordinates
The luminescent intensity of the emission spectral measurements has been characterized using the CIE1931 chromaticity diagram (Figure 7) to get information about the composition of all colors on the basis of color matching functions , , and [32,33]. The (x, y) coordinates are used to represent the color and locus of all the monochromatic color coordinates. The values of the color chromaticity coordinates (x, y) were found to be (x = 0.6387; y = 0.3609) for Gd2O3:Eu3+ (2%), (x = 0. 6447; y = 0. 3550) for Gd2O3:Eu3+ (5%), and (x = 0. 6477; y = 0.3520) for Gd2O3:Eu3+ (10%) (Figure 7). The color coordinates are all in the pure red region of the chromaticity diagram. Indeed, the present nanoplatelets Gd2O3:Eu3+ give emission in the red region with appreciable intensity for fluorescence imaging.
Figure 7.
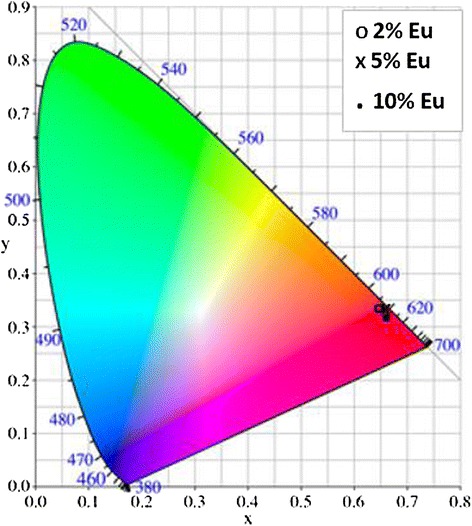
The CIE coordinate for Eu3+-doped Gd2O3 upon excitation at 365 nm.
Judd-Ofelt and radiative analysis
The Judd-Ofelt theory [34,35] is the most widely used and known theory in the analysis of spectroscopic properties of rare earth ions in different hosts. The great appeal of this theory is the ability to forecast the oscillator strengths in absorption and to give information about the luminescence branching ratios and lifetimes by using only three parameters, Ωk (k = 2,4,6) [36-39].
For the particular Eu rare earth ion-doped materials, the J-O intensity parameters are calculated with two different methods. The first method is based on the optical absorption spectra. The second method is referred to the analysis of emission spectra at room temperature. It is noteworthy to mention that in the case of Eu3+-doped nontransparent hosts, we are not always able to measure the absorption spectra [40,41]. Therefore, for Gd2O3:Eu3+ nanoplatelets, the second method allows the calculation of J-O parameters.
Table 2 shows the type of transitions for Eu3+ ion. The transition 5D0-7F1 is the only allowed magnetic dipole transition. The transitions from 5D0-7FJ′ (J′ = 0, 3, and 5) are forbidden according to electric and magnetic selection rules. In other words, their magnetic and electrics dipoles (Aed and Amd) are zero. However, these states are not pure and are mixed with other states by crystal-field interaction, which allow these transitions to be observed as is shown in Figure 5. The transitions 5D0-7FJ′ (J′ = 2, 4, and 6) are allowed electric dipole transitions and depend solely on Ωk (k = 2, 4, 6).
Table 2.
Wavenumbers, transition rates, and branching ratio for 5 D 0 → 7 F J' ( J ' = 0 − 6) of Eu 3+ ions in Gd 2 0 3
| Transition | Type | Wavenumber (cm −1 ) | Transition rate (s −1 ) | Branching ratio β (%) |
|---|---|---|---|---|
| 5D0 → 7F0 | Forbidden | 17,241 | 19.1132 | 1.9109 |
| 5D0 → 7F1 | Magnetic dipole | 16,863.4 | 66.5612 | 6.6548 |
| 5D0 → 7F2 | Electric dipole | 16,339 | 876.9950 | 87.6820 |
| 5D0 → 7F3 | Forbidden | 15,337 | 10.0094 | 1.0007 |
| 5D0 → 7F4 | Electric dipole | 14,124 | 27.0115 | 2.7006 |
| 5D0 → 7F5 | Forbidden | 13,422 | 0.4321 | 0.0432 |
| 5D0 → 7F6 | Electric dipole | 12,422 | 0.0534 | 0.0053 |
Since it is well known that magnetic dipole transitions in rare earth ions are independent of the ion’s surroundings, the magnetic dipole radiative transition rates Amd can be evaluated using the following expression:
Where n is the refractive index, (2J + 1) is the degeneracy of the initial state J and vmd is the transition energy of the 5D0→7F1 transition (cm−1), h is Planck constant (6.63 × 1027 erg s). Smd is the magnetic dipolar transition line strength, which is independent of host matrix and is equal to 11.26 × 10−42 (esu)2 cm2 [42]. From the definition of the , the refractive index can be calculated to be 1.58.
For a particular transition, the intensity (I) of an emission transition is proportional to the radiative decay rate , of that transition, which equals the reciprocal of intrinsic lifetime τ0. The intensity is also proportional to the area under that emission curve [43]. Thus, the intensity of an emission transition can be written as [44] follows:
The fluorescence lifetime of the nanoparticles is approximately 1 ms [45,46]. The values of , shown in Table 2 were determined by calculating the constant η. The radiative branching ratio shown in Table 2 was calculated using
The electric dipole transitions 5D0-7FJ′ (J′ = 2, 4, and 6) can be represented by using the three J-O parameters Ωk (k = 2, 4, 6) as follows [47,48]:
where h is the Planck’s constant, ν is the transition energy of electric dipole transition (in cm−1) and e is the charge of an electron, and is the double-reduced matrix element. All of the matrix elements for 5D0 → 7FJ′ transitions are zero [49-51], except those for the 5D0-7F2 transition (U(2) = 0.0028), the 5D0-7F4 transition (U(4) = 0.002) and the 5D0 → 7F6 transition (U(6) = 0.0002). Thus, the values of Ωk can be calculated using the emissions of 5D0 → 7FJ' (J' = 2, 4, 6). The results of our calculations are shown in Table 3 together with the Ωk values of Eu3+ ions in other hosts [41,51-57].
Table 3.
J-O parameters of Eu 3+ in several compounds
| Compounds | Ω 2 (10 −20 cm 2 ) | Ω 4 (10 −20 cm 2 ) | Ω 6 (10 −20 cm 2 ) | Reference |
|---|---|---|---|---|
| Gd2O3:Eu3+ nanoplatelets | 28.07 | 1.87 | 0.05 | This work |
| KLTB:Eu3+ | 14.20 | ~0 | 2.40 | Saleem (2010) [54] |
| L4BE:Eu3+ | 17.56 | ~0 | 4.26 | Babu (2000) [55] |
| LaOF:Eu3+ | 56.3 | 13.9 | - | Grzyb (2011) [56] |
| Gd2O3:Eu3+ nanocrystals | 5.61 | 1.57 | - | Liu (2006) [57] |
| Eu0.08K0.075Ba0.845TiO3 | 6.92 | 1.84 | - | Li (2008) [53] |
| Gd2(W0.5Mo0.5)O6:Eu3+ | 6.91 | 0.22 | - | Yue (2011) [41] |
| Fluorosilicate glass ceramic | 1.38 | 0.84 | - | Zhao (2007) [52] |
| Fluorophosphate glass | 3.24 | 5.11 | 2.89 | Balda (1996) [51] |
These intensity parameters follow the tendency Ω2 > Ω4 > Ω6 found for other materials containing Eu3+ ions. It is well known that Ω2 is most sensitive to the local structure and its value is indicative the higher asymmetry and higher covalence around the Eu3+ ions with their surrounding ligands [58]. However, the parameter Ω6 is inversely proportional to the Eu-O band covalency, since it is more strongly affected by the overlap integrals of 4f and 5d orbitals than Ω2 and Ω4 [58].
The MRI contrast enhancement
We have tested MR image enhancement properties of the gadolinium nanoparticles and the Eu-doped nanoparticles using the MRI scanner at King Fahd Specialist Hospital. We also compared the MR images to commercially available MRI contrast agent (DOTAREM) using the same gadolinium concentrations (Gd molar concentrations 0.05, 0.1, 0.2 and 0.4 mM). The gadolinium oxide nanoparticles provided comparable MR image enhancement to the commercially used contrast agent DOTAREM (Figure 8). The addition of Eu reduced the MRI contrast due to the replacement of gadolinium atoms by the Eu atoms in the material structure. Figure 9 shows the contrast relative to water due to Dotarem, Gd2O3, and Gd2O3:Eu (2% to 10%) for Gd molar concentration from 0.05 to 0.4 mM. Figure 10 shows the variation of the T1 relaxation time for Dotarem, Gd2O3, and Gd2O3:Eu (2% to 10%) for Gd molar concentration from 0.05 to 0.2 mM.
Figure 8.
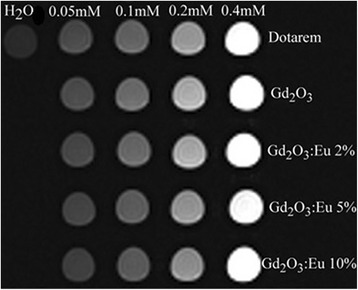
MRI of different concentrations (0.05 to 0.4 mM) of Gd2O3 and Gd2O3:Eu 2% to 10% compared to the same concentrations of commercial contrast agent (Dotarem).
Figure 9.
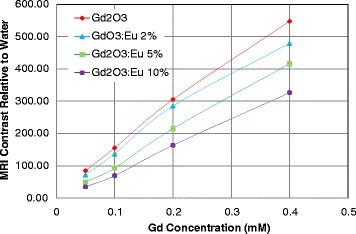
The contrast relative to water due to Gd2O3 and Gd2O3: Eu (2% to 10%) for Gd2O3 molar concentrations from 0.05 to 0.4 mM.
Figure 10.
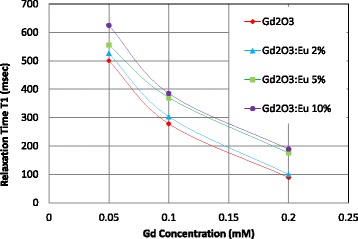
MRI relaxation time (T1) for Gd2O3 and Gd2O3:Eu (2% to 10%) for molar concentrations from 0.05 to 0.2 mM.
Conclusions
We synthesized nanoplatelets of Gd2O3 and Gd2O3:Eu3+ (2%, 5%, and 10%). The doping with Eu preserved the crystalline cubic structure of the Gd2O3 matrix. The MRI contrast of the Gd2O3 was comparable to the commercial gadolinium-based contrast agent DOTAREM at the same gadolinium concentrations. Doping the Gd2O3 with Eu exhibits very strong PL spectra especially in the red region at 612 nm corresponding to the radiative transitions from the Eu-excited state 5D0 to the 7F2 state. The strongest red PL was obtained at 5% Eu doping concentration. The stimulated CIE chromaticity coordinates and Judd-Ofelt analysis were used to obtain the radiative properties of the sample from the emission spectra. However, doping with Eu has decreased the MRI contrast and increased the T1 relaxation time. The MRI contrast enhancement decreased with increasing Eu doping concentration due to the replacement of the gadolinium atoms with Eu. The synthesized nanoparticles can be used as a contrast agent for magnetic resonance imaging. The PL in the red region can be exploited in labeling biological materials for fluorescence microscopy applications. The synthesized nanoplatelets have to be coated or encapsulated in biocompatible material such as polyethylene glycol to be used for in vivo MRI of cancer tissues with or without targeting molecules.
Acknowledgements
The author(s) would like to acknowledge the support provided by King Abdulaziz City for Science and Technology (KACST) through the Science & Technology Unit at King Fahd University of Petroleum & Minerals (KFUPM) for funding this work through project No. 10-NAN1386-04 as part of the National Science, Technology and Innovation Plan. We also would like to acknowledge the MRI support we received from Mr. Mustafa Al Muqbel from King Fahad Specialist Hospital, Dammam, KSA.
Footnotes
Competing interests
The authors declare that they have no competing interests.
Authors’ contributions
NM coordinated the project, conducted the MRI testing and analysis, and drafted the paper. AQ was in charge of nanoparticle synthesis, the TEM analysis, and contributed to writing the paper. AA did the Judd-Ofelt analysis of the PL spectra and contributed to the paper writing. RM was in charge the spectroscopic analysis, the PL emission spectra, the stimulated CIE chromaticity analysis, and Judd-Ofelt analysis, and contributed to the writing of the paper. NS was in charge of nanoparticle characterization including FESEM and XRD analyses. MI did the day-to-day experiments in synthesis and contributed to the nanoparticle characterization. MG was in charge of the PL spectroscopy and analysis and contributed to the writing of the paper. All authors read and approved the final manuscript.
Contributor Information
Nabil M Maalej, Email: maalej@kfupm.edu.sa.
Ahsanulhaq Qurashi, Email: ahsanulhaq@kfupm.edu.sa.
Achraf Amir Assadi, Email: achraf.assadi@gmail.com.
Ramzi Maalej, Email: ramzimaalej@yahoo.fr.
Mohammed Nasiruzzaman Shaikh, Email: mnshaikh@kfupm.edu.sa.
Muhammad Ilyas, Email: ilyasaali@yahoo.com.
Mohammad A Gondal, Email: magondal@kfupm.edu.sa.
References
- 1.Thompson CC. Gadolinium: compounds, production and applications. Edited by Thompson CC. New York: Nova Science Pub Inc; 2011.
- 2.Caravan P, Ellison JJ, McMurry TJ, Lauffer RB. Gadolinium(III) chelates as MRI contrast agents: structure, dynamics, and applications. Chem Rev. 1999;99:2293. doi: 10.1021/cr980440x. [DOI] [PubMed] [Google Scholar]
- 3.Geraldes CF, Laurent S. Classification and basic properties of contrast agents for magnetic resonance imaging contrast media. Mol Imaging. 2009;4:1. doi: 10.1002/cmmi.265. [DOI] [PubMed] [Google Scholar]
- 4.Zhou Y, Lin J, Wang S. Energy transfer and upconversion luminescence properties of Y2O3:Sm and Gd2O3:Sm phosphors. J Solid State Chem. 2003;171:391. doi: 10.1016/S0022-4596(02)00219-0. [DOI] [Google Scholar]
- 5.Lu H, Yi G, Zhao S, Chen D, Guo LH, Cheng J. Synthesis and characterization of multi-functional nanoparticles possessing magnetic up-conversion fluorescence and bio-affinity properties. Mater Chem. 2004;14:1336. doi: 10.1039/b315103d. [DOI] [Google Scholar]
- 6.Hirai T, Orikoshi T. Preparation of Gd2O3:Yb, Er and Gd2O2S:Yb, Er infrared-to visible conversion phosphor ultrafine particles using an emulsion liquid membrane system. J Colloid Interface Sci. 2004;269:103–8. doi: 10.1016/j.jcis.2003.08.026. [DOI] [PubMed] [Google Scholar]
- 7.Anker JN, Kopelman R. Magnetically modulated optical nanoprobes. Appl Phys Lett. 2003;82:1102. doi: 10.1063/1.1544435. [DOI] [Google Scholar]
- 8.Lechevallier SV, Lecante P, Mauricot R, Dexpert H, Dexpert-Ghys J, Kong HK, et al. Gadolinium–Europium carbonate particles: controlled precipitation for luminescent biolabeling. Chem Mater. 2010;22:6153. doi: 10.1021/cm102134k. [DOI] [Google Scholar]
- 9.Lee JE, Lee N, Kim H, Kim J, Choi SH, Kim JH, et al. Uniform mesoporous dye-doped silica nanoparticles decorated with multiple magnetite nanocrystals for simultaneous enhanced magnetic resonance imaging, fluorescence imaging, and drug delivery. J Am Chem Soc. 2010;132:552–7. doi: 10.1021/ja905793q. [DOI] [PubMed] [Google Scholar]
- 10.Wenlong X, Ja YP, Krishna K, Badrul Alam B, Woo CH, Seonguk J, et al. A T1, T2 magnetic resonance imaging (MRI)-fluorescent imaging (FI) by using ultrasmall mixed gadolinium–europium oxide nanoparticles. New J Chem. 2012;36:2361–7. doi: 10.1039/c2nj40149e. [DOI] [Google Scholar]
- 11.Hu Z, Ahrn M, Seleg L, Skoglund C, Sçderlind F, Engstrçm M, et al. Highly water-dispersible surface-modified Gd2O3 nanoparticles for potential dual-modal bioimaging. Chem Eur J. 2013;19:12658. doi: 10.1002/chem.201301687. [DOI] [PubMed] [Google Scholar]
- 12.Johannsen M, Gneveckow U, Eckelt L, Feussner A, Waldofner N, Scholz R, et al. Clinical hyperthermia of prostate cancer using magnetic nanoparticles: presentation of a new interstitial technique. Int J Hyperthermia. 2005;21:637. doi: 10.1080/02656730500158360. [DOI] [PubMed] [Google Scholar]
- 13.Feng J, Shan G, Maquieira A, Koivunen ME, Guo B, Hammock BD, et al. Functionalized europium oxide nanoparticles used as a fluorescent label in an immunoassay for atrazine. Anal Chem. 2003;75:5282. doi: 10.1021/ac034063m. [DOI] [Google Scholar]
- 14.Nichkova M, Dosev D, Gee SJ, Hammock BD, Kennedy IM. Microarray immunoassay for phenoxybenzoic acid using polymer encapsulated Eu:Gd2O3 nanoparticles as fluorescent labels. Anal Chem. 2005;77:6864–73. doi: 10.1021/ac050826p. [DOI] [PubMed] [Google Scholar]
- 15.Blasse G, Grabmaier BC. Luminescent materials. Edited by Blasse G and Grabmaier BC. Berlin: Springer; 1994. [Google Scholar]
- 16.Rossner W. The conversion of high energy radiation to visible light by luminescent ceramics. IEEE Trans Nucl Sci. 1993;40:376. doi: 10.1109/23.256583. [DOI] [Google Scholar]
- 17.Goldys EM, D-Tomsia K, Jinjun S, Dosev D, Kennedy IM, Yatsunenko S, et al. Optical characterization of Eu-doped and undoped Gd2O nanoparticles synthesized by the hydrogen flame pyrolysis method. J Am Chem Soc. 2006;128:14498. doi: 10.1021/ja0621602. [DOI] [PubMed] [Google Scholar]
- 18.Bedekar V, Dulta DP, Mohapatra M, Godbole SV, Ghildiyal R, Tyagi AK. Rare-earth doped gadolinia based phosphors for potential multicolor and white light emitting deep UV LEDs. Nanotechnology. 2009;20:5707. doi: 10.1088/0957-4484/20/12/125707. [DOI] [PubMed] [Google Scholar]
- 19.Bhargava RN. Doped nanocrystalline materials - physics and applications. J Lumin. 1996;70:85. doi: 10.1016/0022-2313(96)00046-4. [DOI] [Google Scholar]
- 20.Rossner W, Grabmaier BC. Phosphors for X-ray detectors in computed tomography. J Lumin. 1991;48:29. doi: 10.1016/0022-2313(91)90072-4. [DOI] [Google Scholar]
- 21.Jintai F, Xinqiang Y, Rihong L, Hongxing D, Jun W, Long Z. Intense photoluminescence at 2.7 μm in transparent Er3+:CaF2-fluorophosphate glass microcomposite. Opt Lett. 2011;36:4347. doi: 10.1364/OL.36.004347. [DOI] [PubMed] [Google Scholar]
- 22.Murillo AG, Ramírez AM, Romo FC, Hernández MG, Crespo MD. Synthesis, structural and optical studies of sol–gel Gd2O3:Eu3+, Tb3+ films. Mater Lett. 2009;04:034. [Google Scholar]
- 23.Müller A, Heim O, Panneerselvam M, Willert-Porada M. Polyol method for the preparation of nanosized Gd2O3, boehmite and other oxides materials. Res Bull. 2005;40:2153. doi: 10.1016/j.materresbull.2005.07.006. [DOI] [Google Scholar]
- 24.Mangiarini F, Naccache R, Speghini A, Bettinelli M, Vetrone F, Capobianco JA. Upconversion in Er3+-doped Gd2O3 nanocrystals prepared by propellant synthesis and flame spray pyrolysis. Mat Res Bull. 2010;45:927. doi: 10.1016/j.materresbull.2010.04.016. [DOI] [Google Scholar]
- 25.Iwako Y, Akimoto Y, Omiya M, Ueda T, Yokomori T. Photoluminescence of cubic and monoclinic Gd2O3:Eu phosphors prepared by flame spray pyrolysis. J Lumin. 2010;130:1470. doi: 10.1016/j.jlumin.2010.03.014. [DOI] [Google Scholar]
- 26.Ledoux G, Aman D, Dujardin C, Masenelli-Varlot K. Facile and rapid synthesis of highly luminescent nanoparticles via pulsed laser ablation in liquid. Nanotechnology. 2009;20:5605. doi: 10.1088/0957-4484/20/44/445605. [DOI] [PubMed] [Google Scholar]
- 27.Liu G, Hong G, Wang J, Dong X. Hydrothermal synthesis of spherical and hollow Gd2O3:Eu3+ phosphors. J Alloys Compd. 2007;432:200. doi: 10.1016/j.jallcom.2006.05.127. [DOI] [Google Scholar]
- 28.Kyung-Hee L, Yun-Jeong B, Song-Ho B. Nanostructures and photoluminescence properties of Gd2O3:Eu red-phosphor prepared via hydrothermal route. Bull Korean Chem Soc. 2008;29:2161. doi: 10.5012/bkcs.2008.29.11.2161. [DOI] [Google Scholar]
- 29.Bazzia R, Flores-Gonzaleza MA, Louisa C, Lebboua K, Dujardina C, Breniera A, et al. Synthesis and luminescent properties of sub-5-nm lanthanide oxides nanoparticles. J Lumin. 2003;102:445. doi: 10.1016/S0022-2313(02)00588-4. [DOI] [Google Scholar]
- 30.Kumar RG, Hata AS, Gopchandran KG. Diethylene glycol mediated synthesis of Gd2O3:Eu3+ nanophosphor and its Judd–Ofelt analysis. Ceram Inter. 2013;l39:9125. doi: 10.1016/j.ceramint.2013.05.010. [DOI] [Google Scholar]
- 31.Kang YC, Park SB, Lenggoro IW, Okuyama K. Gd2O3:Eu phosphor particles with sphericity, submicron size and non-aggregation characteristics. J Phys Chem Solid. 1999;60:379. doi: 10.1016/S0022-3697(98)00266-2. [DOI] [Google Scholar]
- 32.Harris AC, Weatherall IL. Objective evaluation of color variation in the sand-burrowing beetle Chaerodes trachyscelides White (Coleoptera: Tenebrionidae) by instrumental determination of CIELAB values. J Royal Soc New Zeal. 1990;20:253. doi: 10.1080/03036758.1990.10416819. [DOI] [Google Scholar]
- 33.Fairman HS, Brill MH, Hemmendinger H. How the CIE 1931 color-matching functions were derived from Wright-Guild data. Color Res Appl. 1997;22:11. doi: 10.1002/(SICI)1520-6378(199702)22:1<11::AID-COL4>3.0.CO;2-7. [DOI] [Google Scholar]
- 34.Judd BR. Optical absorption intensities of rare-earth ions. Phys Rev. 1962;127:750–61. doi: 10.1103/PhysRev.127.750. [DOI] [Google Scholar]
- 35.Ofelt GS. Intensities of crystal spectra of rare-earth ions. J Chem Phys. 1962;37:511–20. doi: 10.1063/1.1701366. [DOI] [Google Scholar]
- 36.Damak K, El Sayed Y, Al-Shihri AS, Seo HJ, Rüssel C, Maâlej R. Quantifying Raman and emission gain coefficients of Ho3+ doped TeO2·ZnO·PbO·PbF2·Na2O (TZPPN) tellurite glass. Solid State Sci. 2014;28:7480. doi: 10.1016/j.solidstatesciences.2013.12.012. [DOI] [Google Scholar]
- 37.Damak K, Maalej R, Yousef ES, Qusti AH, Rüssel C. Thermal and spectroscopic properties of Tm3+ doped TZPPN transparent glass laser material. J Non-Cryst Solids. 2012;358:2974. doi: 10.1016/j.jnoncrysol.2012.07.027. [DOI] [Google Scholar]
- 38.Damak K, Yousef E, AlFaify S, Rüssel C, Maâlej R. Raman, green and infrared emission cross-sections of Er3+ doped TZPPN tellurite glass. Opt Mater Express. 2014;4:597. doi: 10.1364/OME.4.000597. [DOI] [Google Scholar]
- 39.Assadi AA, Damak K, Lachheb R, Herrmann R, Yousef E, Rüssel C, et al. Spectroscopic and luminescence characteristics of erbium doped TNZL glass for lasing materials. J Alloy Comp. 2015;620:129. doi: 10.1016/j.jallcom.2014.09.120. [DOI] [Google Scholar]
- 40.Lei F, Yan B, Chen HH. Solid-state synthesis, characterization and luminescent properties of Eu3+−doped gadolinium tungstate and molybdate phosphors: Gd(2−x)MO6:Eux3+ (M=W, Mo) J Solid State Chem. 2008;181:2845. doi: 10.1016/j.jssc.2008.07.008. [DOI] [Google Scholar]
- 41.Yue T, Baojiu C, Ruinian H, Jiashi S, Lihong C, Haiyang Z, et al. Optical transition, electron–phonon coupling and fluorescent quenching of La2(MoO4)3:Eu3+ phosphor. J Appl Phys. 2011;109:3511. doi: 10.1063/1.3553933. [DOI] [Google Scholar]
- 42.Dejneka M, Snitzer E, Riman RE. Blue, green and red fluorescence and energy transfer of Eu3+ in fluoride glasses. J Lumin. 1995;65:227. doi: 10.1016/0022-2313(95)00073-9. [DOI] [Google Scholar]
- 43.Brito HF, Malta OL, de Carvalho CA A, Menezes JFS, Souza LR, Fenaz LR. Luminescence behavior of Eu with thenoyltrifluoroacetonate, sulfoxides and macrocyclics. J Alloy Comp. 1998;275–277:254. doi: 10.1016/S0925-8388(98)00315-6. [DOI] [Google Scholar]
- 44.Xiangping L, Baojiu C, Rensheng S, Haiyang Z, Lihong C, Jiashi S, et al. Fluorescence quenching of 5DJ (J = 1, 2 and 3) levels and Judd–Ofelt analysis of Eu3+ in NaGdTiO4 phosphors. J Phys D Appl Phys. 2011;33:5403. [Google Scholar]
- 45.Nichkova M, Dosev D, Perron R, Gee SJ, Hammock BD, Kennedy IM. Eu3+-doped Gd2O3 nanoparticles as reporters for optical detection and visualization of antibodies patterned by microcontact printing. Anal Bioanal Chem. 2006;384:631. doi: 10.1007/s00216-005-0246-8. [DOI] [PubMed] [Google Scholar]
- 46.Chen SC, Peron R, Dosev D, Kennedy IM. Time-gated detection of europium nanoparticles in a microchannel-based environmental immunoassay. SPIE Proc SPIE 5275, BioMEMS and Nanotechnology 2004, 186-196.
- 47.Weber MJ. Optical properties of ions in crystals. Edited by Crosswhite HM and Moos HW. New York: Wiley Interscience; 1976: 467–84.
- 48.Ribeiro SJL, Diniz REO, Messaddeq Y, Nunes LA, Aegerter MA. Eu3+ and Gd3+ spectroscopy in fluoroindate glasses. Chem Phys Lett. 1994;220:214. doi: 10.1016/0009-2614(94)00176-6. [DOI] [Google Scholar]
- 49.Liqin L, Xueyuan C. Energy levels, fluorescence lifetime and Judd–Ofelt parameters of Eu3+ in Gd2O3 nanocrystals. Nanotechnology. 2007;18:5704. [Google Scholar]
- 50.Chen X, Ma E, Liu G. Energy levels and optical spectroscopy of Er3+ in Gd2O3 nanocrystals. J Phys Chem C. 2007;111:10404–11. doi: 10.1021/jp072980g. [DOI] [Google Scholar]
- 51.Balda R, Fernandez J. Visible luminescence in KPb2Cl5:Pr3+ crystal. Phys Rev B. 1996;54:12076. doi: 10.1103/PhysRevB.54.12076. [DOI] [PubMed] [Google Scholar]
- 52.Zhao D, Qiao X, Fan X, Wang M. Local vibration around rare earth ions in SiO2–PbF2 glass and glass ceramics using Eu3+ probe. Phys B. 2007;395:10. doi: 10.1016/j.physb.2006.12.007. [DOI] [Google Scholar]
- 53.Li XJ, Pun EYB, Zhang YY, Lin H. Radiative transitions of Eu3+ in non-crystalline alkali–alkaline–titanate film. Phys B. 2008;403:3509. doi: 10.1016/j.physb.2008.05.017. [DOI] [Google Scholar]
- 54.Saleem SA, Jamalaiah BC, Mohan Babu A, Pavani K, Rama Moorthy L. A study on fluorescence properties of Eu3+ ions in alkali lead tellurofluoroborate glasses. J Rare Earth. 2010;28:189. doi: 10.1016/S1002-0721(09)60078-8. [DOI] [Google Scholar]
- 55.Babu P, Jayasankar CK. Optical spectroscopy of Eu3+ ions in lithium borate and lithium fluoroborate glasses. Phys B Condens Matter. 2000;279:262. doi: 10.1016/S0921-4526(99)00876-5. [DOI] [Google Scholar]
- 56.Grzyb T, Lis S. Structural and spectroscopic properties of LaOF:Eu3+ nanocrystals prepared by the sol gel Pechini method. Inorg Chem. 2011;50:8112. doi: 10.1021/ic2005453. [DOI] [PubMed] [Google Scholar]
- 57.Liu C, Liu J. Judd-Ofelt intensity parameters and spectral properties of Gd2O3:Eu3+ nanocrystals. J Phys Chem B. 2006;110(41):277–81. doi: 10.1021/jp063075j. [DOI] [PubMed] [Google Scholar]
- 58.Youssef ES, Damak K, Maalej R, Rüssel C. Thermal stability and UV–Vis-NIR spectroscopy of a new erbium-doped fluorotellurite glass. Phil Mag. 2012;92:899. doi: 10.1080/14786435.2011.634852. [DOI] [Google Scholar]


