

Abstract
Human precentral and postcentral cortical areas interact to generate sensorimotor functions. Recent imaging work suggests that pre- and postcentral cortical thicknesses of an individual vary over time-scales of years and decades due to aging, disease, and other factors. In contrast, there is little understanding of how thicknesses of these areas vary in an individual over time-scales of minutes and weeks. This study used longitudinal magnetic resonance imaging (MRI) and computational morphometry approaches in 5 healthy subjects to assess how mean thicknesses, and intra- and interhemispheric relationships in mean thicknesses, of these areas vary in an individual subject over minutes and weeks. Within each individual, absolute differences in thicknesses over these times were small and similar in the precentral (mean = 0.02–0.04 mm) and postcentral (mean = 0.03–0.05 mm) areas. Each individual also had a consistent intrahemispheric disparity and interhemispheric asymmetrical or symmetrical relationship in thicknesses of these areas over these times. The results provide new understanding of within-individual cortical thickness variability in these areas and raise the possibility that longitudinal thickness profiling can provide a baseline definition of short time-scale thickness variability that can be used to detect acute and subacute changes in pre- and postcentral thicknesses at an individual subject level.
Keywords: interhemispheric, intrahemispheric, longitudinal, magnetic resonance imaging, sensorimotor cortex
Introduction
Cortical thickness is a useful indicator of the structural integrity of a cortical area. Recognition that cortical structure is dynamic has prompted interest in how mean thicknesses of cortical areas longitudinally vary in an individual over different time-scales.
The postcentral and precentral areas are amongst the best understood of human cortical areas and are of interest for longitudinal studies. From adjacent locations around the central sulcus, they interact to contribute to somatosensory and motor functions. The map-like functional organization in each area is well recognized (Penfield and Rasmussen 1950), as is the concept that pre- and postcentral functional organization can change over minutes, weeks, and longer times due to injury, disease, or other factors (Wall et al. 2002; Lee et al. 2003; Weiss et al. 2004; Flor et al. 2006; Schaechter et al. 2006; Bjorkman et al. 2009). These areas differ cytoarchitectonically, and substantial information is available on their structure (Kaas 1990; Meyer et al. 1996; White et al. 1997; Rademacher et al. 2001; Zilles 2004). In addition, given their functional interaction, intrahemispheric and interhemispheric relationships of the structural properties of these areas have been of interest (Meyer et al. 1996; MacDonald et al. 2000; Mechelli et al. 2005; Lerch et al. 2006; Luders et al. 2006; Butman and Floeter 2007; Hamilton et al. 2007; He et al. 2007; Chen et al. 2008).
It is recognized that thicknesses of the pre- and postcentral areas change over long time-scales of years due to aging, disease, and other factors (Sailer et al. 2003; Chen et al. 2004; Lyoo et al. 2006; Rettmann et al. 2006; Schaechter et al. 2006; Shaw et al. 2006; Butman and Floeter 2007; DaSilva et al. 2007; Lu et al. 2007; Thompson et al. 2007; DaSilva et al. 2008; Sowell et al. 2008). In contrast, changes or variations in the mean thicknesses of the pre- and postcentral areas over shorter time-scales remain conjectural. Contributing to present uncertainty is the poorly understood issue of how mean thicknesses of these areas vary in a given individual over times of minutes and weeks. This issue is important for understanding short time-scale dynamics of normal ongoing thickness variations.
The present study used repeated MRI scans to define longitudinal profiles of the mean thicknesses, and intra- and interhemispheric relationships between mean thicknesses, of the post- and precentral gyrus areas in healthy individual subjects. Measures in each individual were compared across time-scales of minutes, when minimal variability might be expected, and across time-scales of weeks, when variability may increase due to different factors. We were interested in how thicknesses and intra- and interhemispheric relationships in thicknesses of these areas vary in an individual over acute and subacute time-scales.
Materials and Methods
Subjects and Imaging
The procedures were approved by the institutional review board. The study was designed to longitudinally profile cortical thickness in an individual subject over minutes and weeks. Given that 5–7 measures were made per individual, we focused on a sample of the first five subjects who met health criteria and were available for multiple scans (ages: 24, 24, 27, 36, and 55 years; female/male: 3/2). Each subject was documented to be in good health from responses to medical history questionnaires and had no history of head trauma, brain surgery, nervous system or psychiatric disorders, chronic medical conditions, or drug or alcohol abuse. The subjects were previously used in analyses of global mean thickness that assessed hemispheric thickness variability but that did not address thickness variability in specific cortical areas (Wang et al. 2008).
All images were obtained with the same 3T GE Signa scanner and T1-weighted Inversion Recovery Fast Spoiled Gradient Recall Echo imaging protocol (time echo = 3 ms; time to inversion = 650 ms; flip angle = 9°; bandwidth = 31.25 kHz; field of view = 256 mm; resolution = 1 × 1 × 1 mm; 164 continuous axial slices encompassing both hemispheres).
Pre- and Postcentral Mean Thickness Measures
Measurements of the mean thicknesses of the pre- and postcentral areas were done using automated FreeSurfer programs (http://surfer.nmr.mgh.harvard.edu/fswiki) on a Linux workstation. Intensity and continuity information from 3D magnetic resonance volumes was used to reconstruct the white/gray and pial boundaries of cortex and measure cortical thicknesses between these boundaries at individual vertices (Dale et al. 1999; Fischl, Sereno, Dale 1999; Fischl, Sereno, Tootell, et al. 1999; Fischl and Dale 2000; Han et al. 2006; Dickerson et al. 2008). These approaches determine cortical thickness measures to submillimeter resolution and have been shown to be valid and reliable (Fischl and Dale 2000; Rosas et al. 2002; Kuperberg et al. 2003; Salat et al. 2004; Han et al. 2006; DaSilva et al. 2007). The pre- and postcentral gyrus areas were defined with automated FreeSurfer parcellation procedures (Desikan et al. 2006). Thickness measures at vertices in the parcellated areas were used to determine mean thicknesses of the pre- and postcentral areas in both hemispheres from each scan in each subject.
Within-Individual Analyses of Pre- and Postcentral Mean Thicknesses over Time
To assess thickness variations over time-scales of minutes, each subject underwent two sets of paired scans, referred to as set 1 and set 2 scans. The pair of set 1 scans was taken within a period of about 30 min with removal from the scanner between scans, whereas the pair of set 2 scans was taken within a similar time but without intervening removal from the scanner. To assess thicknesses over time-scales of weeks, set 1 and set 2 scans were separated by 3–4 weeks. In addition, each subject underwent 1–3 further scans that were separated from that subject's set 1 scans by times of up to 32 weeks. Thus, 2 independent estimates of variability over minutes and 3–5 independent estimates of variability over weeks were used to define thickness profiles in each individual (Fig. 1).
Figure 1.
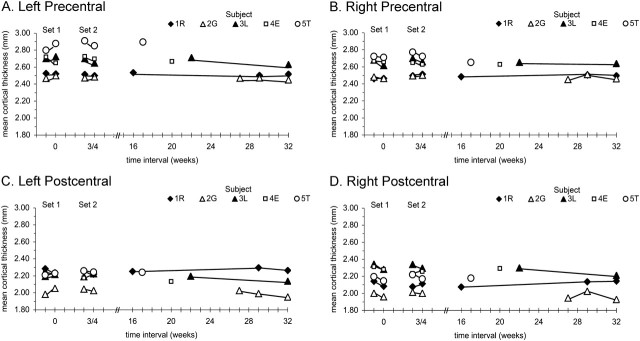
Measures of mean thicknesses of the left and right pre- and postcentral areas for all scans (n = 30) from each subject plotted as a function of the time between measures. In set 1 and set 2, pairs of test– retest measures were made in each individual within minutes of each other. Set 2 measures were made 3–4 weeks from set 1, and 1–3 further measures were made in each individual at intervals of 16–32 weeks.
Within-individual variations in the mean thicknesses of each area were expressed as absolute differences (in millimeters) between mean thickness measures that were taken at minute or week intervals.
To assess within-individual variations over minutes, the absolute difference between mean thicknesses for the second and first scans in set 1 was calculated in each subject using the first scan as the reference (second − first scan). The mean and range of these within-individual differences were also determined. Similar calculations were done for the pairs of set 2 scans to provide second estimates of absolute thickness variability over minutes in each individual.
To assess within-individual variability over weeks, each subject's first scan in set 1 was again used as a reference and absolute thickness differences were calculated for each of the week-interval scans and this reference. In each subject, this provided 2 difference measures at 3–4 weeks (one measure for each set 2 scan) and 1–3 further measures over periods of 16–32 weeks. These differences were also compared with absolute thickness differences seen over minutes in set 1, which used the same first scan as a reference (and also involved removal from the scanner between scans).
Within-Individual Relationships of Pre- and Postcentral Mean Thicknesses over Time
Intrahemispheric relationships of the mean thicknesses of pre- and postcentral areas from the same hemisphere were assessed with a “precentral/postcentral” index ([{mean precentral/mean postcentral} × 100] − 100) that was calculated on each side for each scan of each individual. A positive index indicated the percent by which the precentral thickness was greater, a negative index indicated the percent by which the postcentral thickness was greater, and 0 indicated equal thicknesses.
Interhemispheric relationships of the mean thicknesses of pre- and postcentral areas in opposite hemispheres were assessed with a “symmetry” index ([left − right/right] × 100) that was calculated for each area of each scan in each individual. A positive index indicated the percent by which the left side thickness was greater, a negative index indicated the percent by which the right side thickness was greater, and 0 indicated equal thicknesses.
Statistical Tests
Thickness data were exported from FreeSurfer to Excel and Adobe Photoshop for analyses and construction of illustrations. Statistical analyses were performed with SPSS programs. Intraclass correlation coefficients (ICCs) with 95% confidence intervals (CIs) were used to evaluate within-individual consistency of thicknesses and thickness relationship indices over time. High ICCs indicate that within-individual differences over time were small and consistent compared with between-individual differences. Repeated measures analyses of variance (ANOVAs; P < 0.05) were used to test for within-individual differences in thicknesses and thickness relationships over time. Individual subjects each had 5–7 scans. ICCs and ANOVAs were done using data from 5 comparable scans in each subject: 1) first scan of set 1 as a reference scan, 2) second scan of set 1 to represent a test–retest interval of minutes from (1), 3) first scan of set 2 and 4) second scan of set 2, which were used to represent test–retest intervals of both minutes from each other and 3–4 weeks from (1), and 5) longest scan interval from (1) to represent the longest test–retest time (17–32 weeks).
Results
Mean pre- and postcentral thicknesses in each hemisphere were charted as a function of the time interval between scans to provide temporal profiles in each individual (Fig. 1). These profiles reflected the following within-individual variability.
Within-Individual Thickness Variability over Minutes
Within-individual variations in pre- and postcentral mean thicknesses over time-scales of minutes were assessed from set 1 and set 2 pairs of scans (Fig. 1).
Precentral
In the left precentral area, pairs of thickness measures from sets 1 and 2 had high ICCs (set 1 = 0.970, CI: 0.780–0.997; set 2 = 0.986, CI: 0.895–0.998), indicating high consistency in within-individual thicknesses in each set. Further reflecting this consistency, for set 1 and set 2 pairs, within-individual mean absolute thickness differences were, respectively, 0.04 mm (range: 0.01–0.08) and 0.03 mm (range: 0.01–0.06) (Fig. 2A ). In the right precentral area, ICCs for paired set 1 and set 2 thickness measures were also high (set 1 = 0.983, CI: 0.873–0.998; set 2 = 0.979, CI: 0.848–0.998). Reflecting this consistency, within-individual mean absolute thickness differences for set 1 and set 2 pairs were, respectively, 0.02 mm (range: 0–0.06) and 0.03 mm (range: 0.01–0.05) (Fig. 2B ).
Figure 2.

Means and ranges of within-individual absolute thickness variations (in millimeters) for measures taken minutes apart in set 1 and set 2 tests: (A) left precentral, (B) right precentral, (C) left postcentral, and (D) right postcentral. Within-individual mean absolute thickness variations over minutes were ≤0.05 mm in each area.
Postcentral
In the left postcentral area, ICCs for paired set 1 and set 2 thickness measures were high (set 1 = 0.952, CI: 0.644–0.995; set 2 = 0.955, CI: 0.667–0.995), indicating high consistency in within-individual measures in each set. Reflecting this consistency, within-individual mean absolute thickness differences for set 1 and set 2 pairs were, respectively, 0.04 mm (range: 0.02–0.07) and 0.03 mm (range: 0.02–0.06) (Fig. 2C ). In the right postcentral area, ICCs were also high (set 1 = 0.968, CI: 0.760–0.997; set 2 = 0.979, CI: 0.848–0.998). Reflecting this, within-individual mean absolute thickness differences for set 1 and set 2 pairs were, respectively, 0.05 mm (range: 0.03–0.06) and 0.03 mm (range: 0.01–0.05) (Fig. 2D ).
The above results indicate that precentral and postcentral mean thicknesses in each individual had high consistency and low variability over minutes.
Within-Individual Thickness Variability over Weeks
Within-individual mean thickness variability was next assessed for time-scales of weeks and compared with the above variability over minutes.
Precentral
Left precentral mean thicknesses across the 5 tested scan times (see Materials and Methods) had a high ICC (0.992; CI: 0.969–0.999), and an ANOVA-indicated within-individual thicknesses did not significantly differ across these times (P = 0.487). Reflecting this consistency, the within-individual mean absolute thickness difference for all week-interval scans was 0.03 mm. Finally, further comparisons of thickness differences over weeks and minutes indicated that almost all (18/20) absolute thickness differences at week intervals were less than the maximal absolute thickness difference for measures taken at minute intervals (compare Fig. 3A and set 1 in Fig. 2A ). Right precentral mean thicknesses across the 5 tested times had a high ICC (0.990; CI: 0.963–0.999). An ANOVA-indicated within-individual thicknesses were marginally significantly different across these times (P = 0.043). However, this result was not confirmed by post hoc comparisons that indicated within-individual thicknesses of scan 1 did not significantly differ from thicknesses of 1) scan 2 that tested minute intervals (P = 0.148), 2) scan 3 or 4 that provided 2 tests at 3- to 4-week intervals (scan 3, P = 0.149; scan 4, P = 0.887), or 3) scan 5 that tested each individual's longest week interval (P = 0.204). The within-individual mean absolute thickness difference for all week-interval scans was 0.03 mm. Finally, further comparisons of thickness differences over weeks and minutes indicated that almost all (19/20) absolute thickness differences at week intervals were less than the maximal absolute thickness difference for measures taken at minute intervals (compare Fig. 3B and set 1 in Fig. 2B ).
Figure 3.

Within-individual variations in absolute thickness for all measures taken at intervals of weeks for (A) left precentral, (B) right precentral, (C) left postcentral, and (D) right postcentral areas. In (A), one measure for subject 2G is hidden by the initial data point for subject 4E. In each area and hemisphere, the large majority of variations over weeks were less than maximal variations over minutes (see Results).
Postcentral
Left postcentral mean thicknesses across the 5 tested times had a high ICC (0.977; CI: 0.915–0.997), and an ANOVA-indicated within-individual thicknesses were not significantly different across these times (P = 0.223). The within-individual mean absolute thickness difference for all week-interval scans was 0.04 mm. Further comparisons of thickness differences over weeks and minutes indicated that almost all (19/20) absolute thickness differences at week intervals were less than the maximal absolute thickness difference for measures taken at minute intervals (compare Fig. 3C and set 1 in Fig. 2C ). Right postcentral mean thicknesses across the 5 tested times had a high ICC (0.986; CI: 0.946–0.998), and an ANOVA-indicated within-individual thicknesses did not significantly differ across these times (P = 0.202). The within-individual mean absolute thickness difference for all week-interval scans was 0.04 mm, and the majority (15/20) of absolute thickness differences at week intervals were less than the maximal absolute thickness difference for measures taken at minute intervals in set 1 (compare Fig. 3D and set 1 in Fig. 2D ).
The above results indicate that within-individual pre- and postcentral mean thickness measures showed high consistency, low variability, and did not statistically differ over time-scales of weeks and minutes.
Within-Individual Intrahemispheric Relationships over Time
Precentral/postcentral indices (see Materials and Methods) in each hemisphere were positive at all times in each individual (Fig. 4). Index magnitudes ranged from a low of 9% (Fig. 4A , subject 1R) to a high of 29% (Fig. 4A , subject 5T). Over the 5 tested times, indices on each side had high ICCs (left: 0.984, CI: 0.941–0.998; right: 0.970, CI: 0.886–0.996), and ANOVAs indicated no significant within-individual differences over time (left: P = 0.259; right: P = 0.404). Thus, mean precentral thicknesses were greater than mean postcentral thicknesses and a consistent intrahemispheric disparity in these thicknesses was maintained over minutes and weeks in each individual.
Figure 4.

Within-individual variation in “precentral/postcentral” indices that assessed the relationship of pre- and postcentral thicknesses in the same hemisphere. Scans 1 and 2 are from set 1, scans 3 and 4 are from set 2, and scans 5–7 are longer interval scans. In left (A) and right (B) hemispheres in each subject (1R–5T), the precentral area was thicker than the postcentral area and the disparity in thickness was individual specific and consistent over time.
Within-Individual Interhemispheric Relationships over Time
Precentral
Analyses of symmetry indices (see Materials and Methods) indicated that each individual had a consistent asymmetric or nearly symmetric precentral interhemispheric relationship over minutes and weeks (Fig. 5A ). Symmetry indices in one individual were all positive, indicating greater left mean thickness (Fig. 5A , subject 5T), whereas every other individual had mixed small positive and negative indices, indicating small variations around symmetry (Fig. 5A , subjects 1R, 2G, 3L, and 4E).
Figure 5.

Within-individual variation in “symmetry” indices of the left versus right precentral (A) and postcentral (B) areas. For the precentral area, the within-individual index over time was consistently positive (subject 5T), indicating a larger thickness on the left side, or was mixed small positive and negative (subjects 1R, 2G, 3L, and 4E), suggesting a consistent small variation around a symmetrical relationship. For the postcentral area, the within-individual indices over time were consistently positive (1R, 5T) or negative (3L, 4E), indicating a larger thickness on the respective left and right sides, or were mixed small positive and negative (2G), suggesting a consistent small variation around a symmetrical relationship. Within each subject, the symmetry arrangements of the pre- and postcentral areas, when considered together, consistently matched (5T, 2G) or differed (1R, 3L, 4E) over time (see Results). Scans as described in Figure 4. Subjects 1R, 2G, 3L, and 4E were right handed and subject 5T was left handed (Edinburgh handedness inventory).
Postcentral
Analogous postcentral analyses indicated that interhemispheric symmetry indices in 2 individuals were all positive, reflecting a greater left mean thickness (Fig. 5B , subjects 1R and 5T). Indices in 2 individuals were all negative, indicating a consistently thicker right side (Fig. 5B , subjects 3L and 4E), and indices in 1 individual were mixed small positive and negative, indicating variations around symmetry (Fig. 5B , subject 2G).
Consideration of the interhemispheric symmetry indices of both areas in an individual indicates that symmetry arrangements could match or differ. For example, precentral and postcentral indices in one individual were consistently positive, indicating mean thicknesses were consistently larger on the left in both areas (Fig. 5, subject 5T). In another individual, both the pre- and postcentral indices over time were a mix of small positive and negative indices, indicating small variations around symmetrical mean thicknesses in both areas (Fig. 5, subject 2G). Other individuals had consistently asymmetric postcentral indices but did not have matching asymmetric precentral indices (Fig. 5, subjects 1R, 3L, and 4E). Thus, precentral interhemispheric relationships in mean thickness matched or differed from postcentral interhemispheric relationships. Matching or different arrangements were individual specific and consistent over minutes and weeks.
Discussion
Longitudinal Pre- and Postcentral Thickness Variability
This study represents the first attempt to profile pre- and postcentral mean thicknesses in individual subjects over time-scales of minutes and weeks. Based on 5–7 longitudinal measures per subject, within-individual absolute thickness differences over minutes and weeks were small and similar in the precentral (mean = 0.02–0.04 mm) and postcentral (mean = 0.03–0.05 mm) areas. Cortical thickness encompasses the size, density, and arrangement of cells (neurons, glia), neuropil, vasculature, and the associated blood volume and is a useful structural marker. The low variability in the thickness profiles may reflect within-individual consistency that is related to maintenance of somatosensory and motor functions of these areas in a healthy individual.
Structural properties of these areas have been widely studied. Previous MRI studies have reported postcentral thicknesses of 1.34–3.58 mm and precentral thicknesses of 2.03–3.67 mm (Meyer et al. 1996; Fischl and Dale 2000; Jones et al. 2000; MacDonald et al. 2000; Kuperberg et al. 2003; Sailer et al. 2003; Chen et al. 2004; Lyoo et al. 2006; Makris et al. 2006; Butman and Floeter 2007; Calabrese et al. 2007; Nesvag et al. 2008; Park et al. 2008). The present mean thicknesses are consistent with these findings. Earlier assessments were taken at one time and provide insight into normal interindividual variability but do not address variability in an individual over time.
Previous work has examined cortical thickness over minutes, days, or weeks (Sowell et al. 2004; Lerch and Evans 2005; Haldar and Soul 2006; Han et al. 2006; Hutton et al. 2008; Wang et al. 2008) but has not defined thickness profiles, or compared mean thickness variability over minutes and weeks, in an individual. For example, one study took thickness measures at minute intervals in 2 individuals and at a 3-week interval in 1 individual (Sowell et al. 2004). Maps indicating thickness differences over time included pre- and postcentral sites, but data were averaged across all 3 individuals and did not compare thickness across minute and week intervals in an individual. Another study examined thicknesses at cortical sites, including pre- and postcentral sites, at a 2-week interval (Han et al. 2006). Initial analyses that used an 1.5T scanner and averaged group data from two scans at each time led to difference maps that showed large test–retest thickness differences at medial precentral sites and smaller differences across lateral precentral and postcentral sites. In further analyses that used the same scanner and group data from one scan at each time, the large medial precentral thickness differences seen in the prior analyses were not apparent. It is difficult to relate these analyses to the present data; in addition, the group analysis design did not distinguish thickness profiles of individual subjects over time. Another study assessed thicknesses of sites around the central sulcus at a 2-day interval in 1 individual (Hutton et al. 2008). Six scans were taken using a 3T scanner the first day, 6 scans were taken using a 1.5T scanner the second day, and averages of the thicknesses of the 6 scans from each day were compared. High variability was reported across days at sites around the central sulcus; however, this was likely attributable to the use of different scanners. In summary, while addressing other issues, existing work does not address how mean pre- and postcentral thicknesses vary over minutes and weeks in an individual. The present findings provide new insight into this issue.
In the present study, within-individual variability over minutes could be due to subject, scanner, image and data processing, or other factors. Although variability over weeks could involve potentially different factors that might become effective over longer times, within-individual mean thicknesses did not significantly differ over minutes and weeks. These results raise the provocative possibility that the thickness profile of an individual over minutes and weeks may provide a useful baseline for assessing acute and subacute time-scale thickness changes in that individual. More specifically, the high ICCs, lack of statistically significant differences, and similar small absolute thickness variations that characterized within-individual profiles over minutes and weeks raise the possibility that baseline variability can be sufficiently low that thickness change trends may be identifiable from changes in trajectory parameters of that individual's thickness profile. Given limitations of existing data on thickness variations over these time-scales (see above), it is not surprising that this possibility has received little recognition. Thickness change trends at the individual level might be envisioned, for example, by extending the thickness profiles of any of the individuals in the present study (Fig. 1) with some intervention and by subsequent emergence of thickness differences or changes in thickness variability over the next days, weeks, or longer that are demonstrably distinct from that individual's preintervention measures. Given that the present sample is focused on thickness profiles of 5 subjects, it is possible that other individuals have pre- and postcentral profiles that are less consistent than the profiles of the present subjects. However, this would not rule out longitudinal analyses in individuals who, like the present subjects, have a consistent starting profile.
Assessment of trajectories of cortical thickness over time has been used to examine changes over years (Thompson et al. 2007; Shaw et al. 2008). To our knowledge, this concept has not been applied to the pre- and postcentral areas at the individual subject level for time-scales of minutes and weeks. Two reasons may explain this. First, presumptions that these time-scales are too short for macroscopic cortical structural changes may have curtailed interest in this direction. However, recent MRI studies in adults have identified group-level changes in gray density or volume in pre- or postcentral and other cortical areas over periods of several days or weeks that were due to different interventions (Draganski et al. 2004; Leow et al. 2005; Levy 2007; May et al. 2007; Gauthier et al. 2008; Teutsch et al. 2008). For example, macroscopic structural changes in cortical gray density in groups of healthy adults have been reported in the postcentral area following several days of noxious stimulation (Teutsch et al. 2008) and in other cortical areas following 2 weeks of specialized reading (Ilg et al. 2008) and following 3 months of juggling (Draganski et al. 2004) or preparation for medical exams (Draganski et al. 2006). Changes in cortical density/volume can be related to changes in cortical thickness (Narr et al. 2005), thus raising the possibility for similar time-scale changes in thickness. Second, the lack of data on within-individual pre- and postcentral thickness profiles over minutes to weeks (see above) has made it difficult to know if mean thickness variability in an individual over these times is too large to permit analysis at an individual level. The present findings provide initial “proof-of-concept” evidence for the possibility of detecting acute and subacute thickness changes in individuals, like those in this study, who have low variability profiles. This possibility is interesting in view of clinical goals to develop practical approaches that can use short intervals and small samples to assess cortical structural changes that may be useful targets for diagnosis or treatment of individual patients.
Longitudinal Intrahemispheric Relationships
No previous studies have assessed intrahemispheric relationships of pre- and postcentral mean thicknesses in an individual over minutes and weeks. Within each hemisphere, precentral mean thickness was larger than postcentral mean thickness and each individual's specific thickness disparity was consistently maintained over these times.
The present results agree with earlier findings that precentral thickness is normally greater than postcentral thickness in the same hemisphere (Meyer et al. 1996; MacDonald et al. 2000; Butman and Floeter 2007). Earlier measures, taken at one time, do not indicate how thickness relationships vary in an individual over time.
Human pre- and postcentral areas interact to generate somatosensory and motor functions (Nii et al. 1996; Moore et al. 2000; Rademacher et al. 2001; Dechent and Frahm 2003; Guye et al. 2003; Towle et al. 2003; Liepert et al. 2004; Overduin and Servos 2004; Duncan and Boynton 2007; Chen et al. 2008). Maintenance of normal functions presumably requires some degree of structural consistency that might be reflected in the pre- and postcentral thickness relationship. However, cortical structure is also dynamic and thicknesses and other structural properties of interacting cortical areas vary due to genetic, trophic, and/or experience-related factors (Mechelli et al. 2005; Lerch et al. 2006; He et al. 2007). The present analyses provide evidence for within-individual capacities to maintain a consistent intrahemispheric thickness relationship over weeks and prompt questions about how this relationship may vary due to factors that may have different structural effects on each area.
Longitudinal Interhemispheric Relationships
The results suggest that a consistent asymmetrical or nearly symmetrical interhemispheric relationship was maintained over weeks in each area of each individual. In addition, the precentral interhemispheric relationship matched or differed from that individual's postcentral interhemispheric relationship in a consistent way over weeks.
Previous pre- and postcentral work on interhemispheric structural relationships focuses on central sulcus lengths and post- or precentral gyral shapes, densities, or volumes (White et al. 1994; Zilles et al. 1996; Foundas et al. 1998; Amunts et al. 2000; Good et al. 2001; Rademacher et al. 2001; Watkins et al. 2001; Davatzikos and Bryan 2002; Jung et al. 2003; Mangin et al. 2004; Herve et al. 2006; Caulo et al. 2007). Fewer data are available on thickness relationships. Precentral asymmetry involving greater left side thickness has been reported in right-handed groups, but this appeared less pronounced in non–right-handed and female groups (Luders et al. 2006; Hamilton et al. 2007). A further study found no significant interhemispheric differences in pre- and postcentral thicknesses (Meyer et al. 1996). The present results are consistent with the findings that interhemispheric thickness relationships can be asymmetrical or symmetrical and further indicate that specific relationships can be maintained over weeks in an individual.
Conclusions
There is little understanding of how thicknesses of cortical areas in an individual vary over time-scales of minutes and weeks. The present results suggest that thicknesses of the pre- and postcentral areas and intra- and interhemispheric relationships in thicknesses of these areas can be maintained with low variability in some healthy individuals over these times. These findings provide proof-of-concept evidence for the future possibility of using longitudinal scans to detect acute and subacute pre- and postcentral thickness changes in individual subjects.
Funding
Translational Research Stimulation Award from the University of Toledo.
Acknowledgments
We are grateful for the support of the Department of Radiology at the University of Toledo Medical Center. We thank the subjects who gave their time and Kathy Sbrocchi, Cindy Grey, and Sue Yeager for their technical expertise. We would also like to acknowledge the contributions of Nicolas Chiaia, Richard Lane, and Peter Bazeley to this work. Conflict of Interest: None declared.
References
- Amunts K, Jancke L, Mohlberg H, Steinmetz H, Zilles K. Interhemispheric asymmetry of the human motor cortex related to handedness and gender. Neuropsychologia. 2000;38:304–312. doi: 10.1016/s0028-3932(99)00075-5. [DOI] [PubMed] [Google Scholar]
- Bjorkman A, Weibull A, Rosen B, Svensson J, Lundborg G. Rapid cortical reorganization and improved sensitivity of the hand following cutaneous anaesthesia of the forearm. Eur J Neurosci. 2009;29:837–844. doi: 10.1111/j.1460-9568.2009.06629.x. [DOI] [PubMed] [Google Scholar]
- Butman JA, Floeter MK. Decreased thickness of primary motor cortex in primary lateral sclerosis. Am J Neuroradiol. 2007;28:87–91. [PMC free article] [PubMed] [Google Scholar]
- Calabrese M, Atzori M, Bernardi V, Morra A, Romualdi C, Rinaldi L, McAuliffe MJM, Barachino L, Perini P, Fischl B, et al. Cortical atrophy is relevant in multiple sclerosis at clinical onset. J Neurol. 2007;254:1212–1220. doi: 10.1007/s00415-006-0503-6. [DOI] [PubMed] [Google Scholar]
- Caulo M, Briganti C, Mattei PA, Perfetti B, Ferretti A, Romani GL, Tartaro A, Colosimo C. New morphologic variants of the hand motor cortex as seen with MR imaging in a large study population. Am J Neuroradiol. 2007;28:1480–1485. doi: 10.3174/ajnr.A0597. [DOI] [PMC free article] [PubMed] [Google Scholar]
- Chen JT, Narayanan S, Collins DL, Smith SM, Matthews PM, Arnold DL. Relating neocortical pathology to disability progression in multiple sclerosis using MRI. Neuroimage. 2004;23:1168–1175. doi: 10.1016/j.neuroimage.2004.07.046. [DOI] [PubMed] [Google Scholar]
- Chen ZJ, He H, Rosa-Neto P, Germann J, Evans AC. Revealing modular architecture of human brain structural networks by using cortical thickness from MRI. Cereb Cortex. 2008;18:2374–2381. doi: 10.1093/cercor/bhn003. [DOI] [PMC free article] [PubMed] [Google Scholar]
- Dale AM, Fischl B, Sereno Ml. Cortical surface-based analyses. I. Segmentation and surface reconstruction. Neuroimage. 1999;9:179–194. doi: 10.1006/nimg.1998.0395. [DOI] [PubMed] [Google Scholar]
- DaSilva AF, Becerra L, Pendse G, Chizh B, Tully S, Borsook D. Colocalized structural and functional changes in the cortex of patients with trigeminal neuropathic pain. PLoS One. 2008;3:e3396. doi: 10.1371/journal.pone.0003396. [DOI] [PMC free article] [PubMed] [Google Scholar]
- DaSilva AFM, Granziera C, Snyder J, Hadjikhani N. Thickening in the somatosensory cortex of patients with migraine. Neurology. 2007;69:1990–1995. doi: 10.1212/01.wnl.0000291618.32247.2d. [DOI] [PMC free article] [PubMed] [Google Scholar]
- Davatzikos C, Bryan RN. Morphometric analysis of cortical sulci using parametric ribbons: a study of the central sulcus. J Comput Assist Tomogr. 2002;26:298–307. doi: 10.1097/00004728-200203000-00024. [DOI] [PubMed] [Google Scholar]
- Dechent P, Frahm J. Functional somatotopy of finger representations in human primary motor cortex. Hum Brain Mapp. 2003;18:272–283. doi: 10.1002/hbm.10084. [DOI] [PMC free article] [PubMed] [Google Scholar]
- Desikan RS, Segonne F, Fischl B, Quinn BT, Dickerson BC, Blacker D, Buckner RL, Dale AM, Maquire RP, Hyman BT, et al. An automated labeling system for subdividing the human cerebral cortex on MRI scans into gyral based regions of interest. Neuroimage. 2006;31:968–980. doi: 10.1016/j.neuroimage.2006.01.021. [DOI] [PubMed] [Google Scholar]
- Dickerson BC, Fenstermacher E, Salat DH, Wolk DA, Maguire RP, Desikan RS, Pacheco J, Quinn BT, Van der Kouwe A, Greve DN, et al. Detection of cortical thickness correlates of cognitive performance: reliability across MRI scan sessions, scanners, and field strengths. Neuroimage. 2008;39:10–18. doi: 10.1016/j.neuroimage.2007.08.042. [DOI] [PMC free article] [PubMed] [Google Scholar]
- Draganski B, Gaser C, Busch V, Schuierer G, Bogdahn U, May A. Changes in grey matter induced by training. Nature. 2004;427:311–312. doi: 10.1038/427311a. [DOI] [PubMed] [Google Scholar]
- Draganski B, Gaser C, Kempermann G, Kuhn HG, Winkler J, Buchel C, May A. Temporal and spatial dynamics of brain structure changes during extensive learning. J Neurosci. 2006;26:6314–6317. doi: 10.1523/JNEUROSCI.4628-05.2006. [DOI] [PMC free article] [PubMed] [Google Scholar]
- Duncan RO, Boynton GM. Tactile hyperacuity thresholds correlate with finger maps in primary somatosensory cortex (S1) Cereb Cortex. 2007;17:2878–2891. doi: 10.1093/cercor/bhm015. [DOI] [PubMed] [Google Scholar]
- Fischl B, Dale AM. Measuring the thickness of the human cerebral cortex from magnetic resonance images. Proc Natl Acad Sci USA. 2000;97:11050–11055. doi: 10.1073/pnas.200033797. [DOI] [PMC free article] [PubMed] [Google Scholar]
- Fischl B, Sereno MI, Dale AM. Cortical surface-based analysis: II. Inflation, flattening, and a surface-based coordinate system. Neuroimage. 1999;9:195–207. doi: 10.1006/nimg.1998.0396. [DOI] [PubMed] [Google Scholar]
- Fischl B, Sereno MI, Tootell RBH, Dale AM. High-resolution intersubject averaging and a coordinate system for the cortical surface. Hum Brain Mapp. 1999;8:272–284. doi: 10.1002/(SICI)1097-0193(1999)8:4<272::AID-HBM10>3.0.CO;2-4. [DOI] [PMC free article] [PubMed] [Google Scholar]
- Flor H, Nikolajsen L, Jensen TS. Phantom limb pain: a case of maladaptive CNS plasticity? Nat Rev Neurosci. 2006;7:873–881. doi: 10.1038/nrn1991. [DOI] [PubMed] [Google Scholar]
- Foundas AL, Hong K, Leonard CM, Heilman KM. Hand preference and magnetic resonance imaging asymmetries of the central sulcus. Neuropsychiatry Neuropsychol Behav Neurol. 1998;11:65–71. [PubMed] [Google Scholar]
- Gauthier LV, Taub E, Perkins C, Ortmann M, Mark VW, Uswatte G. Remodeling the brain: plastic structural brain changes produced by different motor therapies after stroke. Stroke. 2008;39:1520–1525. doi: 10.1161/STROKEAHA.107.502229. [DOI] [PMC free article] [PubMed] [Google Scholar]
- Good CD, Johnsrude I, Ashburner J, Henson RNA, Friston KJ, Frackowiak RSJ. Cerebral asymmetry and the effects of sex and handedness on brain structure: a voxel-based morphometric analysis of 465 normal adult human brains. Neuroimage. 2001;14:685–700. doi: 10.1006/nimg.2001.0857. [DOI] [PubMed] [Google Scholar]
- Guye M, Parker GJM, Symms M, Boulby P, Wheeler-Kingshott CAM, Salek-Haddadi A, Barker GJ, Duncan JS. Combined functional MRI and tractography to demonstrate the connectivity of the human primary motor cortex in vivo. Neuroimage. 2003;19:1349–1360. doi: 10.1016/s1053-8119(03)00165-4. [DOI] [PubMed] [Google Scholar]
- Haldar H, Soul JS. Measurement of cortical thickness in 3D brain MRI data: validation of the Laplacian method. J Neuroimaging. 2006;16:146–153. doi: 10.1111/j.1552-6569.2006.00036.x. [DOI] [PubMed] [Google Scholar]
- Hamilton LS, Narr KL, Luders E, Szeszko PR, Thompson PM, Bilder RM, Toga AW. Asymmetries of cortical thickness: effects of handedness, sex, and schizophrenia. Neuroreport. 2007;18:1427–1431. doi: 10.1097/WNR.0b013e3282e9a5a2. [DOI] [PMC free article] [PubMed] [Google Scholar]
- Han X, Jovicich J, Salat DH, Van der Kouwe A, Quinn B, Czanner S, Busa E, Pacheco J, Albert M, Killiany R, et al. Reliability of MRI-derived measurements of human cerebral cortical thickness: the effects of field strength, scanner upgrade and manufacturer. Neuroimage. 2006;32:180–194. doi: 10.1016/j.neuroimage.2006.02.051. [DOI] [PubMed] [Google Scholar]
- He Y, Chen ZJ, Evans AC. Small-world anatomical networks in the human brain revealed by cortical thickness from MRI. Cereb Cortex. 2007;17:2407–2419. doi: 10.1093/cercor/bhl149. [DOI] [PubMed] [Google Scholar]
- Herve P-Y, Crivello F, Perchey G, Mazoyer B, Tzourio-Mazoyer N. Handedness and cerebral anatomical asymmetries in young adult males. Neuroimage. 2006;29:1066–1079. doi: 10.1016/j.neuroimage.2005.08.031. [DOI] [PubMed] [Google Scholar]
- Hutton C, De Vita E, Ashburner J, Deichmann R, Turner R. Voxel-based cortical thickness measurements in MRI. Neuroimage. 2008;40:1701–1710. doi: 10.1016/j.neuroimage.2008.01.027. [DOI] [PMC free article] [PubMed] [Google Scholar]
- Ilg R, Wohlschlager AM, Gaser C, Liebau Y, Dauner R, Woller A, Zimmer C, Zihl J, Muhlau M. Gray matter increase induced by practice correlates with task-specific activation: a combined functional and morphometric magnetic resonance imaging study. J Neurosci. 2008;28:4210–4215. doi: 10.1523/JNEUROSCI.5722-07.2008. [DOI] [PMC free article] [PubMed] [Google Scholar]
- Jones SE, Buchbinder BR, Aharon I. Three-dimensional mapping of cortical thickness using Laplace's equation. Hum Brain Mapp. 2000;11:12–32. doi: 10.1002/1097-0193(200009)11:1<12::AID-HBM20>3.0.CO;2-K. [DOI] [PMC free article] [PubMed] [Google Scholar]
- Jung P, Baumgartner U, Bauermann T, Magerl W, Gawehn J, Stoeter P, Treede RD. Asymmetry in the human primary somatosensory cortex and handedness. Neuroimage. 2003;19:913–923. doi: 10.1016/s1053-8119(03)00164-2. [DOI] [PubMed] [Google Scholar]
- Kaas JH. Somatosensory system. In: Paxinos G, editor. The human nervous system. New York: Academic Press; 1990. pp. 813–844. [Google Scholar]
- Kuperberg GR, Broome MR, McGuire PK, David AS, Eddy M, Ozawa F, Goff D, West WC, Williams SCR, van der Kouwe A, et al. Regionally localized thinning of the cerebral cortex in schizophrenia. Arch Gen Psychiatry. 2003;60:878–888. doi: 10.1001/archpsyc.60.9.878. [DOI] [PubMed] [Google Scholar]
- Lee L, Siebner HR, Rowe JB, Rizzo V, Rothwell JC, Frackowiak RSJ, Friston KJ. Acute remapping within the motor system induced by low-frequency repetitive transcranial magnetic stimulation. J Neurosci. 2003;23:5308–5318. doi: 10.1523/JNEUROSCI.23-12-05308.2003. [DOI] [PMC free article] [PubMed] [Google Scholar]
- Leow AD, Thompson PM, Hayashi KM, Bearden C, Nicoletti MA, Monkul SE, Sassi RB, Brambilla P, Mallinger AG, Soares J. Effects of lithium treatment on human brain structure mapped using longitudinal MRI. Neuropsychopharmacology. 2005;30:S227–S227. [Google Scholar]
- Lerch JP, Evans AC. Cortical thickness analysis examined through power analysis and a population simulation. Neuroimage. 2005;24:163–173. doi: 10.1016/j.neuroimage.2004.07.045. [DOI] [PubMed] [Google Scholar]
- Lerch JP, Worsley K, Shaw WP, Greenstein DK, Lenroot RK, Giedd J, Evans AC. Mapping anatomical correlations across cerebral cortex (MACACC) using cortical thickness from MRI. Neuroimage. 2006;31:993–1003. doi: 10.1016/j.neuroimage.2006.01.042. [DOI] [PubMed] [Google Scholar]
- Levy LM. Inducing brain growth by pure thought: can learning and practice change the structure of cortex? Am J Neuroradiol. 2007;28:1836–1837. doi: 10.3174/ajnr.A0724. [DOI] [PMC free article] [PubMed] [Google Scholar]
- Liepert J, Hamzei F, Weiller C. Lesion-induced and training-induced brain reorganization. Restor Neurol Neurosci. 2004;22:269–277. [PubMed] [Google Scholar]
- Lu LH, Leonard CM, Thompson PM, Kan E, Jolley J, Welcome SE, Toga AW, Sowell ER. Normal developmental changes in inferior frontal gray matter are associated with improvement in phonological processing: a longitudinal MRI analysis. Cereb Cortex. 2007;17:1092–1099. doi: 10.1093/cercor/bhl019. [DOI] [PubMed] [Google Scholar]
- Luders E, Narr KL, Thompson PM, Rex DE, Janke L, Toga AW. Hemispheric asymmetries in cortical thickness. Cereb Cortex. 2006;16:1232–1238. doi: 10.1093/cercor/bhj064. [DOI] [PubMed] [Google Scholar]
- Lyoo IK, Sung YH, Dager SR, Friedman SD, Lee J-Y, Kim SJ, Kim N, Dunner DL, Renshaw PF. Regional cerebral cortical thinning in bipolar disorder. Bipolar Disord. 2006;8:65–74. doi: 10.1111/j.1399-5618.2006.00284.x. [DOI] [PubMed] [Google Scholar]
- MacDonald D, Kabani N, Avis D, Evans AC. Automated 3-D extraction of inner and outer surfaces of cerebral cortex from MRI. Neuroimage. 2000;12:340–356. doi: 10.1006/nimg.1999.0534. [DOI] [PubMed] [Google Scholar]
- Makris N, Kaiser J, Haselgrove C, Seidman LJ, Biederman J, Boriel D, Valera EM, Papadimitriou GM, Fischl B, Caviness VS, et al. Human cerebral cortex: a system for the integration of volume- and surface-based representations. Neuroimage. 2006;33:139–153. doi: 10.1016/j.neuroimage.2006.04.220. [DOI] [PubMed] [Google Scholar]
- Mangin JF, Riviere D, Cachia A, Duchesnay E, Cointepas Y, Papadopoulos-Orfanos D, Scifo P, Ochiai T, Brunelle F, Regis J. A framework to study the cortical folding patterns. Neuroimage. 2004;23:S129–S138. doi: 10.1016/j.neuroimage.2004.07.019. [DOI] [PubMed] [Google Scholar]
- May A, Hajak G, Ganssbauer S, Steffens T, Langguth B, Kleinjung T, Eichhammer P. Structural brain alterations following 5 days of intervention: dynamic aspects of neuroplasticity. Cereb Cortex. 2007;17:205–210. doi: 10.1093/cercor/bhj138. [DOI] [PubMed] [Google Scholar]
- Mechelli A, Friston KJ, Frackowiak RS, Price CJ. Structural covariance in the human cortex. J Neurosci. 2005;25:8303–8310. doi: 10.1523/JNEUROSCI.0357-05.2005. [DOI] [PMC free article] [PubMed] [Google Scholar]
- Meyer JR, Roychowdhury S, Russell EJ, Callahan C, Gitelman D, Mesulam MM. Location of the central sulcus via cortical thickness of the precentral and postcentral gyri on MR. Am J Neuroradiol. 1996;17:1699–1706. [PMC free article] [PubMed] [Google Scholar]
- Moore CI, Stern CE, Corkin S, Fischl B, Gray AC, Rosen BR, Dale AM. Segregation of somatosensory activation in the human rolandic cortex using fMRI. J Neurophysiol. 2000;84:558–569. doi: 10.1152/jn.2000.84.1.558. [DOI] [PubMed] [Google Scholar]
- Narr KL, Bilder RM, Toga AW, Woods RP, Rex DE, Szeszko PR, Robinson D, Sevy S, Gunduz-Bruce H, Wang YP, et al. Mapping cortical thickness and gray matter concentration in first episode schizophrenia. Cereb Cortex. 2005;15:708–719. doi: 10.1093/cercor/bhh172. [DOI] [PubMed] [Google Scholar]
- Nesvag R, Lawyer G, Varnas K, Fjell AM, Walhovd KB, Frigessi A, Jonsson EG, Agartz I. Regional thinning of the cerebral cortex in schizophrenia: effects of diagnosis, age and antipsychotic medication. Schizophr Res. 2008;98:16–28. doi: 10.1016/j.schres.2007.09.015. [DOI] [PubMed] [Google Scholar]
- Nii Y, Uematsu S, Lesser RP, Gordon B. Does the central sulcus divide motor and sensory functions? Neurology. 1996;46:360–367. doi: 10.1212/wnl.46.2.360. [DOI] [PubMed] [Google Scholar]
- Overduin SA, Servos P. Distributed digit somatotopy in primary somatosensory cortex. Neuroimage. 2004;23:462–472. doi: 10.1016/j.neuroimage.2004.06.024. [DOI] [PubMed] [Google Scholar]
- Park H-J, Youn T, Jeong S-O, Oh M-K, Kim S-Y, Kim E-Y. SENSE factors for reliable cortical thickness measurement. Neuroimage. 2008;40:187–196. doi: 10.1016/j.neuroimage.2007.11.013. [DOI] [PubMed] [Google Scholar]
- Penfield W, Rasmussen T. The cerebral cortex of man: a clinical study of localization of function. New York: MacMillan; 1950. p. 248. [Google Scholar]
- Rademacher J, Burgel U, Geyer S, Schormann T, Schleicher A, Freund HJ, Zilles K. Variability and asymmetry in the human precentral motor system: a cytoarchitectonic and myeloarchitectonic brain mapping study. Brain. 2001;124:2232–2258. doi: 10.1093/brain/124.11.2232. [DOI] [PubMed] [Google Scholar]
- Rettmann ME, Kraut MA, Prince JL, Resnick SM. Cross-sectional and longitudinal analyses of anatomical sulcal changes associated with aging. Cereb Cortex. 2006;16:1584–1594. doi: 10.1093/cercor/bhj095. [DOI] [PubMed] [Google Scholar]
- Rosas HD, Liu AK, Hersch S, Glessner M, Ferrante RJ, Salat DH, van der Kouwe A, Jenkins BG, Dale AM, Fischl B. Regional and progressive thinning of the cortical ribbon in Huntington's disease. Neurology. 2002;58:695–701. doi: 10.1212/wnl.58.5.695. [DOI] [PubMed] [Google Scholar]
- Sailer M, Fischl B, Salat DH, Tempelmann C, Schonfeld MA, Busa E, Bodammer N, Heinze HJ, Dale AM. Focal thinning of the cerebral cortex in multiple sclerosis. Brain. 2003;126:1734–1744. doi: 10.1093/brain/awg175. [DOI] [PubMed] [Google Scholar]
- Salat DH, Buckner RL, Snyder AZ, Greve DN, Desikan RSR, Busa E, Morris JC, Dale AM, Fischl B. Thinning of the cerebral cortex in aging. Cereb Cortex. 2004;14:721–730. doi: 10.1093/cercor/bhh032. [DOI] [PubMed] [Google Scholar]
- Schaechter JD, Moore CI, Connell BD, Rosen BR, Dijkhuizen RM. Structural and functional plasticity in the somatosensory cortex of chronic stroke patients. Brain. 2006;129:2722–2733. doi: 10.1093/brain/awl214. [DOI] [PubMed] [Google Scholar]
- Shaw P, Kabani NJ, Lerch JP, Eckstrand K, Lenroot R, Gogtay N, Greenstein D, Clasen L, Evans A, Rapoport JL, et al. Neurodevelopmental trajectories of the human cerebral cortex. J Neurosci. 2008;28:3586–3594. doi: 10.1523/JNEUROSCI.5309-07.2008. [DOI] [PMC free article] [PubMed] [Google Scholar]
- Shaw P, Lerch JP, Greenstein D, Sharp W, Clasen L, Evans A, Giedd J, Castellanos FX, Rapoport J. Longitudinal mapping of cortical thickness and clinical outcome in children and adolescents with attention-deficit/hyperactivity disorder. Arch Gen Psychiatry. 2006;63:540–549. doi: 10.1001/archpsyc.63.5.540. [DOI] [PubMed] [Google Scholar]
- Sowell ER, Kan E, Yoshii J, Thompson PM, Bansal R, Xu D, Toga AW, Peterson BS. Thinning of sensorimotor cortices in children with Tourette syndrome. Nat Neurosci. 2008;11:637–639. doi: 10.1038/nn.2121. [DOI] [PMC free article] [PubMed] [Google Scholar]
- Sowell ER, Thompson PM, Leonard CM, Welcome SE, Kan E, Toga AW. Longitudinal mapping of cortical thickness and brain growth in normal children. J Neurosci. 2004;24:8223–8231. doi: 10.1523/JNEUROSCI.1798-04.2004. [DOI] [PMC free article] [PubMed] [Google Scholar]
- Teutsch S, Herken W, Bingel U, Schoell E, May A. Changes in brain gray matter due to repetitive painful stimulation. Neuroimage. 2008;42:845–849. doi: 10.1016/j.neuroimage.2008.05.044. [DOI] [PubMed] [Google Scholar]
- Thompson PM, Hayashi KM, Dutton RA, Chiang MC, Leow AD, Sowell ER, De Zubicaray G, Becker JT, Lopez OL, Aizenstein HJ, et al. Tracking Alzheimer's disease. Ann N Y Acad Sci. 2007;1097:183–214. doi: 10.1196/annals.1379.017. [DOI] [PMC free article] [PubMed] [Google Scholar]
- Towle VL, Khorasani L, Uftring S, Pelizzari C, Erickson RK, Spire JP, Hoffmann K, Chu D, Scherg M. Noninvasive identification of human central sulcus: a comparison of gyral morphology, functional MRI, dipole localization, and direct cortical mapping. Neuroimage. 2003;19:684–697. doi: 10.1016/s1053-8119(03)00147-2. [DOI] [PubMed] [Google Scholar]
- Wall JT, Xu J, Wang X. Human brain plasticity: an emerging view of the multiple substrates and mechanisms that cause cortical changes and related sensory dysfunctions after injuries of sensory inputs from the body. Brain Res Rev. 2002;39:181–215. doi: 10.1016/s0165-0173(02)00192-3. [DOI] [PubMed] [Google Scholar]
- Wang X, Bauer W, Chiaia N, Dennis M, Gerken M, Hummel J, Kane J, Kenmuir C, Khuder S, Lane R, et al. Longitudinal MRI evaluations of human global cortical thickness over minutes to weeks. Neurosci Lett. 2008;441:145–148. doi: 10.1016/j.neulet.2008.06.013. [DOI] [PubMed] [Google Scholar]
- Watkins KE, Paus T, Lerch JP, Zijdenbos A, Collins DL, Neelin P, Taylor J, Worsley KJ, Evans AC. Structural asymmetries in the human brain: a voxel-based statistical analysis of 142 MRI scans. Cereb Cortex. 2001;11:868–877. doi: 10.1093/cercor/11.9.868. [DOI] [PubMed] [Google Scholar]
- Weiss T, Miltner WHR, Liepert J, Meissner W, Taub E. Rapid functional plasticity in the primary somatomotor cortex and perceptual changes after nerve block. Eur J Neurosci. 2004;20:3413–3423. doi: 10.1111/j.1460-9568.2004.03790.x. [DOI] [PubMed] [Google Scholar]
- White LE, Andrews TJ, Hulette C, Richards A, Groelle M, Paydarfar J, Purves D. Structure of the human sensorimotor system. I. Morphology and cytoarchitecture of the central sulcus. Cereb Cortex. 1997;7:18–30. doi: 10.1093/cercor/7.1.18. [DOI] [PubMed] [Google Scholar]
- White LE, Lucas G, Richards A, Purves D. Cerebral asymmetry and handedness. Nature. 1994;368:197–198. doi: 10.1038/368197a0. [DOI] [PubMed] [Google Scholar]
- Zilles K. Architecture of the human cerebral cortex. In: Paxinos G, Mai JK, editors. The human nervous system. New York: Elsevier; 2004. pp. 997–1055. [Google Scholar]
- Zilles K, Dabringhaus A, Geyer S, Amunts K, Qu M, Schleicher A, Gilissen E, Schlaug G, Steinmetz H. Structural asymmetries in the human forebrain and the forebrain of non-human primates and rats. Neurosci Biobehav Rev. 1996;20:593–605. doi: 10.1016/0149-7634(95)00072-0. [DOI] [PubMed] [Google Scholar]