Abstract
BACKGROUND
It is unknown whether the physiological impact of a given blood pressure (BP) varies by body size. We explored interactions between higher vs. lower systolic BP (SBP) targets and anthropometric measures (body mass index (BMI), body surface area (BSA), height, weight) and recurrent stroke and death in the Secondary Prevention of Small Subcortical Strokes (SPS3) Trial.
METHODS
Patients with recent magnetic resonance imaging-proven lacunar infarcts were randomized to 2 BP targets (130–149mm Hg vs. <130) in a prospective, open-label, blinded end-point design. Time to outcome was evaluated with Cox proportional hazard models and compared between targets. We examined multiplicative interactions between each anthropometric measure and target and mean difference in achieved BP 1 year after randomization between BP groups by quartile. We also computed rates of recurrent stroke and death by quartiles of anthropometrics.
RESULTS
Three thousand and twenty patients were followed over a mean of 3.7 (SD 2.0) years. Mean age was 63; 63% were male. Mean height was 167 (SD 11) cm, weight 81 (18) kg, BMI 29 (5.9) kg/m2, and BSA 1.9 (0.25) m2. Achieved BP at 1 year was comparable between quartiles for each anthropometric measurement. We found no consistent interactions between BP target and anthropometrics for either outcome, nor were there any significant associations between hazard of stroke or death when assessed by BMI, BSA, height, or weight.
CONCLUSIONS
We found no interactions between BP target groups and quartiles of anthropometrics for rates of stroke and death in SPS3. There is no evidence at this time supporting body size-based modifications to current BP targets for secondary prevention after lacunar stroke.
CLINICAL TRIALS REGISTRATION
Trial Number NCT00059306
Keywords: blood pressure, BMI, body size, BSA, height, hypertension, lacunar stroke, prognosis, secondary prevention, weight.
There is a well-described log-linear relationship between average systolic blood pressure (SBP) and diastolic BP and risk of incident and recurrent stroke.1 Current guidelines for BP targets do not take into account sex, body size, or other physiological considerations. However, baseline resting BP is, related to body size: premenopausal women have lower BPs than men2; in children, BPs are correlated with height.3,4 Similarly, in nonhuman mammals, BP varies by size: BP is significantly lower, for example, for a 10-g mouse than for an elephant weighing 4 metric tons.
Given that resting BP in mammals is in part a function of body size, we wondered if the long-term pathophysiologic effects of a given BP may be more marked when distributed across the vasculature of a smaller as opposed to a larger patient: a mean resting BP of 160mm Hg, for example, could possibly have more marked pathophysiologic effects in a 1.5 m tall, 50kg woman as opposed to a 1.8 m, 80kg man. Thus, it is possible that guidelines for BP targets should be modified to include considerations regarding body size. This hypothesis is also supported by previous large-scale meta-analyses of observational studies, which have found a weak but significant negative correlation between height and incidence of stroke and coronary heart disease.5,6
Our primary aim was to explore whether a lower (<130mm Hg) vs. higher (130–149mm Hg) SBP target was of greater benefit in smaller vs. larger patients for prevention of recurrent stroke and death. We examined the association between anthropometric measurements, including body surface area (BSA), body mass index (BMI), height, and weight, and recurrent stroke and death in the Secondary Prevention of Small Subcortical Strokes (SPS3) Trial, which randomized patients with recent symptomatic lacunar infarcts to 2 different SBP targets. Given that smaller beings seem to have lower resting BPs than larger beings, we hypothesized that smaller patients (i.e., those with lower BSA, BMI, height, or weight) randomized to the lower BP target would experience fewer vascular events and death than those randomized to the higher target, while a difference between the BP arms would be attenuated in larger patients.
METHODS
SPS3 was an international, multicenter, randomized phase 3 trial (NCT00059306) examining strategies for secondary prevention of small subcortical (lacunar) infarcts. The rationale, design, and BP protocol have been previously described.7–10 In brief, subjects aged 30 and older were enrolled within 6 months of a symptomatic, magnetic resonance imaging-proven lacunar infarct or within 6 months of a recent symptomatic stroke event and multifocal magnetic resonance imaging-proven small subcortical strokes. Those with a presumed hemispheric clinical localization and evidence of ipsilateral carotid stenosis ≥50% or major-risk cardioembolic source were excluded. Subjects were randomized to 2 interventions in a 2-by-2 factorial design: (i) antiplatelet agents (double-blind): (a) aspirin 325mg/d alone or (b) aspirin plus clopidogrel 75mg/d and (ii) BP control targets (open-label): (a) higher target (SBP 130–149mm Hg) or (b) lower target (SBP < 130mm Hg). Subjects who were on antihypertensive medications at the time of initial assessment did not discontinue their regimens. Following randomization, subjects with BP values outside the target range were seen at least monthly for BP measurement and antihypertensive medication adjustment. Subjects whose BP was within target range were seen every 3 months. If BP was not in target at a follow-up visit, the subject was asked to return within 1 month. In accordance with a strict protocol, 3 consecutive BPs, 5 minutes apart, were measured in the mornings, prior to medication, caffeine or tobacco, and after the patient was sitting quietly for 15 minutes.11 An automated Colin 8800C device (Omron Technologies, San Antonio, TX) was used for measurement. Height and weight were measured by the study coordinator at the initial randomization visit.
Statistical methods
BSA was estimated by the Mosteller formula.12 BSA, BMI (weight in kilograms/height in meters squared), height, and weight were categorized into quartiles of distribution. Supplementary analyses were also performed according to World Health Organization cut points for categorization as normal or underweight, overweight, or obese (<25, 25–29, ≥30kg/m2). The effects of randomized treatment on events (all stroke, death) were evaluated with crude and multivariable Cox proportional hazard models. We initially examined hazard of all stroke, ischemic stroke, hemorrhagic stroke, death, and major vascular events but did not perform further analyses for stroke subtypes and major vascular events due to low event rates and the large proportion of ischemic stroke accounting for both all stroke and major vascular events. Covariables included age, sex, race, region, and history of hypertension and were considered for the multivariable model based on their potential to impact anthropometrics and vascular outcomes independent of the potential causal pathway between the 2 and availability of baseline data. Consistency of the effect of treatment on stroke and death across body size quartiles and World Health Organization BMI cut points were examined using tests of homogeneity that were performed by adding a multiplicative interaction term between exposure quartile and BP group to Cox models and were also tested by fitting BSA, BMI, height, or weight as continuous variables and including a “treatment × body size” multiplicative interaction term in the model. Mean difference in BP between baseline and follow-up at year 1 was calculated for each body size quartile.
In order to ascertain whether hazard of recurrent stroke and death differed across body size quartiles, we computed rates for each event by quartiles of each of the anthropometric measures, using the lowest quartile as reference. Both crude and multivariable hazard ratios (HRs) were examined, again adjusting for age, sex, race, region, and history of hypertension. Further, we fit models with restricted cubic splines with 5 predetermined knots to determine whether there was a nonlinear association between each anthropometric measure and the risk of a primary event.13 Crude annualized rates of events by quartile using the person-year method were also explored. We assumed that body size parameters did not change substantially over the course of the study.
Analysis was by intention-to-treat. Statistical analyses were conducted with SAS v9.3 (SAS Institute, Cary, NC). All statistical tests were 2-tailed and performed at a 0.05 level of significance. As this was a post hoc analysis, we considered these analyses to be hypothesis generating.
SPS3 was performed in accordance with each participating site’s ethical standards of the local institutional review board. No additional consent was required for this subanalysis.
RESULTS
Three thousand and twenty subjects were enrolled and followed over a mean of 3.7 (range 0–8.6, SD 2.0) years. Mean age was 63 (494 were aged 75 and older), and 63% were male. At baseline, mean height was 167cm (SD 11) and weight was 81 (SD 18) kg, with a BMI of 29 (SD 5.9) kg/m2 and a BSA of 1.9 (SD 0.25) m2. There were no significant differences in any of the body size metrics between participants randomized to the higher vs. lower BP targets. In the first year of follow-up, 89% in the 130–149mm Hg group (mean SBP at 1 year: 138mm Hg, SD 14) and 90% in the <130mm Hg group (mean: 127mm Hg, SD 14) reached target BP at one or more visits.
As compared with subjects with lower BSA, those with higher BSA were younger, male, North American, and non-Hispanic. Subjects with higher BSA had a higher prevalence of diabetes, hypertension, smoking, ischemic heart disease, and use of aspirin and statin at enrollment (Table 1, Supplementary Table e-1).
Table 1.
Baseline characteristics across quartiles of BSA for all participants (n = 3,016 of 3,020 participants; 4 participants without BSA)
| Q1 BSA N = 755 1.22–1.75 |
Q2 BSA N = 752 1.75–1.91 |
Q3 BSA N = 755 1.91–2.08 |
Q4 BSA N = 754 2.09–2.91 |
P value | P value from multivariable modela (BSA continuous) | |
|---|---|---|---|---|---|---|
| Mean age | 67.9 (10.9) | 63.9 (10.1) | 62.5 (10.4) | 58.9 (9.6) | <0.0001 | <0.0001 |
| Male sex (%) | 249 (33%) | 478 (64%) | 563 (75%) | 609 (81%) | <0.0001 | <0.0001 |
| Race (%) | <0.0001 | <0.0001 | ||||
| White | 300 (40%) | 344 (46%) | 406 (54%) | 483 (64%) | ||
| Hispanic | 360 (48%) | 285 (38%) | 197 (26%) | 95 (13%) | ||
| Black | 67 (9%) | 93 (12%) | 130 (17%) | 166 (22%) | ||
| Other/mixed | 28 (4%) | 30 (4%) | 22 (3%) | 10 (1%) | ||
| Region (%) | <0.0001 | <0.0001 | ||||
| North America | 388 (45%) | 427 (57%) | 523 (69%) | 669 (89%) | ||
| Latin America | 321 (43%) | 205 (27%) | 127 (17%) | 40 (5%) | ||
| Spain | 96 (13%) | 120 (16%) | 105 (14%) | 45 (6%) | ||
| Mean BMI | 25.0 (4.8) | 27.4 (3.8) | 29.4 (4.4) | 34.2 (6.2) | <0.0001 | <0.0001 |
| History of hypertension (%) | 560 (74%) | 538 (72%) | 559 (74%) | 604 (80%) | 0.001 | |
| Hypertension by SPS3 definition (%) | 661 (88%) | 669 (89%) | 680 (90%) | 696 (92%) | 0.020 | 0.043 |
| Mean BP at baseline | 143 (20)/76 (10) | 143 (19)/78 (11) | 143 (18)/79 (11) | 143 (18)/80 (11) | 0.87/<0.0001 | |
| Diabetes | 242 (32%) | 269 (36%) | 277 (37%) | 318 (42%) | 0.0007 | 0.47 |
| Ischemic heart disease | 50 (7%) | 65 (9%) | 92 (12%) | 109 (14%) | <0.0001 | 0.37 |
| Previous clinical stroke or transient ischemic attack | 106 (14%) | 116 (15%) | 111 (15%) | 115 (15%) | 0.86 | |
| Current smoker | 123 (16%) | 163 (22%) | 166 (22%) | 164 (22%) | 0.014 | 0.099 |
| Type of lacunar stroke | 0.12 | |||||
| Pure motor hemiparesis | 263 (35%) | 269 (35%) | 229 (30%) | 232 (31%) | ||
| Pure sensory stroke | 71 (9%) | 66 (9%) | 75 (10%) | 91 (12%) | ||
| Sensorimotor stroke | 240 (32%) | 232 (31%) | 245 (32%) | 217 (29%) | ||
| Other | 181 (24%) | 185 (25%) | 206 (27%) | 214 (28%) | ||
| Aspirin use (only) at qualifying stroke | 169 (22%) | 197 (26%) | 224 (30%) | 246 (33%) | <0.0001 | 0.072 |
| Statin use at qualifying stroke | 479 (63%) | 523 (70%) | 529 (70%) | 546 (72%) | 0.002 | 0.099 |
Abbreviations: BMI, body mass index; BP, blood pressure; BSA, body surface area.
aMultivariable model covariates included age, sex, race-ethnicity, region, history of hypertension, aspirin use at baseline, and statin use at baseline.
Over the course of follow-up, there were 277 recurrent strokes (annualized rate of 2.5%/year), 88% of which were ischemic, 207 deaths (1.8%/year) and 348 major vascular events, 80% of which were strokes, and the remaining 20% of which were myocardial infarctions or vascular deaths. There was an overall nonsignificant reduction in all recurrent stroke (HR 0.81, 95% CI 0.64–1.03, P = 0.08) and a significant reduction in hemorrhagic stroke (HR 0.37, 95% CI 0.15–0.95, P = 0.03) in the lower target BP group compared with the higher BP target group and no difference between the groups with regard to death (HR 1.03, 95% CI 0.79–1.35, P = 0.82) or myocardial infarction (HR 0.88, 95% CI 0.56–1.39, P = 0.59).10
Mean reduction in BP between baseline and 1 year was similar across body size quartiles. Relative risk reduction for recurrent stroke and death was similar across all body size quartiles for BSA, BMI, and height. There was heterogeneity between risk reduction for stroke across weight quartiles; however, the reduction was significant in favor of the higher target for the second weight quarter only (Figure 1A–D, Table 2).
Figure 1.
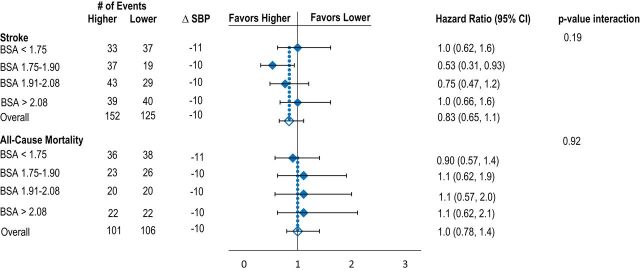
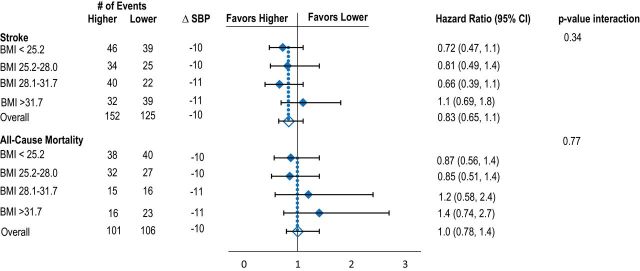
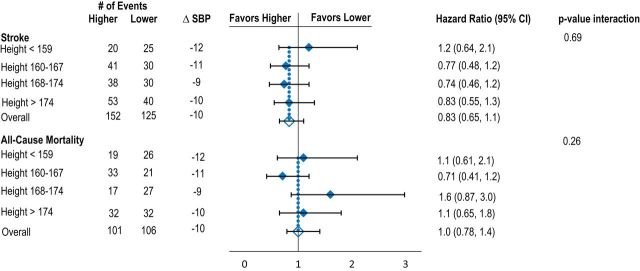
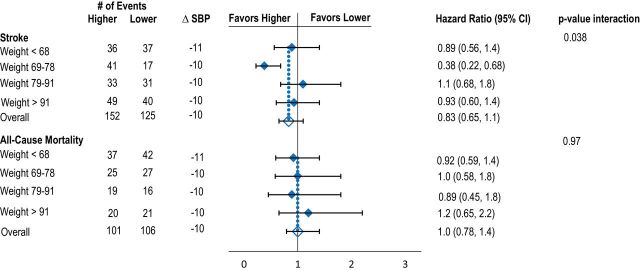
Effects of lower vs. higher SBP targets on risk of recurrent stroke and death according to baseline quartiles of BSA (A), BMI (B), height (C), and weight (D). Model adjusted for age, sex, race-ethnicity, region, and history of hypertension. Mean difference in SBP is between baseline and 1 year. Abbreviations: BMI, body mass index; BSA, body surface area; SBP, systolic blood pressure.
Table 2.
Crude and adjusted hazard ratios (95% CI) for the lower vs. higher BP, stratified by BMI categories, weight, height, and BSA quartiles and including P value for multiplicative interactions
| Underweight/normal weight (N = 704) | Overweight (N = 1252) | Obese (N = 1060) | Adjusteda P values for interactions | ||
|---|---|---|---|---|---|
| All stroke | 0.15 | ||||
| Crude | 0.77 (0.50, 1.2) | 0.64 (0.43, 0.95) | 1.1 (0.71, 1.6) | ||
| Multivariable | 0.74 (0.49, 1.2) | 0.68 (0.45, 1.0) | 1.1 (0.97, 1.7) | ||
| Death | 0.34 | ||||
| Crude | 0.87 (0.56, 1.4) | 0.90 (0.58, 1.4) | 1.4 (0.81, 2.5) | ||
| Multivariable | 0.87 (0.56, 1.4) | 0.88 (0.56, 1.4) | 1.6 (0.88, 2.8) | ||
| Q1 weight (N = 782) | Q2 weight (N = 707) | Q3 weight (N = 791) | Q4 weight (N = 739) | Adjusteda P values for interactions | |
| All stroke | 0.04 | ||||
| Crude | 0.90 (0.57, 1.4) | 0.41 (0.23, 0.72) | 1.1 | (0.65, 1.7) | 0.92 (0.60, 1.4) |
| Multivariable | 0.89 (0.56, 1.4) | 0.38 (0.22, 0.68) | 1.1 (0.68, 1.8) | 0.93 (0.60, 1.4) | |
| Death | 0.97 | ||||
| Crude | 0.94 (0.60, 1.5) | 1.1 | (0.66, 1.9) | 0.91 (0.47, 1.8) | 1.0 (0.56, 1.9) |
| Multivariable | 0.92 (0.59, 1.4) | 1.0 (0.58, 1.8) | 0.89 (0.45, 1.8) | 1.2 (0.65, 2.2) | |
| Q1 height (N = 687) | Q2 height (N = 790) | Q3 height (N = 738) | Q4 height (N = 802) | Adjusteda P values for interactions | |
| All stroke | 0.69 | ||||
| Crude | 1.1 (0.62, 2.0) | 0.78 (0.49, 1.2) | 0.73 (0.45, 1.2) | 0.81 (0.54, 1.2) | |
| Multivariable | 1.2 (0.64, 2.1) | 0.77 (0.48, 1.2) | 0.74 (0.46, 1.2) | 0.83 (0.55, 1.3) | |
| Death | 0.26 | ||||
| Crude | 1.2 (0.65, 2.1) | 0.65 (0.38, 1.1) | 1.5 (0.83, 2.8) | 1.1 (0.65, 1.7) | |
| Multivariable | 1.1 (0.61, 2.1) | 0.71 (0.41, 1.2) | 1.6 (0.87, 3.0) | 1.1 (0.65, 1.8) | |
| Q1 BSA (N = 755) | Q2 BSA (N = 752) | Q3 BSA (N = 755) | Q4 BSA (N = 754) | Adjusteda P values for interactions | |
| All stroke | 0.19 | ||||
| Crude | 1.0 (0.64, 1.6) | 0.51 (0.29, 0.88) | 0.73 (0.45, 1.2) | 1.0 (0.64, 1.6) | |
| Multivariable | 1.0 (0.62, 1.6) | 0.53 (0.31, 0.93) | 0.75 (0.47, 1.2) | 1.0 (0.66, 1.6) | |
| Death | 0.92 | ||||
| Crude | 0.91 (0.58, 1.4) | 1.1 (0.65, 2.0) | 1.0 (0.56, 2.0) | 0.97 (0.54, 1.7) | |
| Multivariable | 0.90 (0.57, 1.4) | 1.1 (0.62, 1.9) | 1.1 (0.57, 2.0) | 1.1 (0.62, 2.1) |
Abbreviations: BMI, body mass index; BP, blood pressure; BSA, body surface area, CI, confidence interval.
aCovariables in multivariable model: age, sex, race-ethnicity, region, history of hypertension.
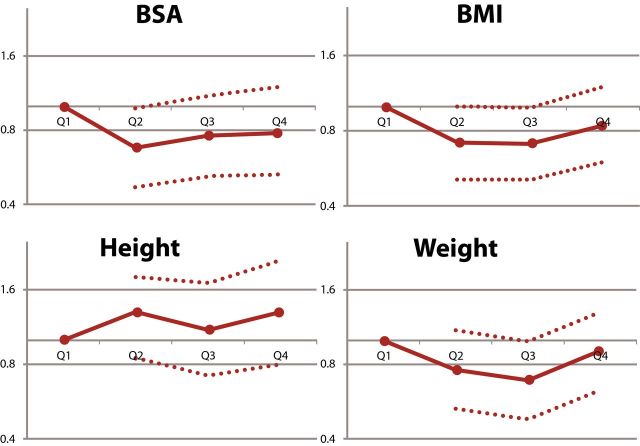
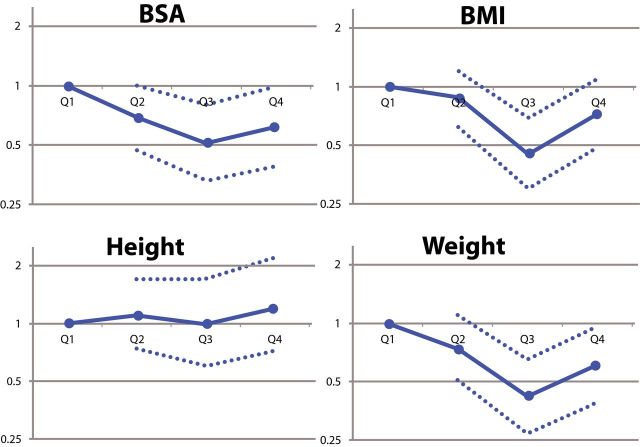
Event rates for body size quartile are detailed in Supplementary Table e-2. Visual exploration of hazard of stroke per quartile for BSA, BMI, and weight demonstrated an overall J-shaped or U-shaped curve in several instances, where the lowest and highest body size quartiles experienced higher event rates than the middle quartiles, while rates of stroke and death trended upward with increasing height (Figure 2). Rates of death trended downward with increasing BSA, BMI, and weight (Figure 2). After multivariable adjustment, hazard of stroke or death did not change significantly with increasing BSA, BMI, or weight. None of these linear or nonlinear relationships demonstrated statistical significance (Supplementary Figure 2A–D).13
Figure 2.
Adjusted hazard ratios for stroke (A) and death (B) by body size quartile. Hazard ratios are expressed using the lowest quartile (Q1) as reference. 95% confidence intervals are denoted by dotted lines. Abbreviations: BMI, body mass index; BSA, body surface area.
DISCUSSION
These results provide evidence that the currently accepted targets for BP treatment are relevant over a wide range of body sizes. We found no relationship between rates of vascular outcomes and body size, nor did we find a consistent statistically significant interaction between assigned pressure target and body size for any of the anthropometric measurements. Although the analysis for effect modification of body size on hypertension outcomes did yield some statistically significant results, in the context of multiple comparisons, small absolute numbers of some events (e.g., hemorrhagic stroke), and the lack of consistency across measures and outcomes, we cannot be confident that these findings are not due to chance.
Our results corroborate those found in a previous subanalysis of another secondary prevention trial examining BP treatment after stroke. Investigators using data from the PROGRESS trial, which randomized participants within 5 years of ischemic or hemorrhagic stroke or transient ischemic attack to perindopril ± indapamide vs. placebo, found no differential risk reduction between the perindopril and placebo arms across quartiles of BMI.14
There are a number of possible explanations for the lack of an interaction between anthropometric measures and BP targets with body size in SPS3. First, a lower-than-expected event rate may have precluded our ability to detect a difference between groups over the span of follow-up. Second, given the excellent overall BP control in SPS3, it is possible that a differential effect of hypertension based on body size may not be detectable. Third, it is possible that the metrics chosen to describe body size are inadequate to ascertain the role of body habitus in the pathophysiological effects of hypertension; it may be necessary to integrate other information not collected in SPS3 including waist circumference, body fat percentages, or genetic, ethnic, hormonal (i.e., postmenopausal or not), or other considerations. Fourth, it is possible that any differential effects of BP targets may have been attenuated by pleiotropic medication effects. Thiazide diuretics, for example, have been associated with greater cardiovascular risk reduction in obese patients as compared with nonobese patients.15,16 Antihypertensive regimens in SPS3 were uncontrolled and left to the discretion of the site investigators, and it is possible that differential use of various antihypertensive classes may have modified the anticipated relationship between body size and hypertension-related outcomes in unexpected ways. Finally, the SPS3 cohort, by inclusion, had already experienced an incident vascular event (lacunar stroke)—it is possible that the relationship between BP and body size may be more pronounced with respect to incident and not recurrent cardiovascular and/or cerebrovascular events.
Perhaps the most likely explanation is that overall body size in adulthood has little clinically relevant impact on the association between ideal resting BP and vascular outcomes in adult humans. The positive relationship between body size and mean BP among mammals of varying body size is nonlinear; instead both increase on approximately an exponential scale proportional to the distance between the head and the heart17: Mean systolic pressure is 93mm Hg in a 10-g mouse and 156mm Hg in a 4-ton elephant, while long-necked mammals have much higher mean pressures—mean arterial pressure in llamas is 152±13mm Hg and in giraffes, it is 185±42mm Hg.18 The observations of our study provide confidence that the current human thresholds for treatment remain relevant over a wide range of body sizes. Targeting treatment based upon body size does not result in a measureable reduction in risk; if there is a differential reduction in risk, it is small.
The relationship between body size, BMI in particular, and vascular events remains controversial. In PROGRESS trial, the absolute risk reduction of vascular events was more pronounced for patients with higher BMIs, with the number needed to treat in the highest BMI quartile (28) being more than double that in the lowest (13). In SPS3, however, we found an overall trend toward a decrease in death with increased body size (BSA, BMI, and weight) and a U-shaped trend for stroke rates with increasing BSA, BMI, and weight. In patients aged 75 and older, however, larger body size (BSA, height, and weight) was associated with a trend toward an increase in stroke and death. Given that none of these relationships, either linear or nonlinear, were found to be statistically significant, these trends may be due to chance. However, given this was not a prespecified analysis, subgroups may have been underpowered to demonstrate significance in this exploratory, hypothesis-generating analysis.
Several epidemiological studies have suggested that there is a so-called “obesity paradox,” whereby obese patients experience lower rates of vascular events and death than patients with lower BMIs.19–22 Our cohort also suggests that in patients with lacunar infarcts, there is also a suggestion that larger patients (increasing BSA, BMI, and weight) experience lower rates of death. Further exploration of the relationship between body size and risk of vascular events and death in the poststroke population is warranted in future studies to help guide prognostication and management.
Our study’s primary strength is its large, well-defined prospective cohort of multiethnic subjects, validated, regular BP measurements, and its length of follow-up. The observations here are limited by the inclusion and exclusion criteria of SPS3 and by the nature of data collection in the trial. Only 10% of subjects in SPS3 had ischemic heart disease, under 5% had congestive heart failure, and all subjects with marked renal dysfunction (creatinine clearance was <1.73ml/m2/min) were excluded. It remains possible that a subset of patients not sufficiently represented in the SPS3 cohort with particular medical comorbidity might be responsive to a lower BP target in the context of a smaller body size.
Body size has been associated with markers of vascular risk in population-based studies. The association between BMI and metabolic risk factors is well documented, and population-based data also suggest an association between height and vascular risk: in a cardiac imaging study, taller individuals had a lower odds of coronary artery calcification than shorter participants.23 Greater height has also been associated with lower risks of sudden cardiac death,24 ischemic heart disease,6 atrial fibrillation,25 and stroke.5,6,26 However, the directionality and nature of the relationship between body size and vascular risk has yet to be clarified.
CONCLUSIONS
We found no evidence that smaller patients benefitted more from aggressive SBP control than larger patients after lacunar stroke. Though physiological studies have suggested that larger patients may have more favorable central hemodynamics than shorter individuals,27 it is unclear whether this actually translates to meaningful differences in clinical risk. Further investigations, including subclinical markers such as longitudinal neuroradiologic or cognitive changes, may be required to ascertain the differential pathophysiological effects of hypertension on patients of different body sizes. There is no compelling evidence at this time to recommend body size–based modifications to current BP targets for secondary prevention after lacunar stroke.
SUPPLEMENTARY MATERIAL
Supplementary materials are available at American Journal of Hypertension (http://ajh.oxfordjournals.org).
DISCLOSURE
The authors declared no conflict of interest.
Supplementary Material
ACKNOWLEDGMENTS
This work was supported by a grant (U01NS038529) from the US National Institutes of Health-National Institute of Neurological Disorders and Stroke .
REFERENCES
- 1.Lewington S, Clarke R, Qizilbash N, Peto R, Collins R Prospective Studies Collaboration. Age-specific relevance of usual blood pressure to vascular mortality: a meta-analysis of individual data for one million adults in 61 prospective studies. Lancet. 2002;360:1903–1913. doi: 10.1016/s0140-6736(02)11911-8. [DOI] [PubMed] [Google Scholar]
- 2.Oparil S, Miller AP. Gender and blood pressure. J Clin Hypertens (Greenwich) 2005;7:300–309. doi: 10.1111/j.1524-6175.2005.04087.x. [DOI] [PMC free article] [PubMed] [Google Scholar]
- 3.Fujita Y, Kouda K, Nakamura H, Nishio N, Takeuchi H, Iki M. Relationship between height and blood pressure in Japanese schoolchildren. Pediatr Int. 2010;52:689–693. doi: 10.1111/j.1442-200X.2010.03093.x. [DOI] [PubMed] [Google Scholar]
- 4.Galescu O, George M, Basetty S, Predescu I, Mongia A, Ten S, Bhangoo A. Blood pressure over height ratios: simple and accurate method of detecting elevated blood pressure in children. Int J Pediatr. 2012;2012:253497. doi: 10.1155/2012/253497. [DOI] [PMC free article] [PubMed] [Google Scholar]
- 5.Emerging Risk Factors Collaboration. Adult height and the risk of cause-specific death and vascular morbidity in 1 million people: individual participant meta-analysis. Int J Epidemiol. 2012;41:1419–1433. doi: 10.1093/ije/dys086. [DOI] [PMC free article] [PubMed] [Google Scholar]
- 6.Silventoinen K, Magnusson PK, Tynelius P, Batty GD, Rasmussen F. Association of body size and muscle strength with incidence of coronary heart disease and cerebrovascular diseases: a population-based cohort study of one million Swedish men. Int J Epidemiol. 2009;38:110–118. doi: 10.1093/ije/dyn231. [DOI] [PubMed] [Google Scholar]
- 7.Benavente OR, Hart RG, McClure LA, Szychowski JM, Coffey CS, Pearce LA. Effects of clopidogrel added to aspirin in patients with recent lacunar stroke. N Eng J Med. 2012;367:817–825. doi: 10.1056/NEJMoa1204133. [DOI] [PMC free article] [PubMed] [Google Scholar]
- 8.Benavente OR, White CL, Pearce L, Pergola P, Roldan A, Benavente MF, Coffey C, McClure LA, Szychowski JM, Conwit R, Heberling PA, Howard G, Bazan C, Vidal-Pergola G, Talbert R, Hart RG SPS3 Investigators. The Secondary Prevention of Small Subcortical Strokes (SPS3) study. Int J Stroke. 2011;6:164–175. doi: 10.1111/j.1747-4949.2010.00573.x. [DOI] [PMC free article] [PubMed] [Google Scholar]
- 9.Pérgola PE, White CL, Graves JW, Coffey CS, Tonarelli SB, Hart RG, Benavente OR SPS3 Investigators. Reliability and validity of blood pressure measurement in the Secondary Prevention of Small Subcortical Strokes study. Blood Press Monit. 2007;12:1–8. doi: 10.1097/MBP.0b013e3280858d5b. [DOI] [PMC free article] [PubMed] [Google Scholar]
- 10.Benavente OR, Coffey CS, Conwit R, Hart RG, McClure LA, Pearce LA, Pergola PE, Szychowski JM SPS3 Study Group. Blood-pressure targets in patients with recent lacunar stroke: the SPS3 randomised trial. Lancet. 2013;382:507–515. doi: 10.1016/S0140-6736(13)60852-1. [DOI] [PMC free article] [PubMed] [Google Scholar]
- 11.Pérgola PE, White CL, Graves JW, Coffey CS, Tonarelli SB, Hart RG, Benavente OR SPS3 Investigators. Reliability and validity of blood pressure measurement in the Secondary Prevention of Small Subcortical Strokes study. Blood Press Monit. 2007;12:1–8. doi: 10.1097/MBP.0b013e3280858d5b. [DOI] [PMC free article] [PubMed] [Google Scholar]
- 12.Mosteller RD. Simplified calculation of body-surface area. N Engl J Med. 1987;317:1098. doi: 10.1056/NEJM198710223171717. [DOI] [PubMed] [Google Scholar]
- 13.Desquilbet L, Mariotti F. Dose-response analyses using restricted cubic spline functions in public health research. Stat Med. 2010;29:1037–1057. doi: 10.1002/sim.3841. [DOI] [PubMed] [Google Scholar]
- 14.Czernichow S, Ninomiya T, Huxley R, Kengne AP, Batty GD, Grobbee DE, Woodward M, Neal B, Chalmers J. Impact of blood pressure lowering on cardiovascular outcomes in normal weight, overweight, and obese individuals: the Perindopril Protection Against Recurrent Stroke Study trial. Hypertension. 2010;55:1193–1198. doi: 10.1161/HYPERTENSIONAHA.109.140624. [DOI] [PMC free article] [PubMed] [Google Scholar]
- 15.Weber MA, Jamerson K, Bakris GL, Weir MR, Zappe D, Zhang Y, Dahlof B, Velazquez EJ, Pitt B. Effects of body size and hypertension treatments on cardiovascular event rates: subanalysis of the ACCOMPLISH randomised controlled trial. Lancet. 2013;381:537–545. doi: 10.1016/S0140-6736(12)61343-9. [DOI] [PubMed] [Google Scholar]
- 16.Wassertheil-Smoller S, Fann C, Allman RM, Black HR, Camel GH, Davis B, Masaki K, Pressel S, Prineas RJ, Stamler J, Vogt TM. Relation of low body mass to death and stroke in the systolic hypertension in the elderly program. The SHEP Cooperative Research Group. Arch Intern Med. 2000;160:494–500. doi: 10.1001/archinte.160.4.494. [DOI] [PubMed] [Google Scholar]
- 17.White CR, Seymour RS. The role of gravity in the evolution of mammalian blood pressure. Evolution. 2014;68:901–908. doi: 10.1111/evo.12298. [DOI] [PubMed] [Google Scholar]
- 18.Paton JF, Dickinson CJ, Mitchell G. Harvey cushing and the regulation of blood pressure in giraffe, rat and man: Introducing ‘cushing’s mechanism’. Exp Physiol. 2009;94:11–17. doi: 10.1113/expphysiol.2008.043455. [DOI] [PubMed] [Google Scholar]
- 19.Curtis JP, Selter JG, Wang Y, Rathore SS, Jovin IS, Jadbabaie F, Kosiborod M, Portnay EL, Sokol SI, Bader F, Krumholz HM. The obesity paradox: body mass index and outcomes in patients with heart failure. Arch Intern Med. 2005;165:55–61. doi: 10.1001/archinte.165.1.55. [DOI] [PubMed] [Google Scholar]
- 20.Romero-Corral A, Montori VM, Somers VK, Korinek J, Thomas RJ, Allison TG, Mookadam F, Lopez-Jimenez F. Association of bodyweight with total mortality and with cardiovascular events in coronary artery disease: a systematic review of cohort studies. Lancet. 2006;368:666–678. doi: 10.1016/S0140-6736(06)69251-9. [DOI] [PubMed] [Google Scholar]
- 21.Adams KF, Schatzkin A, Harris TB, Kipnis V, Mouw T, Ballard-Barbash R, Hollenbeck A, Leitzmann MF. Overweight, obesity, and mortality in a large prospective cohort of persons 50 to 71 years old. N Engl J Med. 2006;355:763–778. doi: 10.1056/NEJMoa055643. [DOI] [PubMed] [Google Scholar]
- 22.Clark AL, Chyu J, Horwich TB. The obesity paradox in men versus women with systolic heart failure. Am J Cardiol. 2012;110:77–82. doi: 10.1016/j.amjcard.2012.02.050. [DOI] [PMC free article] [PubMed] [Google Scholar]
- 23.Miedema MD, Petrone AB, Arnett DK, Dodson JA, Carr JJ, Pankow JS, Hunt SC, Province MA, Kraja A, Gaziano JM, Djousse L. Adult height and prevalence of coronary artery calcium: the National Heart, Lung, and Blood Institute Family Heart Study. Circ Cardiovasc Imaging. 2014;7:52–57. doi: 10.1161/CIRCIMAGING.113.000681. [DOI] [PMC free article] [PubMed] [Google Scholar]
- 24.Rosenberg MA, Lopez FL, Bůžková P, Adabag S, Chen LY, Sotoodehnia N, Kronmal RA, Siscovick DS, Alonso A, Buxton A, Folsom AR, Mukamal KJ. Height and risk of sudden cardiac death: the Atherosclerosis Risk in Communities and Cardiovascular Health studies. Ann Epidemiol. 2014;24:174–179.e2. doi: 10.1016/j.annepidem.2013.11.008. [DOI] [PMC free article] [PubMed] [Google Scholar]
- 25.Schmidt M, Bøtker HE, Pedersen L, Sørensen HT. Adult height and risk of ischemic heart disease, atrial fibrillation, stroke, venous thromboembolism, and premature death: a population based 36-year follow-up study. Eur J Epidemiol. 2014;29:111–118. doi: 10.1007/s10654-013-9867-y. [DOI] [PubMed] [Google Scholar]
- 26.Smith LG, Yatsuya H, Psaty BM, Longstreth WT, Jr, Folsom AR. Height and risk of incident intraparenchymal hemorrhage: Atherosclerosis Risk in Communities and Cardiovascular Health study cohorts. J Stroke Cerebrovasc Dis. 2013;22:323–328. doi: 10.1016/j.jstrokecerebrovasdis.2011.09.004. [DOI] [PMC free article] [PubMed] [Google Scholar]
- 27.Reeve JC, Abhayaratna WP, Davies JE, Sharman JE. Central hemodynamics could explain the inverse association between height and cardiovascular mortality. Am J Hypertens. 2014;27:392–400. doi: 10.1093/ajh/hpt222. [DOI] [PubMed] [Google Scholar]
Associated Data
This section collects any data citations, data availability statements, or supplementary materials included in this article.


