

Abstract
Objective Youth with Type 1 diabetes (T1D) from single-parent families have poorer glycemic control; a finding confounded with socioeconomic status (SES). Family density (FD), or youth:adult ratio, may better characterize family risk status. Methods Structural equation modeling assessed the relation of single-parent status, SES, and FD to parenting stress, diabetes-related conflict, parental monitoring, adherence, and glycemic control using cross-sectional parent and youth data (n = 257). Results Single-parent status exhibited similar relations as SES and was removed. Lower FD was associated with better glycemic control (β = −.29, p = .014) via less conflict (β = .17, p = .038) and greater adherence (β = −.54, p < .001). Conclusions Beyond SES, FD plays a significant role in adherence and glycemic control via diabetes-related conflict. In contrast, the effects of single-parent status were indistinguishable from those of SES. FD provides distinct information related to adolescent glycemic control.
Keywords: adolescence, family structure, glycemic control, SES, Type 1 diabetes
Introduction
Type 1 diabetes (T1D) is a complex chronic illness that affects approximately 2.4 per 1,000 youth aged <20 years in the United States (Menke et al., 2013). Management of TID is multifaceted and requires adherence to numerous disease care behaviors by adolescents and their parents. Developmental changes and family factors associated with adolescence often result in poorer disease care behaviors and, subsequently, poorer glycemic control. Thus, study of family attributes related to poorer adherence and glycemic control could help avoid long-term disease complications (Nathan and DCCT/EDIC Research Group, 2014). In the past decade, family structure or marital status (MS) has been emphasized as a relatively unstudied family factor that predictably relates to youth disease care and glycemic control (Brown et al., 2008) at the same time that rapid shifts in family demographic characteristics have occurred (U.S. Census Bureau, 2012).
Adolescents from single-parent families tend to be in poorer glycemic control compared with those from two-parent families (Thompson, Auslander, & White, 2001). The percentage of American children living in two-parent families has decreased from 77% in 1980 to 64% in 2012; such that, approximately 4 in 10 children live in single-parent homes (U.S. Census Bureau, 2012). Despite this changing demographic, little psychological research on family structure has occurred. Although MS is the traditional measure of family structure, it may not be the best indicator of parental time and resources available for a youth with a chronic illness. Family density (FD), or the ratio of children to adults in a home, is an alternative way to conceptualize the functional association among family structure, disease care management, and, ultimately, glycemic control. FD may be particularly germane for single-parent families of adolescents with TID because parenting multiple children may impact a parent’s ability to be involved in disease care behaviors and lessen financial resources.
FD is defined as a family’s total child to adult ratio. A high risk ratio is described as >2 and is an identified risk factor for diminished cognitive and behavioral development in premature infants followed for 3 years (Liaw & Brooks-Gun, 1994). Thought to reflect the availability of adult resources in the home, no research yet exists in families with T1D youth. For example, fewer adults per child in the home may be a significant risk factor for less parental monitoring, which is detrimental for youth with TID (Berg et al., 2008; Ellis et al., 2007). In short, FD may provide a more objective calibration of youth risk for poorer glycemic control because it accounts for the presence of other adults and children within the home instead of a simple description of parental MS.
Beyond family structure, socioeconomic status (SES) consistently has ubiquitous associations with a broad range of health-care status and outcomes (Adler et al., 1994; Conger & Donnellan, 2007; Gallo & Mathews, 2003) including glycemic control in adolescents (Drew et al., 2011; Mullins et al., 2011). Failure to account for the effect of SES in relation to family structure and youth glycemic status disregards the confound that frequently exists between single-parent status and well-known detrimental health effects of lower SES (Brown et al., 2008; Mullins et al., 2011). Diabetes is a relatively complex and expensive illness to manage, and lower SES, as measured by lower parental educational and occupational attainment, can be a hindrance (Chisholm et al., 2007; Hollingshead, 1975). However, SES does not account for psychosocial factors in the home that also relate to youth glycemic control. For example, the number of children and other adults within a home may relate to level of parental stress, diabetes-related conflict, and parental monitoring (Hilliard et al., 2013). In addition to sociodemographic characteristics of SES and family structure, a fuller understanding of youth adherence and glycemic control will require modeling these relevant psychosocial factors associated with glycemic control.
Parental Stress
Parents of youth with a chronic illness, such as T1D, often experience stress related to management of daily health-care expectations (Dodgson et al., 2000). Parents report personal stress related to social disruption, emotional strain, and financial strain (Dodgson et al., 2000). Frequency of parenting stress is higher in single-parent and in lower SES families (Streisand, Swift, Wickmark, Chen, & Holmes, 2005), but parental stress in FD is unstudied. A higher ratio of children to adults in a home, characteristic of higher-density families, may relate to more perceived parental stress.
Diabetes-Related Conflict
Diabetes-related conflict also is associated with poorer adherence and glycemic control in adolescents with T1D (Schilling, Knafl, & Grey, 2006; Wysocki, 1993). Further, diabetes-related conflict is inversely related to less parental monitoring; the latter of which is a key cross-sectional correlate (Hilliard et al., 2013) and longitudinal predictor (Hilliard, Guilfoyle, Dolan, & Hood, 2011; Hood, Rausch, & Dolan, 2011) of poorer adherence. Single-parent and lower SES families report more diabetes-related conflict (Overstreet et al., 1995; Swift, Chen, Hershberger, & Holmes, 2006). As such, the well-documented associations among single-parent status, lower SES, and higher diabetes-related conflict are expected. Higher FD also may be related to more conflict associated with diabetes.
Parental Monitoring
Parental monitoring is related to more adherent disease care behaviors and better glycemic control (Berg et al., 2008; Ellis et al., 2007; Palmer et al., 2011). To date, no studies have examined the role of either family structure or SES in relation to parental monitoring; these associations remain to be defined. Single-parent status and lower SES might be expected to be related to less parental monitoring, which in turn should relate to poorer youth adherence. Higher FD also could display adverse associations with youth diabetes management and glycemic control.
Structural equation modeling will evaluate proposed relations among the key demographic factors of family structure (i.e., MS and FD) and SES to better understand their relation to parental stress, diabetes-related conflict, and parental monitoring, which in turn should relate to youth adherence and, ultimately, to glycemic control. To represent both parent and youth perception of each of these constructs, parent and youth reports will be used in the measurement strategy and combined into latent variables. While parents and youth sometimes vary in their reports, a combined construct reduces individual rater bias and allows more accurate measurement of each construct. FD, or the child:adult ratio within a home, is hypothesized to provide unique information about family structure above and beyond single-parent MS and SES (Mullins et al., 2011), which are often confounded.
Methods
Participants
Participants were 257 adolescents (51% male) aged 11–14 years (M = 12.84, SD = 1.24) with T1D and a primary caregiver. Eligibility criteria included a diagnosis of T1D for at least 1 year before enrollment in the study, no other chronic illness, injury, or mental disability, and fluency in reading and writing English. Participant data are from a longitudinal randomized clinical trial of a treatment program designed to increase parent involvement and to prevent deterioration in adolescent diabetes disease care (Holmes, Chen, Mackey, Grey, & Streisand, 2014). Questionnaire and interview data were collected from parent/youth dyads during a baseline assessment; glycemic control (A1c values) was assessed at baseline and 3 months later before initiation of treatment. The majority of adolescents were White and from middle SES families with moderate glycemic control (A1c = 8.80%). Approximately two-thirds of youth were prescribed an intensive insulin regimen of continuous subcutaneous insulin infusion or basal/bolus injections. One-quarter of adolescents were from single-parent families and 10% were in higher-density families (ratio of children to adults >2). See Table I for the further description. Tables II and III report in detail the classification and overlap of families according to the family structure variables, along with associated glycemic control.
Table I.
Sociodemographic and Disease Characteristics of Participants (n = 257)
| Variable | n (%) | |
|---|---|---|
| Male | 130 (50.6) | |
| Ethnicity | ||
| White | 179 (69.6) | |
| Black | 49 (19.1) | |
| Hispanic | 14 (5.5) | |
| Asian/Asian American | 5 (1.9) | |
| Other | 10 (3.9) | |
| Hollingshead Index of SES | ||
| I (upper 60–69) | 30 (12.1) | |
| II (upper middle 48–59) | 103 (41.5) | |
| III (middle 29–47) | 96 (38.7) | |
| IV (lower middle 18–28) | 12 (4.9) | |
| V (lower 8–17) | 7 (2.8) | |
| Insulin regimen | ||
| Intensive (CSII, basal/bolus) | 186 (73.2) | |
| Conventional (2–3 injections) | 68 (26.8) | |
| Single-parent families | 58 (22.9) | |
| Higher-density families | 27 (11.1) | |
| Variable | M (SD) | Range |
| SESa | 46.61 (11.73) | 12.00–66.00 |
| Youth age (years) | 12.84 (1.24) | 11.00–14.00 |
| T1D duration (years) | 5.12 (3.06) | 0.30–13.63 |
| HbA1c (baseline) | 8.81% (1.64) | 6.30–14.00 |
| HbA1c (3 months after baseline) | 8.93% (1.54) | 5.90–14.00 |
Notes. aSES = socioeconomic status, higher scores indicate higher SES.
Table II.
Post Hoc Analyses: Multiple Regression of Family Structure Classifications (Marital Status and Family Density) and SES With A1c as the Dependent Variable
| Variable |
B | SE B | β | p |
|---|---|---|---|---|
| SES | −.045 | .009 | −.314 | <.001 |
| Marital status | .071 | .304 | .018 | .815 |
| Family density | .475 | .161 | .212 | .003 |
Table III.
Post Hoc Analyses: Two-Way ANOVA of Family Structure Classifications (Marital Status and Family Density) for A1c
| Variable | Family density | |
|---|---|---|
| Marital status | Higher density | Lower density |
| N = 27 | N = 217 | |
| M A1c = 10.17 %a | M A1c = 8.63%b | |
| Single parent | Higher density, single parent | Lower density, single parent |
| N = 54 | N = 20 | N = 34 |
| M A1c = 9.47 % | M A1c = 10.29 % | M A1c = 8.99 % |
| Two parent | Higher density, two parent | Lower density, two parent |
| N = 190 | N = 7 | N = 183 |
| M A1c = 8.61 % | M A1c = 9.83 % | M A1c = 8.57 % |
Notes. The significant main effect of Family Density is bolded (p = .001). Neither the main effect of Marital Status (p = .243) nor the interaction (p = .967) was significant. Significantly different means are indicated with different superscripts (a,b).
Procedure
Families of eligible participants were identified from clinic schedules during a 2.5-year enrollment period and were sent a recruitment letter detailing study involvement. Families then were contacted by telephone and invited to participate. If a parent and adolescent agreed, an assessment was scheduled concurrently with the next upcoming medical appointment. After written informed parental consent and youth assent were obtained, trained research staff interviewed an adolescent and parent separately and administered a battery of questionnaires. After completion of the baseline assessment, families received a $25 gift card.
Measures
Demographic Information
Demographic and medical questionnaires included information such as ethnicity, age, MS, age of disease onset, disease duration, household composition, and SES. SES was measured using the Hollingshead Index of socioeconomic status (Hollingshead, 1975). A SES score from 8 to 66 was based on reported parental education level and occupation, with higher scores indicating higher SES.
Family Structure
An FD ratio was calculated that reflected parent report of the number of children to adults within a household. A child:parent ratio >2 was considered “higher family density” to reflect both family size and indirectly the availability of adult resources in the home (Liaw & Brooks-Gun, 1994). A second indicator of family structure, MS, was parent-reported on the demographic questionnaire administered.
Parenting Stress
Parental stress was reported by parents on the Pediatric Inventory for Parents (PIP; Streisand, Braniecki, Tercyak, & Kazak, 2001), designed to assess frequency and difficulty of stress experienced by parents of youth with chronic or acute illness. The scale includes 42 items for which participants indicate “frequency” and “difficulty” of each item on a scale from 1 to 5 (1 = never or not at all to 5 = very often or extremely). Scores from the test standardization sample range from 42 to 210; M total score = 94.0 ± 33.3. The Cronbach’s alpha coefficient was .95 (Lewin et al., 2005).
Diabetes-Related Conflict
The Diabetes Family Conflict Scale—Revised (DFCS-R; Hood, Butler, Anderson, & Laffel, 2007) was completed by parents and youth separately to measure diabetes-related conflict. The DFCS-R consists of 19 items that assess the frequency of conflict surrounding diabetes-related management tasks, with a 3-point Likert scale from “never” to “almost never” (scale range of 19, no conflict, to 57, high conflict). The DFCS-R has appropriate construct validity, internal consistency, concurrent validity, and predictive validity (Hood et al., 2007).
Parental Monitoring
The Parental Monitoring of Diabetes Care Scale (PMDS; Ellis et al., 2008) is a parent- and adolescent-completed questionnaire that assesses parental monitoring of daily diabetes management tasks. Eighteen items are rated on a 5-point Likert scale (1 = more than once a day to 5 = less than once a week); a final 19th item is open-ended. Scores range from 18 to 90; higher scores indicate more parental monitoring. Parents and adolescents completed the questionnaire separately. The PMDS has acceptable internal consistency (α = .81) and test–retest reliability (intraclass correlation coefficient [ICC] = .80; Ellis et al., 2008).
Adolescents and their parents also were interviewed separately with the 24-hr Diabetes Interview (DI; Holmes et al., 2006; adapted from Johnson, Silverstein, Rosenbloom, Carter, & Cunningham, 1986). Diabetes management tasks were queried and reported in temporal order over the previous 24 hr by each interviewee. Two samples of behaviors were elicited on two different days within a 2-week period that were averaged within reporters. Percentage of parental observation or discussion of an adolescent’s daily blood glucose checks was tallied from youth and parent reports separately and was included as a second measure of parental monitoring. The 24-hr methodology is a reliable, valid, and well-established measure of diabetes self-care behavior (Freund, Johnson, Silverstein, & Thomas, 1991; Quittner, Modi, Lemanek, Ievers-Landis, & Rapoff, 2008).
Adherence
Disease care adherence was assessed with the Diabetes Behavioral Rating Scale (DBRS; Iannotti et al., 2006), which was administered to parents and adolescents separately. The pump version of the measure consists of 37 items and the nonpump version consists of 36 items; higher scores reflect greater adherence. The DBRS shows satisfactory internal consistency (.84), test–retest reliability (ICC = .71), and parent–adolescent agreement (.48; Iannotti et al., 2006).
A second measure of diabetes adherence was provided from the number of adolescent- and parent-reported blood glucose checks/day on the DI (Holmes et al., 2006; adapted from Johnson, Silverstein, Rosenbloom, Carter, & Cunningham, 1986). Described previously, adolescents and their parents were asked separately on the DI to report the number of blood glucose checks/day. The number of checks was averaged within reporters from two separate reports obtained on different days within a 2-week period. Number of blood glucose checks/day has been used previously as a proxy indicator of diabetes self-management, with more checks linked to better glycemic control (Hilliard et al., 2011).
Glycemic Control
Glycemic control at baseline and 3 months later was determined via medical chart reviews. A Bayer DCA 2000 Analyzer measured A1c levels (DCA 2000, Bayer, Inc., Tarrytown, NY). The A1c results from the DCA 2000 Analyzer are strongly correlated with the Diabetes Control and Complications Trial/Epidemiology of Diabetes Interventions and Complications central laboratory values (r = .94, p < .001; Tamborlane et al., 2005). An A1c level indicates an individual’s average blood glucose concentration over the previous 3 months. A higher A1c value suggests poorer glycemic control. The recommended A1c level for adolescents is <7.5% (American Diabetes Association [ADA], 2011). The normal/nondiabetes reference range on the DCA 2000 is 4.3–5.7%.
Data Analytic Plan
The current study used structural equation modeling (SEM) to assess the associations among MS, FD, SES, parenting stress, diabetes-related conflict, parental monitoring, diabetes adherence, and glycemic control. Structural equation modeling was conducted with Mplus 6.0 software (Muthen & Muthen, 1998–2010). To include all participants, a full information maximum likelihood procedure was used; those with missing data (9.72%) were presumed to have missing data at random. Demographic variables of MS and FD were not imputed. SEM tests for mediation with cross-sectional data through analysis of direct and indirect effects, known as path coefficients, among the independent, mediating, and dependent variables.
The hypothesized model consisted of five latent variables composed of parent- and youth-reported data (Figure 1). Parent- and youth-reported scores on each measure were used as indicators of the latent variables for several reasons. Inclusion of ratings from multiple reporters allows analysis of family-level data, accounts for within-family nonindependence, and more accurately represents each construct (Kenny, 1995). Further, the inclusion of parent report and youth report reduces individual rater bias and improves the reliability of each construct (Kline, 2011).
Figure 1.
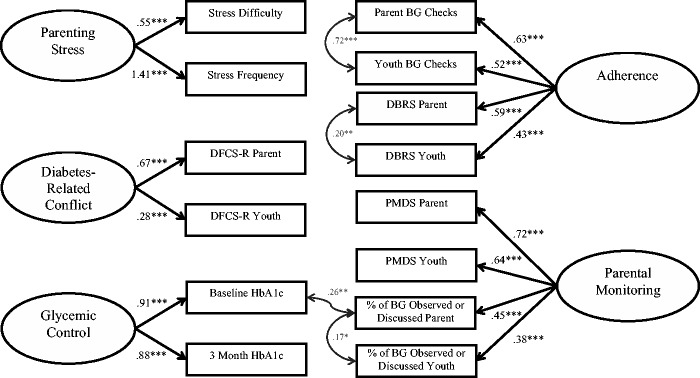
Latent variable measurement model with error variance correlations.
Notes. Numbers are standardized path estimates. *p < .05, **p < .01, ***p < .001.
The data were screened for outliers, and all indices were found to be within acceptable limits for skewness and kurtosis (Kline, 2011). Significantly correlated demographic variables were included in the model as covariates to account for contextual factors that may influence the variables of interest. Overall model fit was assessed using five empirically established indicators. A chi-square value with a p value >.05 indicates good fit (Hu & Bentler, 1999). However, owing to the large sample size of the current study, the chi-square statistic is not considered the best assessment of fit because it is closely related to sample size. A root mean square error of approximation (RMSEA) value <.06 and a standardized root mean square residual (SRMR) value <.08 both indicate an acceptable fit (Kline, 2011). Additionally, a comparative fit index (CFI) and a Tucker–Lewis Index (TLI) value >.90 indicate an acceptable fit (Hu & Bentler, 1999). Initially, the fit and indicator loadings of each of the five latent variables were examined in the measurement model. Model fit was improved in accordance with Mplus-suggested modification guidelines (Kline, 2011). Second, the fit and standardized path loadings were evaluated in the hypothesized mediation model.
Results
Descriptive Information
Parents in the current sample reported normative levels of both frequency and difficulty of experienced stress (PIP; Streisand et al., 2001).Comparably high, though normative, levels of diabetes-related conflict were reported by parents and youth (DFCS-R; Hood et al., 2007). Parents and youth also reported relatively low, though normative, levels of diabetes regimen adherence (DBRS; Iannotti et al., 2006). Normative data about parental monitoring were not available (PMDC; Ellis et al., 2008). Mean A1c was higher than recommended by the ADA (2011) for this age (range 5.90–14.00%). For a complete report of the means, standard deviations, and correlations among key study variables, see Table IV.
Table IV.
Correlations, Means, and SDs Among Demographic and Key Study Variables
| Variable | 1 | 2 | 3 | 4 | 5 | 6 | 7 | 8 | 9 | 10 | 11 | 12 | 13 | 14 | 15 | 16 | 17 | 18 | 19 | 20 | Mean (SD) |
|---|---|---|---|---|---|---|---|---|---|---|---|---|---|---|---|---|---|---|---|---|---|
| 1. Family density | – | 1.51 (.74) | |||||||||||||||||||
| 2. SESa | −.22** | – | 46.61 (11.73) | ||||||||||||||||||
| 3. Youth's age (years) | .02 | .04 | – | 12.84 (1.24) | |||||||||||||||||
| 4. Youth's ethnicityb | .21** | −.33*** | .01 | – | .30 (.46) | ||||||||||||||||
| 5. Youth's genderc | .05 | .14* | −.03 | −.04 | – | .49 (.50) | |||||||||||||||
| 6. Insulin regimend | .22** | −.32*** | −.01 | .34*** | −.10 | – | .27 (.44) | ||||||||||||||
| 7. Stress frequency | .06 | −.27*** | .02 | .25*** | .01 | .08 | – | 90.49 (24.59) | |||||||||||||
| 8. Stress difficulty | .07 | −.15* | .08 | .11 | .06 | .03 | .78*** | – | 83.70 (26.62) | ||||||||||||
| 9. Parental monitoring (P) | −.10 | .01 | −.29*** | −.08 | −.11 | .04 | −.14* | −.17** | – | 78.03 (7.94) | |||||||||||
| 10. Parent monitoring (Y) | −.05 | .10 | −.13 | −.14 | −.08 | −.14 | −.14 | −.18* | .41*** | – | 77.08 (8.46) | ||||||||||
| 11. % of BG observed or discussed (P) | .02 | −.11 | −.26*** | .11 | −.11 | .08 | .07 | .00 | .34*** | .31*** | – | 59.84 (23.65) | |||||||||
| 12. % of BG observed or discussed (Y) | −.17** | −.03 | −.21** | −.05 | −.05 | −.05 | −.01 | −.08 | .26*** | .19* | .37*** | – | 57.66 (21.86) | ||||||||
| 13. Conflict (P) | .19** | −.25*** | .10 | .29*** | .04 | .06 | .43*** | .44*** | −.20** | −.19* | .00 | −.11 | – | 25.89 (6.99) | |||||||
| 14. Conflict (Y) | .14* | −.22*** | −.09 | .11 | −.05 | .04 | .18** | .06 | .03 | .01 | .15* | .05 | .19** | – | 28.24 (11.16) | ||||||
| 15. Adherence (P) | −.17** | .29*** | −.14* | −.38*** | .03 | −.27*** | −.14* | −.16* | .27*** | .23** | .03 | .13* | −.27*** | −.14* | – | .67 (.11) | |||||
| 16. Adherence (Y) | −.10 | .24*** | −.09 | −.23*** | .03 | −.26*** | −.16* | −.13* | .13* | .27*** | .07 | .21** | −.22*** | −.11 | .39*** | – | .63 (.13) | ||||
| 17. BG checks (P) | −.15* | .27*** | −.27*** | −.16* | −.07 | −.31*** | −.06 | −.10 | .23** | .32*** | .09 | .19** | −.20** | −.03 | .38*** | .27*** | – | 4.30 (1.51) | |||
| 18. BG checks. (Y) | −.11 | .31*** | −.19** | −.15* | .05 | −.31*** | −.10 | −.10 | .12 | .30*** | .03 | .18** | −.14* | −.07 | .35*** | .26*** | .79*** | – | 4.34 (1.53) | ||
| 19. HbA1c (baseline) | .27*** | −.35*** | .13* | .23*** | −.02 | .14* | .15* | .14* | −.20** | −.20** | .13* | −.01 | .39*** | .15* | −.30*** | −.17** | −.33*** | −.29*** | – | 8.80% (1.61%) | |
| 20. HbA1c (3 months) | .21** | −.29*** | .14* | .24*** | −.01 | .19** | .20** | .18** | −.18** | −.19* | .00 | −.06 | .39*** | .14* | −.24*** | −.19** | −.32*** | −.29*** | .78*** | – | 8.93% (1.54%) |
Notes. P = parent report, Y = youth report, *p < .05, **p < .01, ***p < .001
aSES = Socioeconomic status, higher scores indicate higher SES.
bCoded as White = 0, Other = 1.
cCoded as Male = 0, Female = 1.
dCoded as Intensive = 0, Conventional = 1.
Model Testing
The hypothesized measurement model consisted of five latent variables. The first, parenting stress, included parental report of the frequency and difficulty of stress from the PIP. The second construct, diabetes-related conflict, consisted of parent and youth report of conflict from the DFCS-R. A third construct of parental monitoring was composed of parent and youth reports from the PMDC and parent/youth reports of the percentage of observed/discussed blood glucose monitoring from the 24-hr DI. A fourth latent variable, regimen adherence, included parent and youth report of diabetes regimen adherence from the DBRS and parent/youth report of the average number of blood glucose checks/day from the 24-hr DI. A fifth construct, glycemic control, included two A1c values obtained at baseline and 3 months later. The complete measurement model is depicted in Figure 1.
An initial SEM analysis contained three observed demographic variables of MS (i.e., single-parent status), FD, and SES, but did not fit the data well. Inspection of the model revealed similar paths from the MS and the SES variables to stress and conflict, such that single-parent status and lower SES demographic variables were not statistically distinctive from one another. Further, SES showed stronger path coefficients, such that MS was removed from the model to improve model convergence. The proposed model still did not fit the data well, as indicated by fit indices that exceeded suggested ranges [χ2 (67) = 148.98, p < .001, CFI = .93, TLI = .90, RMSEA = .07, SRMR = .07]. However, all indicators sufficiently loaded onto the hypothesized latent constructs (β > .38, p < .001), except the youth report of diabetes-related conflict (β = .25, p = .001). To improve model fit in accordance with Mplus modification guidelines, covariance of error terms were added for parent and youth reports of regimen adherence, number of blood glucose checks, and the percentage of observed/discussed blood glucose checks. Another covariance of error term was added between parent report of the percentage of observed/discussed blood glucose checks and the baseline A1c value. All added covariances were based on literature and were theoretically robust (Herge et al., 2012). With the added covariances, the measurement model fit the data well [χ2 (63) = 81.36, p = .06, CFI = .98, TLI = .98, RMSEA = .03, SRMR = .05; see Figure 1].
A hybrid SEM model that included observed exogenous variables and significant covariates demonstrated acceptable fit with the data [χ2 (122) = 207.56, p < .001, CFI = .93, TLI = .91, RMSEA = .06, SRMR = .08; see Figure 2]. Higher FD was significantly related to more diabetes-related conflict (β = .17, p = .038). In turn, more diabetes-related conflict was associated with less regimen adherence (β = −.54, p < .001) and poorer glycemic control (β = −.29, p = .014). The total indirect path between FD and glycemic control was significant (β = .11, p = .035). Next, families from a lower SES reported higher levels of parenting stress (β = −.14, p = .018) and more diabetes-related conflict (β = −.36, p < .001). The total indirect path between SES and glycemic control was significant (β = −.20, p = .009). However, FD and SES were not significantly associated with glycemic control directly (β = .06, p = .394, β = −.03, p = .735, respectively). Finally, both higher levels of parental monitoring and parenting stress were associated with greater regimen adherence (β = .44, p < .001, β = .12, p = .044, respectively).
Figure 2.

Family density and SES relations to diabetes management and glycemic control.
Notes. Numbers are standardized path estimates. *p < .05, **p < .01, ***p < .001. aSES (socioeconomic status) coded as higher scores indicated higher SES. bAge in years. cCoded as White = 0, Other = 1. dCoded as Intensive = 0, Conventional = 1.
Less diabetes-related conflict and less parenting stress were associated with White ethnicity (β = .32, p < .001, β = .15, p = .011, respectively). Greater regimen adherence was associated with the use of an intensive insulin regimen (β = .27, p = .002). Higher levels of parental monitoring were associated with younger youth age (β = −.41, p < .001). Overall, the model accounted for 6% of the variance in parenting stress, 24% of the variance in parental monitoring, 37% of the variance in diabetes-related conflict, 73% of the variance in regimen adherence, and 45% of the variance in A1c.
Post hoc analyses were conducted to ascertain the utility of different classifications of family structure. First, a multiple regression was conducted with MS, FD, and SES as independent variables and A1c as the dependent variable. Regression results confirmed that MS (β = .018, p = .815) did not provide information about A1c beyond SES (β = −.314, p < .001) and FD (β = .212, p = .003). Order of entry of the family structure variable, i.e., MS or FD, did not change the results (Table II). Next, a hierarchical regression was calculated to determine the additional effects of FD on A1c after controlling SES. After introduction of SES in Step 1, FD added unique variance to the model in Step 2, F(1, 232) = 10.94, p = .001; ΔR2 = .039. The final model with both SES and FD significantly related to A1c (p = .001) and accounted for 16.4% variance. Finally, a 2 × 2 analysis of variance (ANOVA) of MS (single-parent vs. two-parent) and FD (higher >2 vs. lower) evaluated overlap between the two family structure concepts and their corresponding A1cs. ANOVA revealed a main effect of FD (F(1, 240) = 11.50, p = .001) but not MS; the interaction term also was not significant. Table III shows the ANOVA results.
Discussion
Family structure indictors of MS and FD were evaluated, along with frequently confounded SES, to better understand the roles of each in youth diabetes care and glycemic control. In the SEM model proposed, MS did not provide unique information beyond SES and was removed from the final model. In contrast, the novel indicator of FD was related to both youth diabetes care and glycemic control, beyond the well-established effects of SES. Specifically, both higher FD and lower SES were associated with more diabetes-related conflict that in turn related directly and indirectly to poorer glycemic control; the latter indirect path occurred via less adherent behaviors. Together, sociodemographic factors of FD and SES explained 16% of the variance in glycemic control (Figure 2). Unlike SES, higher FD was not related to more parental stress. Lower SES families had parents who reported higher stress. Interestingly, neither sociodemographic factor of FD nor SES related to parental monitoring, which may have positive implications for clinical efforts to improve youth adherence. Parental monitoring appears free of measured sociodemographic factors that frequently can impede clinical care.
Higher diabetes-related conflict is consistently related to both poorer adherence and glycemic control in the literature (Hilliard et al., 2011, 2013; Wysocki, 1993). As expected, in the present study, both higher FD and lower SES related to higher conflict that in turn related both directly and indirectly to poorer glycemic control; the latter via poorer diabetes adherence. Lower SES is known to have adverse educational and financial associations with poorer health outcomes across a broad age span and array of illnesses (Adler et al., 1994), including diabetes (Overstreet et al., 1995; Swift et al., 2006). New to this literature, the present study shows higher FD, above and beyond SES, is another sociodemographic risk factor related to more diabetes-related conflict and, ultimately, to poorer diabetes adherence and glycemic control.
In contrast, FD did not relate to more parenting stress, although lower SES did. The association of lower SES, but not higher FD, implicates the educational and financial strains posed by parenting a youth with a relatively complex and expensive chronic medical condition (Mullins et al., 2011; Overstreet et al., 1995; Powell et al., 2013). Interestingly, a relation was found between more parenting stress and better youth adherence. Mild elevations of stress may activate parental arousal to foster better youth adherence in this predominantly middle-class sample, even though more stress in other samples is associated with a number of risk factors including poorer parental mental health (Helgeson et al., 2012). As parents play a crucial role in the healthy development and diabetes management of their youth (Mackey et al., 2014), awareness of level of parenting stress should be considered in the clinical management of youth.
Finally, neither sociodemographic factor of FD nor SES related to parental monitoring of youth diabetes care behaviors. The relative independence of parental monitoring from these two generally unalterable demographic features may have favorable implications for interventions because more parental monitoring consistently relates to better youth adherence (Berg et al., 2008; Ellis et al., 2007; Palmer et al., 2011). In the present study, more parental monitoring related directly to greater disease adherence, as expected, and indirectly related to better glycemic control. The independence of these associations from the sociodemographic constraints of FD and SES potentially opens a promising avenue of intervention for preadolescent youth. Interventions that focus on sustained parental monitoring throughout adolescence may avoid age-related decline in parental monitoring and a corresponding decline in youth adherence that often occurs (Holmes et al., 2014). Interestingly, more diabetes-related conflict related to less parental monitoring and again underscores the adverse and potentially pervasive relations of diabetes-related conflict to daily disease management. As noted, family conflict warrants immediate clinical attention.
Given the novelty of the FD construct versus the more traditionally studied construct of MS, differences in the conceptualization of family structure were evaluated post hoc to determine their degree of overlap and differences in youth glycemic control. Table II reflects FD was the only family structure indicator beyond SES that related to glycemic control in youth, although it accounted for less variance than SES. Further, when the two family structure classifications were compared for overlap, youth from higher-density families, whether single- or two-parent, experienced poorer glycemic control than those from lower-density families, regardless of MS (see Table III). These additional findings support the contention that FD may better reflect salient family structure features related to disease management than MS. These results also support the decision to remove MS from the current study’s initial SEM model when the model did not converge. Beyond its potentially greater precision, the FD construct also may reduce perceived family social stigma that may be associated with single-parent status. Higher FD could be a more objective reflection of the demands on available parental time than single-parent status. The current demographic trend toward a greater likelihood that youth will live in a single-parent home at some point during their childhood (U.S. Census Bureau, 2012) suggests that methods to better represent family structure risk, perhaps with FD, could be both more accurate and potentially more useful clinically.
Established patterns of SES-related diabetes functioning were confirmed in this study and anchor FD as an additional demographic indicator to weigh in the treatment of youth with diabetes. Earlier calls were made for more study of single parents to understand the poorer disease status of youth with chronic illnesses (Brown et al., 2008) along with consideration of other family constellations such as blended families (Powell & Holmes, 2013). However, FD may prove to be a better demographic refinement over MS that better accounts for relevant diabetes management, at least within predominantly middle-class samples such as the present one. Importantly, FD related to glycemic status above and beyond the associations found with SES, suggesting it adds unique information to understanding pediatric glycemic control. Overall, the SEM model accounted for 73% of the variance in regimen adherence, and 45% of the variance in A1c.
Although potential risk factors for poorer glycemic control are identified, these cross-sectional data dictate that no causal or bidirectional relations can be inferred among the variables. Future research should examine these constructs longitudinally. Additionally, families in this sample were recruited as part of an 18-month treatment study with multiple assessments, such that that this sample may not be representative of the general population of adolescents with T1D. Similarly, limited variability in SES reduces generalization to those primarily from middle- or upper-class families. Future studies may wish to examine these relations across broader socioeconomic and developmental age ranges. Despite these limitations, strengths include the use of multisource youth and parent reports of key diabetes care factors along with inclusion of SES measurement. Further, comprehensive SEM analysis allowed modeling of simultaneous interrelations of demographic and disease management factors related to glycemic control.
Funding
This work was supported by funding from the National Institute of Diabetes and Digestive and Kidney Diseases at the National Institutes of Health (5R01DK070917 to C.H.).
Conflicts of interest: None declared.
References
- Adler N. E., Boyce T., Chesney M., Cohen S., Folkman S., Kahn R., Syme S. L. (1994). Socioeconomic status and health: The challenge of the gradient. American Psychologist, 49, 15–24. [DOI] [PubMed] [Google Scholar]
- American Diabetes Association. (2011). Living with diabetes: Complications. Retrieved from http://www.diabetes.org/living-with-diabetes/complications/?loc=DropDownLWD-complications
- Berg C. A., Butler J. M., Osborn P., King G., Palmer D. L., Butner J., Murray M., Lindsay R., Donaldson D., Foster C., Swinyard M., Wiebe D. J. (2008). Role of parental monitoring in understanding the benefits of parental acceptance on adolescent adherence and metabolic control of type 1 diabetes. Diabetes Care, 31, 678–683. [DOI] [PubMed] [Google Scholar]
- Brown R. T., Wiener L., Kupst M. J., Brennan T., Behrman R., Compas B. E., David Elkin T., Fairclough D. L., Friebert S., Katz E., Kazak A. E., Madan-Swain A., Mansfield N., Mullins L. L., Noll R., Patenaude A. F., Phipps S., Sahler O. J., Sourkes B., Zeltzer L. (2008). Single parents of children with chronic illness: An understudied phenomenon. Journal of Pediatric Psychology, 33, 408–421. [DOI] [PMC free article] [PubMed] [Google Scholar]
- Chisholm V., Atkinson L., Donaldson C., Noyes K., Payne A., Kelnar C. (2007). Predictors of treatment adherence in young children with type 1 diabetes. Journal of Advanced Nursing, 57, 482–493. [DOI] [PubMed] [Google Scholar]
- Conger R. D., Donnellan M. B. (2007). An interactionist perspective on the socioeconomic context of human development. Annual Review of Psychology, 58, 175–199. [DOI] [PubMed] [Google Scholar]
- Dodgson J. E., Garwick A., Blozis S. A., Patterson J. M., Bennett F. C., Blum R. W. (2000). Uncertainty in childhood chronic conditions and family distress in families of young children. Journal of Family Nursing, 6, 252–266. [Google Scholar]
- Drew L., Berg C., King P., Verdant C., Griffith K., Butler J., Wiebe D. (2011). Depleted parental psychological resources as mediators of the association of income with adherence and metabolic control. Journal of Family Psychology, 5, 751–758. [DOI] [PMC free article] [PubMed] [Google Scholar]
- Ellis D. A., Podolski C. L., Frey M., Naar-King S., Wang B., Moltz K. (2007). The role of parental monitoring in adolescent health outcomes: Impact on regimen adherence in youth with type 1 diabetes. Journal of Pediatric Psychology, 32, 907–917. [DOI] [PubMed] [Google Scholar]
- Ellis D. A., Templin T., Podolski C. L., Frey M., Naar-King S., Moltz K. (2008). The Parental Monitoring of Diabetes Care Scale: Development, reliability and validity of a scale to evaluate parental supervision of adolescent illness management. Journal of Adolescent Health, 42, 146–153. [DOI] [PubMed] [Google Scholar]
- Freund A., Johnson S. B., Silverstein J., Thomas J. (1991). Assessing daily management of childhood diabetes using 24-hour recall interviews: Reliability and stability. Health Psychology, 10, 200–208. [DOI] [PubMed] [Google Scholar]
- Gallo L., Mathews K. (2003). Understanding the association between socioeconomic status and physical health: Do negative emotions play a role?. Psychological Bulletin, 129, 10–51. [DOI] [PubMed] [Google Scholar]
- Helgeson V.S., Becker D., Escobar O., Siminerio L. (2012). Families with children with diabetes: Implications of parent stress for parent and child health. Journal of Pediatric Psychology, 37, 467–478. [DOI] [PMC free article] [PubMed] [Google Scholar]
- Herge W. M., Streisand R., Chen R., Holmes C., Kumar A., Mackey E. R. (2012). Family and youth factors associated with health beliefs and health outcomes in youth with type 1 diabetes. Journal of Pediatric Psychology, 37, 980–989. [DOI] [PMC free article] [PubMed] [Google Scholar]
- Hilliard M. E., Guilfoyle S. M., Dolan L. M., Hood K. K. (2011). Prediction of adolescents’ glycemic control 1 year after diabetes-specific family conflict. Archives of Pediatrics and Adolescent Medicine, 165, 624–629. [DOI] [PMC free article] [PubMed] [Google Scholar]
- Hilliard M. E., Holmes C. S., Chen R., Maher K., Robinson E., Streisand R. (2013). Disentangling the roles of parental monitoring and family conflict in adolescents' management of type 1 diabetes. Health Psychology, 32, 388–396. [DOI] [PMC free article] [PubMed] [Google Scholar]
- Hollingshead A. B. (1975). Four factor index of social status. Unpublished manuscript, Yale University, New Haven, CT. [Google Scholar]
- Holmes C. S., Chen R., Mackey E., Grey M., Streisand R. (2014). A randomized clinical trial of clinic-integrated, low-intensity treatment to prevent deterioration of disease care in adolescents with type 1 diabetes. Diabetes Care, 37, 1535–1543. [DOI] [PMC free article] [PubMed] [Google Scholar]
- Holmes C. S., Chen R., Streisand R., Marschall D. E., Souter S., Swift E. E., Peterson C.C. (2006). Predictors of youth diabetes care behaviors and metabolic control: A structural equation modeling approach. Journal of Pediatric Psychology, 31, 770–784. [DOI] [PubMed] [Google Scholar]
- Hood K. K., Butler D. A., Anderson B. J., Laffel L. M. B. (2007). Updated and revised diabetes family conflict scale. Diabetes Care, 30, 1764–1769. [DOI] [PMC free article] [PubMed] [Google Scholar]
- Hood K. K., Rausch J. R., Dolan L. M. (2011). Depressive symptoms predict change in glycemic control in adolescents with type 1 diabetes: Rates, magnitude, and moderators of change. Pediatric Diabetes, 12, 718–723. [DOI] [PubMed] [Google Scholar]
- Hu L. T., Bentler P. M. (1999). Cutoff criteria for fit indexes in covariance structure analysis: Conventional criteria versus new alternatives. Structural Equation Modeling: A Multidisciplinary Journal, 6, 1–55. [Google Scholar]
- Iannotti R. J., Nansel T. R., Schneider S., Haynie D. L., Simons-Morton B., Sobel D. O., Zeitzoff L., Plotnick L. P., Clark L. (2006). Assessing regimen adherence of adolescents with type 1 diabetes. Diabetes Care, 29, 2263–2267. [DOI] [PubMed] [Google Scholar]
- Johnson S. B., Silverstein J., Rosenbloom A., Carter R., Cunningham W. (1986). Assessing daily management of childhood diabetes. Health Psychology, 5, 545–564. [DOI] [PubMed] [Google Scholar]
- Kenny D. A. (1995). The effect of nonindependence on significance testing in dyadic research. Personal Relationships, 2, 67–75. [Google Scholar]
- Kline R. B. (2011). Principles and practice of structural equation modeling (3rd ed.). New York, NY: Guilford. [Google Scholar]
- Lewin A. B., Storch E. A., Silverstein J. H., Baumeister A. L., Strawser M. S., Geffken G. R. (2005). Validation of the pediatric inventory for parents in mothers of children with type 1 diabetes: An examination of parenting stress, anxiety, and childhood psychopathology. Families, Systems, and Health, 23, 56–65. [Google Scholar]
- Liaw F., Brooks-Gunn J. (1994). Cumulative familial risks and low-birthweight children's cognitive and behavioral development. Journal of Clinical Child Psychology, 23, 360–372. [Google Scholar]
- Mackey E., Streumph K., Powell P., Chen R., Streisand R., Holmes C. S. (2014). Maternal depressive symptoms and disease care status in youth with type 1 diabetes. Health Psychology, 33, 783–791. [DOI] [PMC free article] [PubMed] [Google Scholar]
- Menke A., Orchard T. J., Imperatore G., Bullard K. M., Mayer-Davis E., Cowie C. C. (2013). The prevalence of type 1 diabetes in the United States. Epidemiology (Cambridge, Mass.), 24773–24774. [DOI] [PMC free article] [PubMed] [Google Scholar]
- Mullins L. L., Wolfe-Christensen C., Chaney J. M., Elkin T. D., Wiener L., Hullmann S. E., Fedel D. A., Junghans A. (2011). The relationship between single-parent status and parenting capacities in mothers of youth with chronic health conditions: The mediating role of income. Journal of Pediatric Psychology, 36, 249–257. [DOI] [PubMed] [Google Scholar]
- Muthen L. K., Muthen B. O. (1998–2010). Mplus user’s guide (6th ed.). Los Angeles, CA: Muthen & Muthen. [Google Scholar]
- Nathan D. M., & DCCT/EDIC Research Group. (2014). The diabetes control and complications trial/epidemiology of diabetes interventions and complications study at 30 years: Overview. Diabetes Care, 37, 9–16. [DOI] [PMC free article] [PubMed] [Google Scholar]
- Overstreet S., Goins J., Chen R., Holmes C. S., Greer T., Dunlap W. P., Frentz J. (1995). Family environment and the interrelation of family structure, child behavior, and metabolic control for children with diabetes. Journal of Pediatric Psychology, 20, 435–447. [DOI] [PubMed] [Google Scholar]
- Palmer D. L., Osborn P., King P. S., Berg C. A., Butler J., Butner J., Horton D., Wiebe D. J. (2011). The structure of parental involvement and relations to disease management for youth with type 1 diabetes. Journal of Pediatric Psychology, 36, 596–605. [DOI] [PMC free article] [PubMed] [Google Scholar]
- Powell P. W., Chen R., Kumar A., Streisand R., Holmes C. S. (2013). Sociodemographic effects on biological, disease care, and diabetes knowledge factors in youth with type 1 diabetes. Journal of Child Health Care, 17, 174–185. [DOI] [PubMed] [Google Scholar]
- Powell P. W., Holmes C. S. (2008). Letter to the editor: Single parents of children with chronic illness: An understudied phenomenon. Journal of Pediatric Psychology, 33, 797–798. [DOI] [PubMed] [Google Scholar]
- Quittner A. L., Modi A. C., Lemanek K. L., Ievers-Landis C. E., Rapoff M. A. (2008). Evidence-based assessment of adherence to medical treatments in pediatric psychology. Journal of Pediatric Psychology, 33, 916–936. [DOI] [PMC free article] [PubMed] [Google Scholar]
- Schilling L. S., Knafl K. A., Grey M. (2006). Changing patterns of self-management in youth with type I diabetes. Journal of Pediatric Nursing, 21, 412–424. [DOI] [PubMed] [Google Scholar]
- Streisand R., Braniecki S., Tercyak K.P., Kazak A.E. (2001). Childhood illness related parenting stress: The pediatric inventory for parents. Journal of Pediatric Psychology, 26, 155–162. [DOI] [PubMed] [Google Scholar]
- Streisand R., Swift E., Wickmark T., Chen R., Holmes C. S. (2005). Pediatric parenting stress among parents of children with type 1 diabetes: The role of self-efficacy, responsibility, and fear. Journal of Pediatric Psychology, 30, 513–521. [DOI] [PubMed] [Google Scholar]
- Swift E. E., Chen R., Hershberger A., Holmes C. S. (2006). Demographic risk factors, mediators, and moderators in youths' diabetes metabolic control. Annals of Behavioral Medicine: A Publication of the Society of Behavioral Medicine, 32, 39–49. [DOI] [PubMed] [Google Scholar]
- Tamborlane W.V., Kollman C., Steffes M.W., Ruedy K.J., Dongyuan X., Beck R.W., Chase P., Fox L. A., Wilson D. M., Tsalikian E., Diabetes Research in Children Network (DirecNet) Study Group (2005). Comparison of fingerstick hemoglobin A1c levels assayed by DCA 2000 with the DCCT/EDIC central laboratory assay: Results of a diabetes research in children network (DirecNet) study. Pediatric Diabetes, 6, 13–16. [DOI] [PubMed] [Google Scholar]
- Thompson S. J., Auslander W. F., White N. H. (2001). Comparison of single mother and two-parent families on metabolic control of children with diabetes. Diabetes Care, 24, 234–238. [DOI] [PubMed] [Google Scholar]
- U.S. Census Bureau. (2012). America’s families and living arrangements: 2012. Retrieved from: http://www.census.gov/hhes/families/data/cps2012.html
- Wysocki T. (1993). Associations among teen-parent relationships, metabolic control, and adjustment to diabetes in adolescents. Journal of Pediatric Psychology, 18, 441–452. [DOI] [PubMed] [Google Scholar]