

Abstract
Background. A heightened proinflammatory state has been hypothesized to enhance human immunodeficiency virus type 1 (HIV-1) transmission – both susceptibility of HIV-1-exposed persons and infectiousness of HIV-1-infected persons.
Methods. Using prospective data from heterosexual African couples with HIV-1 serodiscordance, we conducted a nested case-control analysis to assess the relationship between cytokine concentrations and the risk of HIV-1 acquisition. Case couples (n = 120) were initially serodiscordant couples in which HIV-1 was transmitted to the seronegative partner during the study; control couples (n = 321) were serodiscordant couples in which HIV-1 was not transmitted to the seronegative partner. Differences in a panel of 30 cytokines were measured using plasma specimens from both HIV-1–susceptible and HIV-1–infected partners. Plasma was collected before seroconversion for cases.
Results. For both HIV-1–infected and HIV-1–susceptible partners, cases and controls had significantly different mean responses in cytokine panels (P < .001, by the Hotelling T2 test), suggesting a broadly different pattern of immune activation for couples in which HIV-1 was transmitted, compared with couples without transmission. Individually, log10 mean concentrations of interleukin 10 (IL-10) and CXCL10 were significantly higher for both HIV-1–susceptible and HIV-1–infected case partners, compared with HIV-1–susceptible and HIV-1–infected control partners (P < .01 for all comparisons). In multivariate analysis, HIV-1 transmission was significantly associated with elevated CXCL10 concentrations in HIV-1–susceptible partners (P = .001) and with elevated IL-10 concentrations in HIV-1–infected partners (P = .02).
Conclusions. Immune activation, as measured by levels of cytokine markers, particularly elevated levels of IL-10 and CXCL1, are associated with increased HIV-1 susceptibility and infectiousness.
Keywords: HIV-1 acquisition, immune activation, Africa
Immune activation, characterized by polyclonal B-cell activation, accelerated T-cell turnover, dendritic cell depletion, and elevated proinflammatory cytokine levels, is a hallmark of human immunodeficiency virus type 1 (HIV-1) infection [1]. Immune stimulation by HIV-1 contributes to the depletion of CD4+ T cells, rather than to the purging of virus, and has been associated with accelerated progression of HIV-1 disease [2–5]. The dysregulation of cytokines, important markers of immune activation, has been shown to contribute to viral replication and disease progression [6, 7]. While the relationship between HIV-1 pathogenesis and persistent immune activation has been well described [1, 2], the role of systemic inflammatory response and immune activation in HIV-1 transmission is less understood. Increased immune activation in persons infected with HIV-1 could result in increased viral replication that could facilitate HIV-1 infectiousness and onward transmission [8, 9], but no data have directly explored this hypothesis. Furthermore, for HIV-1–uninfected persons, immune activation and an elevated inflammatory response before infection has also been hypothesized to potentially heighten susceptibility and facilitate HIV-1 acquisition; however, few studies have directly compared systemic immune activation between those who acquire HIV-1 and those who are exposed but remain uninfected with HIV-1. Naranbhai et al found significant association between markers of systemic immune activation, including cytokine concentrations, and HIV-1 acquisition among women [10], but few other data are available on the role of systemic immune function in HIV-1 acquisition or transmission.
Insight into the roles of innate and adaptive immune functions and HIV-1 susceptibility and infectiousness is an important factor in the development of effective prophylactic and therapeutic HIV-1 vaccines, as well as strategies for HIV-1 prevention, such as preexposure prophylaxis and microbicides. Findings from the Step HIV-1 vaccine trial showed that, in a prime-boost HIV-1 vaccine strategy based on an adenovirus type 5 (Ad5) vector, there was a trend toward increased HIV-1 acquisition among Ad5-seropositive individuals. This finding indicated that the amnestic immune response elicited was harmful [11], suggesting a challenge for vaccine development and a critical need to better understand how immune activation affects HIV-1 transmission. In African populations, where both HIV-1 infection and other infectious diseases are frequently prevalent, chronic immune activation may be heightened by the presence of other infections, both systemic and mucosal, that could contribute to increased susceptibility and infectiousness [12].
The aim of the present study was to assess whether differences in markers of immune activation, as measured by a data from a panel of cytokines, were associated with an increased risk of HIV-1 transmission among heterosexual HIV-1–serodiscordant couples. Assessment of these factors in cases of virologically linked HIV-1 transmission in a prospective cohort of HIV-1–serodiscordant couples permitted simultaneous evaluation of the relationship between systemic immune activation and both the heightened susceptibility of HIV-1–uninfected partners and the infectiousness of HIV-1–infected partners.
METHODS
Study Population
We conducted a nested case-control study, using data from 2 prospective studies of African HIV-1–serodiscordant couples. Between November 2004 and April 2007, heterosexual HIV-1–serodiscordant couples from 6 African countries (Botswana, Kenya, South Africa, Tanzania, Uganda, and Zambia) were enrolled into the Partners in Prevention HSV/HIV Transmission Study, a randomized, double-blind, placebo-controlled clinical trial of herpes simplex virus type 2 (HSV-2) suppressive therapy to reduce HIV-1 transmission, as previously described [13]. HSV-2 suppressive therapy was found not to reduce HIV-1 transmission within the partnerships [14]. In a parallel study at 2 sites (Kampala, Uganda, and Soweto, South Africa), HIV-1–serodiscordant couples were enrolled into an observational study of immune correlates of HIV-1 protection (Couples Observational Study) [15]. In both studies, participants were ≥18 years of age and sexually active, and HIV-1–seropositive partners were not using antiretroviral therapy at the time of study entry. HIV-1–uninfected participants were followed up quarterly with HIV-1 serologic testing.
Protection of Human Subjects
All participants received HIV-1 and risk-reduction counseling (both individually and as a couple), free condoms, and treatment for sexually transmitted infections (STIs), according to World Health Organization guidelines. Written informed consent was obtained from all participants. The study protocols were approved by the University of Washington Human Subjects Review Committee and ethical review committees at each of the study sites.
Selection of Cases and Controls
Cases were couples in which HIV-1 was transmitted to the seronegative partner during the study, as confirmed by viral sequencing [16]. Cases consisted of 120 couples: 105 from the Partners in Prevention HSV/HIV Transmission Study and 15 from the Couples Observational Study. Controls were couples in which HIV-1 was not transmitted to the seronegative partner. Controls were selected randomly from each of the 2 contributing studies in proportion to research site and sex distribution to be representative of the entire cohort of nonseroconverting couples. In total, 321 controls were sampled (approximately 2.5:1 ratio of controls to cases). For both cases and controls, both the HIV-1–infected member and the partner who acquired HIV-1 infection (among cases) or the partner who remained uninfected (among controls) were included.
Laboratory Testing
HIV-1 seroconversion of initially HIV-1–uninfected partners was confirmed by dual rapid HIV-1 antibody tests, enzyme immunoassay, Western blot, and plasma HIV-1 RNA detection. Plasma HIV-1 RNA levels for HIV-1–infected partners were quantified using the COBAS Ampliprep/COBAS TaqMan real-time HIV-1 RNA assay, version 1.0 (Roche Diagnostics, Indianapolis, Indiana).
Serum was collected at quarterly study visits and archived at −80°C for subsequent laboratory testing. For the present analysis, archived blood plasma samples from cases were selected from the visits immediately before the first evidence of HIV-1 infection (among cases, the initially HIV-1–uninfected partner had a negative result of a serological tests for HIV-1 and undetectable plasma HIV-1 RNA at this visit), to evaluate immune activation before HIV-1 transmission. Blood plasma specimens were collected for storage at quarterly visits, and the mean time between preseroconversion sample collection and HIV-1 infection among cases was three months. For controls, a single blood plasma sample per subject was selected, with the timing during follow-up selected so that the proportion of study months across controls was similar to visit months for the cases. Study visits from which control samples were selected occurred a mean of 6.5 months after enrollment. For both cases and controls, the mean time between sample collection and testing was 4 years. Samples were tested from both HIV-1–infected and uninfected partners. Immune activation was assessed from a standard panel of 30 cytokine analytes: T-helper type 1 cells (interferon γ [IFN-γ], interleukin 2 [IL-2], interleukin 7 [IL-7], interleukin 15 [IL-15], scd40l, Th2 cells (interleukin 4, interleukin 5, and interleukin 13), immunomodulatory cytokines (interleukin 1Rα, interleukin 10 [IL-10], interleukin 12p40 [IL-12p40], IL-12p70, and interleukin 17 [IL-17]), proinflammatory cytokines (IL-1α, IL-1β, interleukin 6, and CXCL8), chemokines (CCL11, CX3CL1, CXCL10, CCL3, CCL4, and tumor necrosis factor α [TNF-α]), and growth factors (epidermal growth factor [EGF], granulocyte colony-stimulating factor [G-CSF], granulocyte macrophage colony-stimulating factor, vascular endothelial growth factor, CCL2, and transforming growth factor α) [17]. Levels were measured using Luminex multiplex technology (Milliplex Human Cytokine/Chemokine panel, Millipore, Billerica, Massachusetts), and standard curves were analyzed using the nCal package (http://research.fhcrc.org/youyifong/en/resources/ncal.html) in the R statistical programming system [18]. The standard cytokine panel included potentially redundant and noninformative cytokines relative to our outcome of interest, but we included all cytokines from the panel for hypothesis-developing exploratory analysis of potential relationships between cytokines and HIV-1 risk. Plasma specimens were assayed in duplicate without dilution. Cytokine concentrations were measured in picograms per milliliter. Assays were performed blinded to case and control status.
Statistical Analysis
Cytokine concentrations were log10 transformed, and results below the limit of quantification were assigned a value of half the limit of detection. The relationship between immune activation and HIV-1 susceptibility (using data from partners who were initially uninfected with HIV-1) and HIV-1 infectiousness (using data from HIV-1–infected partners) were initially analyzed separately. Hotelling T2 tests were performed to test for the global equality of mean cytokine concentrations between cases and controls. To assess differences in specific cytokine concentrations, 2-sided Student t tests were used to compare mean concentrations of each of the 30 cytokine analytes between cases and controls. P values were adjusted for multivariate comparisons, using a permutation method, because standard methods for controlling for multiple comparisons are overly conservative when using highly correlated data (ie, interrelated cytokine concentrations) [19]. Cytokine analytes individually found to be significantly associated with seroconversion after controlling for multiple comparisons were then assessed as covariates in a multiple logistic regression (with case-control status as the outcome), with adjustment for important demographic, clinical, and behavioral predictors of HIV-1 risk in this population. Selected covariates were those determined to be associated with an increased risk of HIV-1 transmission and with differential cytokine concentrations. Confounders included in multivariate model were sex of the HIV-1 uninfected partner and, at the study visit selected for cytokine assessment, plasma HIV-1 RNA concentrations in the HIV-1–infected partner, report of unprotected sex in the partnership, and syndromic diagnosis of a STI, including urethritis, cervicitis, vaginitis, genital ulcer disease, pelvic inflammatory disease, genital herpes, or lymphogranuloma venereum, in either partner. Finally, we performed additional multivariate logistic regressions that included the cytokine concentrations for both partners, to assess the potential contribution of each cytokine to the risk of HIV-1 transmission within the partnership. To determine which, if any, cytokine concentrations were significantly associated with either HIV-1 transmission or acquisition risk, we used Spearman rank-order correlation and plotted the cytokine concentrations with a regression line. Analyses were performed using SAS v.9.3 (SAS Institute, Cary, North Carolina) and Prism graphing software (GraphPad Software, La Jolla, Carolina).
RESULTS
Cytokine results were available for 441 HIV-1 serodiscordant couples (120 cases, and 321 controls). One HIV-1–uninfected control partner was excluded because their sample could not be analyzed. Most couples (93.2%) were married or living with their HIV-1–infected partner, and two-thirds were from eastern Africa (Table 1). A minority of individuals—33 HIV-1–susceptible partners (10.3%) and 49 HIV-1–infected partners (15.3%)—had symptoms indicating an STI at the visit selected for cytokine testing. Compared with controls, cases were more likely to report unprotected sex (41.7% vs 19.0%; P < .001). For susceptible partners, those who acquired HIV-1 were more likely than those who remained HIV-1 uninfected to have a syndromic STI diagnosis at study visit (15.0% vs 4.7%; P = .002). Compared with HIV-1–infected control partners, HIV-1–infected case partners had higher median plasma HIV-1 RNA concentrations (4.9 vs 4.0 log10 copies/mL; P < .001).
Table 1.
Characteristics of the Nested Case-Control Population, Overall and by Human Immunodeficiency Virus Type 1 (HIV-1) Status
| Status, Characteristic | Couples With HIV-1 Acquisition, (n = 120) | Couples Without HIV-1 Acquisition, (n = 321) | P Valuesa |
|---|---|---|---|
| Overall | |||
| Female sex, HIV-1–infected partner | 60 (50.0) | 114 (35.5) | .006 |
| East African (vs southern African) | 79 (65.8) | 219 (68.2) | .2 |
| Married/living with HIV-1–infected partner | 112 (93.3) | 299 (93.2) | .5 |
| No. of children in partnership | 1 (0–2) | 1 (0–2) | <.001 |
| Unprotected sex at visit selected for cytokine testing | 50 (41.7) | 61 (19.0) | <.001 |
| HIV-1 susceptible | |||
| Age, y | 29 (24–37) | 33 (28–41) | <.001 |
| Any syndromic diagnosis of genital tract infectionb | 18 (15.0) | 15 (4.7) | <.001 |
| HIV-1 infected | |||
| Age, y | 30 (26–35) | 33 (27–39) | .02 |
| Any syndromic diagnosis of genital tract infectionb | 14 (11.8) | 35 (10.9) | .1 |
| Plasma HIV-1 load, log10 copies/mL | 4.9 (4.3–5.3) | 4.0 (3.3–4.8) | <.001 |
Data are no. (%) of couples, or median value (interquartile range).
a By χ2 analysis, for categorical variables, and the Wilcoxon test, for continuous variables.
b Includes urethritis, cervicitis, vaginitis, genital ulcer disease, pelvic inflammatory disease, herpes simplex virus infection, and lymphogranuloma venereum.
Of 30 cytokine analytes processed, 29 were assessed for differences between cases and controls (Table 2). IL-15 was not analyzed because of poor sensitivity of the assay to detect any concentration, resulting missing results for 70 of 441 samples. On the basis of findings involving the entire cytokine panel, HIV-1–susceptible and HIV-1–infected case partners were statistically significantly different from HIV-1–susceptible and HIV-1–infected control partners, respectively (P < .001 by the Hotelling T2 test for both comparisons). When specific cytokines were assessed, HIV-1–susceptible case partners had higher mean concentrations of EGF, G-CSF, IL-10, IL-12p40, IL-12p70, and CXCL10 than HIV-1–susceptible control partners. After controlling for multiple comparisons, IL-10 and CXCL10 concentrations remained significantly higher in susceptible case partners, compared with susceptible control partners (Figure 1A). HIV-1–infected case partners had higher mean concentrations of G-CSF, IL-10, IL-12p40, CXCL10, and TNF-α than HIV-1–infected control partners. After controlling for multiple comparisons, IL-10 and CXCL10 concentrations were significantly elevated in susceptible case partners, compared with susceptible control partners (Figure 1B). Comparing cytokine concentrations separately for HIV-1–infected male and female participants, we found that IL-10 and CXCL10 concentrations were significantly associated with seroconversion but also that HIV-1 transmission was associated with elevated concentrations of G-CSF, IFN-γ, and IL-17 among HIV-1–infected males (data not shown).
Table 2.
Concentration of Cytokine Analytes, by Human Immunodeficiency Virus Type 1 (HIV-1) Status
| Analyte | HIV-1–Susceptible Partners |
HIV-1–Infected Partners |
||||||
|---|---|---|---|---|---|---|---|---|
| Seroconverters (n = 120) | Nonseroconverters (n = 321) | Unadjusted P Valuesa | Adjusted P Valuesb | Transmitters (n = 120) | Nontransmitters (n = 321) | Unadjusted P Valuesa | Adjusted P Valuesb | |
| EGF | 2.23 (0.18–3.21) | 2.35 (0.18–3.33) | .02 | .3 | 2.14 (0.18–3.15) | 2.23 (0.18–3.13) | .1 | .3 |
| CCL11 | 1.98 (0.18–2.87) | 1.93 (0.18–2.88) | .1 | .9 | 1.93 (0.18–3.18) | 1.98 (0.65–2.66) | .2 | .99 |
| CX3CL1 | 1.27 (0.18–3.78) | 1.14 (0.18–3.81) | .2 | .99 | 1.07 (0.18–3.41) | 1.02 (0.18–3.54) | .6 | .99 |
| G-CSF | 1.57 (0.18–3.06) | 1.46 (0.51–3.35) | .004 | .1 | 1.64 (0.52–2.52) | 1.56 (0.18–2.84) | .01 | .1 |
| GM-CSF | 0.92 (0.18–3.58) | 0.86 (0.18–3.37) | .5 | .99 | 0.82 (0.18–3.49) | 0.8 (0.18–3.43) | .8 | .99 |
| IFN-γ | 1 (0.18–3.1) | 0.86 (0.18–2.86) | .07 | .8 | 1.13 (0.18–3.4) | 1.16 (0.18–3.27) | .7 | .99 |
| IL-10 | 0.91 (0.18–2.97) | 0.66 (0.18–2.73) | <.001 | .001 | 0.98 (0.18–2.39) | 0.76 (0.18–2.52) | <.001 | .003 |
| IL-12p40 | 0.69 (0.18–2.76) | 0.54 (0.18–2.99) | .03 | .4 | 0.92 (0.18–3.29) | 0.75 (0.18–3.13) | .03 | .3 |
| IL-12p70 | 0.68 (0.18–3.16) | 0.49 (0.18–3.16) | .01 | .2 | 0.49 (0.18–2.92) | 0.56 (0.18–3.72) | .3 | .99 |
| IL-13 | 0.49 (0.18–2.86) | 0.39 (0.18–2.63) | .09 | .8 | 0.32 (0.18–2.36) | 0.3 (0.18–3.02) | .7 | .99 |
| IL-17 | 0.71 (0.18–2.6) | 0.6 (0.18–2.56) | .1 | .9 | 0.47 (0.18–2.54) | 0.52 (0.18–2.61) | .4 | .99 |
| IL-1α | 0.5 (0.18–3.31) | 0.49 (0.18–3.21) | .9 | .99 | 0.29 (0.18–2.9) | 0.3 (0.18–2.45) | .9 | .99 |
| IL-1β | 0.47 (0.18–2.99) | 0.41 (0.18–2.73) | .3 | .99 | 0.34 (0.18–2.97) | 0.28 (0.18–2.68) | .2 | .99 |
| IL-1Rα | 0.61 (0.18–2.45) | 0.58 (0.18–2.6) | .6 | .99 | 0.58 (0.18–3.66) | 0.56 (0.18–3.27) | .8 | .99 |
| IL-2 | 0.5 (0.18–2.79) | 0.42 (0.18–2.43) | .1 | .9 | 0.35 (0.18–2.8) | 0.34 (0.18–2.78) | .8 | .99 |
| IL-4 | 0.26 (0.18–2.7) | 0.2 (0.18–2.57) | .07 | .8 | 0.31 (0.18–3.17) | 0.23 (0.18–2.73) | .1 | .8 |
| IL-5 | 0.32 (0.18–1.81) | 0.27 (0.18–1.84) | .1 | .9 | 0.33 (0.18–1.7) | 0.27 (0.18–2.02) | .06 | .9 |
| IL-6 | 0.81 (0.18–3.01) | 0.73 (0.18–2.97) | .3 | .99 | 0.5 (0.18–2.52) | 0.48 (0.18–3.44) | .6 | .99 |
| IL-7 | 0.59 (0.18–2.84) | 0.5 (0.18–2.46) | .1 | .9 | 0.42 (0.18–2.31) | 0.38 (0.18–2.31) | .3 | .8 |
| CXCL8 | 1.64 (0.18–4) | 1.7 (0.33–4) | .4 | .99 | 1.61 (0.18–4) | 1.62 (0.41–4) | .9 | .99 |
| CXCL10 | 2.37 (1.52–3.87) | 2.23 (1.21–3.2) | <.001 | <.001 | 2.81 (2.25–3.71) | 2.68 (1.94–3.52) | <.001 | .001 |
| CCL2 | 2.35 (0.18–3.36) | 2.34 (1.47–3.63) | .9 | .99 | 2.43 (1.4–3.67) | 2.45 (1.25–3.74) | .6 | .99 |
| CCL3 | 1.83 (0.18–4) | 1.9 (0.18–4) | .4 | .99 | 1.72 (0.18–3.71) | 1.82 (0.18–4) | .3 | .99 |
| CCL4 | 1.97 (0.18–3.11) | 1.96 (0.66–3.1) | .8 | .99 | 1.88 (0.74–3.12) | 1.85 (0.18–3.16) | .4 | .99 |
| CCL5 | 3.18 (0.18–3.83) | 3.21 (0.18–3.84) | .4 | .99 | 3.16 (0.83–3.7) | 3.13 (1.59–4) | .3 | .99 |
| scd40l | 2.88 (0.18–3.75) | 2.85 (0.18–3.74) | .6 | .9 | 2.55 (0.18–3.06) | 2.62 (0.18–3.22) | .1 | .99 |
| TGF-α | 1.03 (0.18–2.8) | 0.96 (0.18–3.7) | .1 | .7 | 0.83 (0.18–1.82) | 0.79 (0.18–2.28) | .2 | .05 |
| TNF-α | 1.04 (0.18–2.62) | 0.96 (0.18–2.55) | .06 | .99 | 1.12 (0.18–2.49) | 1 (0.18–2.59) | .002 | .4 |
| VEGF | 2.13 (0.18–3.33) | 2.16 (0.18–3.38) | .7 | .99 | 2.06 (0.18–3.32) | 2.2 (0.18–3.47) | .1 | .8 |
Data are log10-transformed median pg/mL (interquartile range).
Abbreviations: EGF, epidermal growth factor; G-CSF, granulocyte colony-stimulating factor; GM-CSF, granulocyte macrophage colony-stimulating factor; IFN-γ, interferon γ; IL-1, interleukin 1; IL-2, interleukin 2; IL-4, interleukin 4; IL-5, interleukin 5; IL-6, interleukin 6; IL-7, interleukin 7; IL-10, interleukin 10; IL-12, interleukin 12; IL-13, interleukin 13; IL-17, interleukin 17; TGF-α, transforming growth factor α; TNF-α, tumor necrosis factor α; VEGF, vascular endothelial growth factor.
a By the 2-sided Student t test for comparisons of the mean difference in mean concentrations between seroconverters and nonseroconverters.
b Adjusted for multiple comparisons, using the permutation t test for means.
Figure 1.
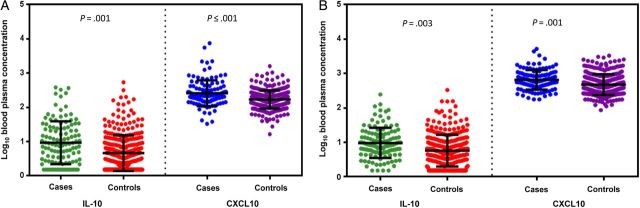
Mean log10 blood plasma concentrations for interleukin 10 (IL-10) and CXCL10 cytokines among cases and controls. The mean distribution of log10 concentration for IL-10 and CXCL10 for human immunodeficiency virus type 1 (HIV-1)–susceptible case and control partners (A) and HIV-1–infected case and control partners (B). Individual log10 cytokine concentrations plotted with mean (middle bar) and standard deviation (top and bottom bars).
In multivariate logistic regression models among HIV-1–susceptible case and control partners, considering IL-10 and CXCL10 concentrations separately and controlling for other predictors of HIV-1 transmission, the risk of HIV-1 acquisition among HIV-1–susceptible case partners remained significantly higher among those with elevated IL-10 concentrations (adjusted odds ratio [OR], 2.15 per 1 log10 increase; 95% confidence interval [CI], 1.43–3.23) and elevated CXCL10 concentrations (adjusted OR, 6.62 per 1 log10 increase; 95% CI, 2.78–15.78; Table 3), compared with susceptible control partners. IL-10 and CXCL10 concentrations were moderately correlated (Spearman ρ = 0.41; P < .001; Figure 2A). However, in a multivariate logistic regression model that included IL-10 and CXCL10 concentrations, concentrations of both cytokines remained significantly associated with HIV-1 acquisition in HIV-1–susceptible partners (adjusted OR, 1.61 per 1 log10 increase in IL-10 concentration [95% CI, 1.03–2.54] and 4.51 per 1 log10 increase in CXCL10 concentration [95% CI, 1.77–11.48]).
Table 3.
Logistic Regression Models Associating Blood Plasma Cytokine Concentrations With the Risk of Human Immunodeficiency Virus Type 1 (HIV-1) Transmissiona
| Partner HIV-1 Status, Variable | Individual Cytokine Models, aOR (95% CI) | HIV-1–Susceptible Partner Only, aOR (95% CI) | HIV-1–Infected Partner Only, aOR (95% CI) | Both Partners,b aOR (95% CI) |
|---|---|---|---|---|
| HIV-1–susceptible partner | ||||
| IL-10 level, per 1 log10 increase | 2.15 (1.43–3.23) | 1.61 (1.03–2.54) | … | 1.55 (.97–2.48) |
| CXCL10 level, per 1 log10 increase | 6.62 (2.78–15.78) | 4.51 (1.77–11.48) | … | 4.76 (1.85–12.23) |
| HIV-1–infected partner | ||||
| IL-10 level, per 1 log10 increase | 2.04 (1.21–3.44) | … | 1.96 (1.16–3.32) | 1.87 (1.08–3.23) |
| CXCL10 level, per 1 log10 increase | 1.85 (.79–4.33) | … | 1.59 (.67–3.75) | 1.74 (.71–4.25) |
Abbreviations: aOR, adjusted odds ratio; CI, confidence interval; IL-10, interleukin 10; STI, sexually transmitted infection.
a All models adjusted for the sex of the HIV-1–infected partner, plasma HIV-1 RNA concentration for the HIV-1–infected partner (log10 copies/mL), report of unprotected sex within the partnership (yes/no), and any STI diagnosis in either the HIV-1–susceptible partner or the HIV-1–infected partner.
b In this model with IL-10 and CXCL10 in both HIV-1–susceptible and HIV-1–infected partners, the aORs for the covariates were female sex of the HIV-1–infected partner (aOR, 1.74; 95% CI, 1.04–2.93; P = .04), plasma HIV-1 RNA concentration (aOR, 1.93 per 1 log10 increase; 95% CI, 1.42–2.63; P < .001), unprotected sex (aOR, 3.18; 95% CI, 1.85–5.44; P < .001), STI in the HIV-1–susceptible partner (aOR, 2.17; 95% CI, .88–5.33; P = .09), and STI in the HIV-1–infected partner (aOR, 0.97; 95% CI, .45–2.09; P = .9).
Figure 2.
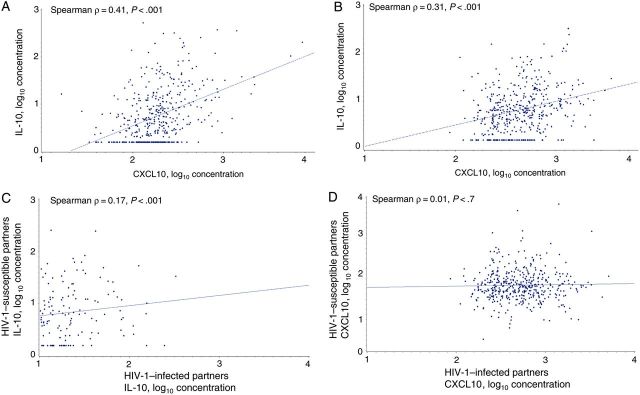
Correlation of interleukin 10 (IL-10) and CXCL10 log10 blood plasma concentrations. Scatterplot and regression line with Spearman ρ and P values for IL-10 and CXCL10 log10 concentrations in human immunodeficiency virus type 1 (HIV-1)–susceptible partners (A), IL-10 and CXCL10 log10 concentrations in HIV-1–infected partners (B), IL-10 log10 concentrations within serodiscordant couples (C), and CXCL10 log10 concentrations within serodiscordant couples (D).
In HIV-1–infected partners, IL-10 and CXCL10 concentrations were mildly correlated (Spearman ρ = 0.31; P < .001; Figure 2B). In multivariate logistic regression models for HIV-1–infected partners that adjusted for covariates and considered each cytokine separately, the HIV-1 transmission risk was significantly associated with higher IL-10 concentrations (adjusted OR, 2.04 per 1 log10 increase; 95% CI, 1.21–3.44) but not with CXCL10 concentrations (adjusted OR, 1.85 per 1 log10 increase; 95% CI, .79–4.33). Results were similar in an adjusted model that contained both IL-10 and CXCL10 concentrations. However, in an adjusted multivariate model that included both IL-10 and CXCL10 concentrations and other covariates except for plasma HIV-1 RNA concentrations, HIV-1 transmission was found to be significantly associated with both IL-10 concentration (adjusted OR, 2.49 per 1 log10 increase; 95% CI, 1.49–4.15; P < .001) and CXCL10 concentration (adjusted OR, 3.09 per 1 log10 increase; 95% CI, 1.41–6.79; P = .005), suggesting that higher plasma HIV-1 RNA concentrations explained some of the effect of these cytokines, particularly CXCL10.
Within the couples, concentrations of IL-10 were weakly but statistically significantly correlated between the 2 partners (Spearman ρ = 0.17; P < .001), but concentrations of CXCL10 were not significantly correlated (Spearman ρ = 0.01; P = .7). In a final multivariate logistic regression model that included concentrations of IL-10 and CXCL10 for both partners and other covariates, CXCL10 concentrations in the HIV-1–susceptible partner were significantly associated with the risk of HIV-1 transmission (adjusted OR, 4.76 per log10 increase; 95% CI, 1.85–12.23; P = .001), as were IL-10 concentrations in HIV-1–infected partners (adjusted OR, 1.87 per log10 increase; 95% CI, 1.08–3.23; P = .02).
DISCUSSION
In this analysis of the relationship between immune activation and risk of HIV-1 transmission among HIV-1–serodiscordant couples, systemic immune activation was measured by a panel of cytokines in preseroconversion samples to assess differences between both partners in cases and controls. We evaluated markers of immune activation through the proinflammatory response of cytokines. A unique aspect of our design was that were able to simultaneously assess markers of immune activation in both partners in samples obtained during the preseroconversion visits for transmitting couples and compare those results to those for both partners in couples in which the HIV-1–susceptible partner remained uninfected. We found statistically significant differences in concentrations of IL-10 and CXCL10 after controlling for multiple comparisons. Concentrations of systemic IL-10 and CXCL10 were higher among transmitting HIV-1–infected partners and their HIV-1–seroconverting partners than among the HIV-1–infected and uninfected partners in couples in which transmission did not occur, suggesting potentially important parallels in drivers of immune activation risk for HIV-1 susceptibility and infectiousness. This is the first study of HIV-1–serodiscordant couples to show a similar association between cytokine concentrations and HIV-1 transmission risk in each partner.
For persons at risk for HIV-1 acquisition, immune activation may contribute to this risk by the dysregulation of cytokines involved in promoting an antiviral response. For persons with HIV-1 infection, immune activation has been associated with increases in viral replication and viral shedding at mucosal sites [20–22], which may indicate increased infectiousness and risk for onward transmission of HIV-1. IL-10 is an immunomodulatory cytokine and is involved in the inhibition of inflammatory response and cytokine production. It has been shown in multiple studies to be associated with inhibition of T-cell proliferation [23, 24] and enhanced activation of natural killer cells [25, 26]. One study of African women found increased detection of IL-10 in endocervical secretion specimens from those with genital tract infections, suggesting one potential mechanism for increased HIV-1 susceptibility [27]. Our findings suggest that the inhibitory activities of IL-10 may limit the immune response necessary to prevent HIV-1 transmission. CXCL10 (also known as IFN-γ–induced protein 10) is a C-X-C chemokine associated with the migration of T cells to sites of inflammation [28]. In HIV-1 infection, CXCL10 is an early marker of disease progression [29, 30] and associated with increased HIV-1 shedding from the vaginal mucosa [31]. Although CXCL10 was not found to be significantly associated with HIV-1 transmission in the primary multivariate models, after excluding plasma HIV-1 RNA in the adjusted model CXCL10 was found to be associated with HIV-1 transmission, suggesting that it may associated with the increased viral load that drives HIV-1 transmission risk. In the multivariate models, we found that the association between IP-10 and HIV-1 transmission was reduced after adjusting for plasma HIV-1 load, suggesting that the effect on transmission is related to increased viremia. The role of CXCL10 in HIV-1 susceptibility is poorly understood, although there is evidence that it increases the size of the inoculum through stimulating viral replication at the time of exposure and that it potentially has a role in viral entry [32]. However, this hypothesis would need to be further investigated in other cohorts. One recent study of immune activation and HIV-1 susceptibility found a nonstatistically significant elevated plasma CXCL10 concentrations in high-risk African women who acquired HIV-1, compared with those who did not seroconvert [10]. That study also found significant associations between HIV-1 acquisition and TNF-α, IL-2, IL-7, and IL-12p70 concentrations; levels of these cytokines were not statistically significantly greater in our HIV-1 susceptibility analyses, although mean concentrations were higher in cases, compared with controls. Two additional studies of cytokine concentrations in genital mucosa found significantly lower levels of CXCL10 among highly exposed seronegative women, compared with HIV-1–negative and HIV-1–positive women, suggesting that a lower CXCL10 level is potentially protective against HIV-1 and that higher concentrations may increase risk [33, 34].
Although we found an association between blood plasma cytokine levels as markers for immune activation and HIV-1 transmission and acquisition risk, the relationship between increased cytokine levels and T-cell activation—a primary marker for immune activation—has not been well established. A recent study found that mucosal inflammation was not predictive of T-cell activation in the genital tract [35], but earlier studies have found that cytokine levels measuring inflammation may be markers for HIV-1–related T-cell activation [36]. We have insufficient data available in our analysis to make any assumptions about the role of blood plasma cytokines in genital tract T-cell activation. The importance of cytokine concentrations in increasing T-cell activation, promoting viral replication, and increasing infectiousness, particularly in the genital tract, needs further evaluation.
We did not conduct longitudinal measurements of cytokine levels to make inferences about the chronicity of immune activation in persons who acquired or transmitted HIV-1. However, we measured cytokine concentrations at the last study visit at which initially HIV-1–uninfected partners were known to be HIV-1 uninfected, so our results directly assess immune activation before HIV-1 acquisition. In addition, we did not assess the cause of immune activation in our population. Immune activation can be the result of fixed or modifiable factors, including systemic and genital infections, hormonal fluctuations, and genetic characteristics. Infections with ulcerative and nonulcerative STIs are associated with immune activation in genital mucosa and increased HIV-1 susceptibility [37–40]. Our study used measurements of cytokine concentrations in serum rather than in genital secretions, but systemic infections, such as parasitic infections and tuberculosis, increase immune activation [41–43] and may be related to increased HIV-1 susceptibility and transmission. Immune activation at the site of HIV-1 acquisition may be more specific than systemic infection. Future research should focus on identifying pathogens or other factors associated with immune activation, including assessing cytokine concentrations in mucosal samples. A final important limitation of our study is the length of time the plasma specimens were stored before cytokine testing. On average, our specimens were stored for 4 years after collection, and evidence suggests that specimen degradation after 2 years of storage will impact the reproducibility of concentrations of many cytokines, including IL-15, which was removed from the analysis because of low or missing concentrations [44]. Before cytokine testing, our specimens did not undergo thawing, which would further degrade specimen quality. The length of time for specimen storage was the same for both cases and controls; thus, it is unlikely that misclassification of cytokine concentrations between cases and controls was an issue in our analysis.
In conclusion, we found that significant differences in immune function were present between cases and controls and that concentrations of specific cytokines—IL-10 and CXCL10—were associated with both HIV-1 susceptibility and infectiousness in cases. Improving knowledge about the roles of immune activation and the inflammatory response in the transmission of HIV-1 remains a critical step in the attempt to understand HIV-1 pathogenesis. The results of our study can be applied to future research of the role of the immune response in HIV-1 transmission and the development of an HIV-1 vaccine.
STUDY GROUP MEMBERS AND AFFILIATES
University of Washington Coordinating Center (Seattle, Washington): Connie Celum (principal investigator); Anna Wald (protocol cochair); Jairam Lingappa (medical director); Amalia Magaret and James P. Hughes (protocol statisticians); and Lawrence Corey, Jared M. Baeten, and M. Juliana McElrath (coinvestigators).
Study sites and site principal investigators: Cape Town, South Africa (University of Cape Town), David Coetzee; Eldoret, Kenya (Moi University and Indiana University), Kenneth Fife and Edwin Were; Gaborone, Botswana (Botswana Harvard Partnership), Max Essex and Joseph Makhema; Kampala, Uganda (Infectious Disease Institute, Makerere University), Elly Katabira and Allan Ronald; Kisumu, Kenya (Kenya Medical Research Institute and University of California–San Francisco), Elizabeth Bukusi and Craig Cohen; Kitwe, Zambia (Rwanda Zambia HIV Research Group and Emory University), Susan Allen and William Kanweka; Moshi, Tanzania (Kilimanjaro Christian Medical College and Harvard University): Saidi Kapiga and Rachel Manongi; Nairobi, Kenya (University of Nairobi and University of Washington): Carey Farquhar, Grace John-Stewart, and James Kiarie; Ndola, Zambia (Rwanda Zambia HIV Research Group and Emory University): Susan Allen and Mubiana Inambao; Orange Farm, South Africa (Reproductive Health Research Unit, University of the Witwatersrand), Sinead Delany-Moretlwe and Helen Rees; Soweto, South Africa (Perinatal HIV Research Unit, University of the Witwatersrand): Guy de Bruyn, Glenda Gray, and James McIntyre; and Thika, Kenya (University of Nairobi and University of Washington): Nelly Rwamba Mugo.
Data management was provided by DF/Net Research (Seattle, Washington), and site laboratory oversight was provided by Contract Lab Services (University of the Witwatersrand, Johannesburg, South Africa).
Notes
Acknowledgments. We thank the HIV-1 serodiscordant couples who participated in this study for their invaluable contributions.
Financial support. This work was supported by the National Institutes of Health (grant R01 AI096968) and the Bill and Melinda Gates Foundation (awards OPP26469 and OPP41185).
Potential conflicts of interest. All authors: No reported conflicts.
All authors have submitted the ICMJE Form for Disclosure of Potential Conflicts of Interest. Conflicts that the editors consider relevant to the content of the manuscript have been disclosed.
References
- 1.Lawn SD, Butera ST, Folks TM. Contribution of immune activation to the pathogenesis and transmission of human immunodeficiency virus type 1 infection. Clin Microbiol Rev 2001; 14:753–77. [DOI] [PMC free article] [PubMed] [Google Scholar]
- 2.Hazenberg MD, Otto SA, van Benthem BH, et al. Persistent immune activation in HIV-1 infection is associated with progression to AIDS. AIDS 2003; 17:1881–8. [DOI] [PubMed] [Google Scholar]
- 3.Bentwich Z, Kalinkovich A, Weisman Z, Grossman Z. Immune activation in the context of HIV infection. Clin Exp Immunol 1998; 111:1–2. [DOI] [PMC free article] [PubMed] [Google Scholar]
- 4.Sousa AE, Carneiro J, Meier-Schellersheim M, Grossman Z, Victorino RM. CD4 T cell depletion is linked directly to immune activation in the pathogenesis of HIV-1 and HIV-2 but only indirectly to the viral load. J Immunol 2002; 169:3400–6. [DOI] [PubMed] [Google Scholar]
- 5.Cadogan M, Dalgleish AG. HIV immunopathogenesis and strategies for intervention. Lancet Infect Dis 2008; 8:675–84. [DOI] [PubMed] [Google Scholar]
- 6.Poli G. Laureate ESCI award for excellence in clinical science 1999. Cytokines and the human immunodeficiency virus: from bench to bedside. European Society for Clinical Investigation. Eur J Clin Invest 1999; 29:723–32. [DOI] [PubMed] [Google Scholar]
- 7.Shebl FM, Yu K, Landgren O, Goedert JJ, Rabkin CS. Increased levels of circulating cytokines with HIV-related immunosuppression. AIDS Res Hum Retroviruses 2012; 28:809–15. [DOI] [PMC free article] [PubMed] [Google Scholar]
- 8.Quinn TC, Wawer MJ, Sewankambo N, et al. Viral load and heterosexual transmission of human immunodeficiency virus type 1. Rakai Project Study Group. N Engl J Med 2000; 342:921–9. [DOI] [PubMed] [Google Scholar]
- 9.Wawer MJ, Gray RH, Sewankambo NK, et al. Rates of HIV-1 transmission per coital act, by stage of HIV-1 infection, in Rakai, Uganda. J Infect Dis 2005; 191:1403–9. [DOI] [PubMed] [Google Scholar]
- 10.Naranbhai V, Abdool Karim SS, Altfeld M, et al. Innate immune activation enhances hiv acquisition in women, diminishing the effectiveness of tenofovir microbicide gel. J Infect Dis 2012; 206:993–1001. [DOI] [PMC free article] [PubMed] [Google Scholar]
- 11.Zak DE, Andersen-Nissen E, Peterson ER, et al. Merck Ad5/HIV induces broad innate immune activation that predicts CD8(+) T-cell responses but is attenuated by preexisting Ad5 immunity. Proc Natl Acad Sci U S A 2012; 109:E3503–12. [DOI] [PMC free article] [PubMed] [Google Scholar]
- 12.Cohen CR, Moscicki AB, Scott ME, et al. Increased levels of immune activation in the genital tract of healthy young women from sub-Saharan Africa. AIDS 2010; 24:2069–74. [DOI] [PMC free article] [PubMed] [Google Scholar]
- 13.Lingappa JR, Kahle E, Mugo N, et al. Characteristics of HIV-1 discordant couples enrolled in a trial of HSV-2 suppression to reduce HIV-1 transmission: the partners study. PLoS One 2009; 4:e5272. [DOI] [PMC free article] [PubMed] [Google Scholar]
- 14.Celum C, Wald A, Lingappa JR, et al. Acyclovir and transmission of HIV-1 from persons infected with HIV-1 and HSV-2. N Engl J Med 2010; 362:427–39. [DOI] [PMC free article] [PubMed] [Google Scholar]
- 15.Lingappa JR, Petrovski S, Kahle E, et al. Genomewide association study for determinants of HIV-1 acquisition and viral set point in HIV-1 serodiscordant couples with quantified virus exposure. PLoS One 2011; 6:e28632. [DOI] [PMC free article] [PubMed] [Google Scholar]
- 16.Campbell MS, Mullins JI, Hughes JP, et al. Viral linkage in HIV-1 seroconverters and their partners in an HIV-1 prevention clinical trial. PLoS One 2011; 6:e16986. [DOI] [PMC free article] [PubMed] [Google Scholar]
- 17.Bachelerie F, Ben-Baruch A, Burkhardt AM, et al. International Union of Basic and Clinical Pharmacology. [corrected]. LXXXIX. Update on the extended family of chemokine receptors and introducing a new nomenclature for atypical chemokine receptors. Pharmacol Rev 2014; 66:1–79. [DOI] [PMC free article] [PubMed] [Google Scholar]
- 18.Fong Y, Sebestyen K, Yu X, Gilbert P, Self S. nCal: a R package for nonlinear calibration. Bioinformatics 2013; 29:2653–4. [DOI] [PMC free article] [PubMed] [Google Scholar]
- 19.Conneely KN, Boehnke M. So many correlated tests, so little time! Rapid adjustment of P values for multiple correlated tests. Am J Hum Genet 2007; 81:1158–68. [DOI] [PMC free article] [PubMed] [Google Scholar]
- 20.Lafeuillade A, Poizot-Martin I, Quilichini R, et al. Increased interleukin-6 production is associated with disease progression in HIV infection. AIDS 1991; 5:1139–40. [DOI] [PubMed] [Google Scholar]
- 21.Roberts L, Passmore JA, Williamson C, et al. Plasma cytokine levels during acute HIV-1 infection predict HIV disease progression. AIDS 2010; 24:819–31. [DOI] [PMC free article] [PubMed] [Google Scholar]
- 22.Zara F, Nappi RE, Brerra R, Migliavacca R, Maserati R, Spinillo A. Markers of local immunity in cervico-vaginal secretions of HIV infected women: implications for HIV shedding. Sex Transm Infect 2004; 80:108–12. [DOI] [PMC free article] [PubMed] [Google Scholar]
- 23.de Waal Malefyt R, Haanen J, Spits H, et al. Interleukin 10 (IL-10) and viral IL-10 strongly reduce antigen-specific human T cell proliferation by diminishing the antigen-presenting capacity of monocytes via downregulation of class II major histocompatibility complex expression. J Exp Med 1991; 174:915–24. [DOI] [PMC free article] [PubMed] [Google Scholar]
- 24.Taga K, Tosato G. IL-10 inhibits human T cell proliferation and IL-2 production. J Immunol 1992; 148:1143–8. [PubMed] [Google Scholar]
- 25.Cai G, Kastelein RA, Hunter CA. IL-10 enhances NK cell proliferation, cytotoxicity and production of IFN-gamma when combined with IL-18. Eur J Immunol 1999; 29:2658–65. [DOI] [PubMed] [Google Scholar]
- 26.Wren L, Parsons MS, Isitman G, et al. Influence of cytokines on HIV-specific antibody-dependent cellular cytotoxicity activation profile of natural killer cells. PLoS One 2012; 7:e38580. [DOI] [PMC free article] [PubMed] [Google Scholar]
- 27.Cohen CR, Plummer FA, Mugo N, et al. Increased interleukin-10 in the the endocervical secretions of women with non-ulcerative sexually transmitted diseases: a mechanism for enhanced HIV-1 transmission? AIDS 1999; 13:327–32. [DOI] [PubMed] [Google Scholar]
- 28.Taub DD, Lloyd AR, Conlon K, et al. Recombinant human interferon-inducible protein 10 is a chemoattractant for human monocytes and T lymphocytes and promotes T cell adhesion to endothelial cells. J Exp Med 1993; 177:1809–14. [DOI] [PMC free article] [PubMed] [Google Scholar]
- 29.Liovat AS, Rey-Cuille MA, Lecuroux C, et al. Acute plasma biomarkers of T cell activation set-point levels and of disease progression in HIV-1 infection. PLoS One 2012; 7:e46143. [DOI] [PMC free article] [PubMed] [Google Scholar]
- 30.Jiao Y, Zhang T, Wang R, et al. Plasma IP-10 is associated with rapid disease progression in early HIV-1 infection. Viral Immunol 2012; 25:333–7. [DOI] [PubMed] [Google Scholar]
- 31.Blish CA, McClelland RS, Richardson BA, et al. Genital Inflammation Predicts HIV-1 Shedding Independent of Plasma Viral Load and Systemic Inflammation. J Acquir Immune Defic Syndr 2012; 61:436–40. [DOI] [PMC free article] [PubMed] [Google Scholar]
- 32.Lane BR, King SR, Bock PJ, Strieter RM, Coffey MJ, Markovitz DM. The C-X-C chemokine IP-10 stimulates HIV-1 replication. Virology 2003; 307:122–34. [DOI] [PubMed] [Google Scholar]
- 33.Lajoie J, Juno J, Burgener A, et al. A distinct cytokine and chemokine profile at the genital mucosa is associated with HIV-1 protection among HIV-exposed seronegative commercial sex workers. Mucosal Immunol 2012; 5:277–87. [DOI] [PubMed] [Google Scholar]
- 34.Lajoie J, Kimani M, Plummer FA, et al. Association of sex work with reduced activation of the mucosal immune system. J Infect Dis 2014; 210:319–29. [DOI] [PubMed] [Google Scholar]
- 35.Jaspan HB, Liebenberg L, Hanekom W, et al. Immune activation in the female genital tract during HIV infection predicts mucosal CD4 depletion and HIV shedding. J Infect Dis 2011; 204:1550–6. [DOI] [PMC free article] [PubMed] [Google Scholar]
- 36.Gumbi PP, Nkwanyana NN, Bere A, et al. Impact of mucosal inflammation on cervical human immunodeficiency virus (HIV-1)-specific CD8 T-cell responses in the female genital tract during chronic HIV infection. J Virol 2008; 82:8529–36. [DOI] [PMC free article] [PubMed] [Google Scholar]
- 37.Levine WC, Pope V, Bhoomkar A, et al. Increase in endocervical CD4 lymphocytes among women with nonulcerative sexually transmitted diseases. J Infect Dis 1998; 177:167–74. [DOI] [PubMed] [Google Scholar]
- 38.Li H, Li X, Wei Y, Tan Y, Liu X, Wu X. HSV-2 induces TLRs and NF-kappaB-dependent cytokines in cervical epithelial cells. Biochem Biophys Res Commun 2009; 379:686–90. [DOI] [PubMed] [Google Scholar]
- 39.Novak RM, Donoval BA, Graham PJ, et al. Cervicovaginal levels of lactoferrin, secretory leukocyte protease inhibitor, and RANTES and the effects of coexisting vaginoses in human immunodeficiency virus (HIV)-seronegative women with a high risk of heterosexual acquisition of HIV infection. Clin Vaccine Immunol 2007; 14:1102–7. [DOI] [PMC free article] [PubMed] [Google Scholar]
- 40.Iqbal SM, Kaul R. Mucosal innate immunity as a determinant of HIV susceptibility. Am J Reprod Immunol 2008; 59:44–54. [DOI] [PubMed] [Google Scholar]
- 41.Borkow G, Leng Q, Weisman Z, et al. Chronic immune activation associated with intestinal helminth infections results in impaired signal transduction and anergy. J Clin Invest 2000; 106:1053–60. [DOI] [PMC free article] [PubMed] [Google Scholar]
- 42.Scholzen A, Sauerwein RW. How malaria modulates memory: activation and dysregulation of B cells in Plasmodium infection. Trends Parasitol 2013; 29:252–62. [DOI] [PubMed] [Google Scholar]
- 43.Martinez AN, Mehra S, Kaushal D. Role of Interleukin 6 in Innate Immunity to Mycobacterium tuberculosis Infection. J Infect Dis 2013; 207:1253–61. [DOI] [PMC free article] [PubMed] [Google Scholar]
- 44.de Jager W, Bourcier K, Rijkers GT, Prakken BJ, Seyfert-Margolis V. Prerequisites for cytokine measurements in clinical trials with multiplex immunoassays. BMC Immunol 2009; 10:52. [DOI] [PMC free article] [PubMed] [Google Scholar]