

Abstract
Background. Whole-genome sequencing (WGS) is increasingly used in molecular-epidemiological investigations of bacterial pathogens, despite cost- and time-intensive analyses. We combined strain-specific single-nucleotide polymorphism (SNP) typing and targeted WGS to investigate a tuberculosis cluster spanning 21 years in Bern, Switzerland.
Methods. On the basis of genome sequences of 3 historical outbreak Mycobacterium tuberculosis isolates, we developed a strain-specific SNP-typing assay to identify further cases. We screened 1642 patient isolates and performed WGS on all identified cluster isolates. We extracted SNPs to construct genomic networks. Clinical and social data were retrospectively collected.
Results. We identified 68 patients associated with the outbreak strain. Most received a tuberculosis diagnosis in 1991–1995, but cases were observed until 2011. Two thirds were homeless and/or substance abusers. Targeted WGS revealed 133 variable SNP positions among outbreak isolates. Genomic network analyses suggested a single origin of the outbreak, with subsequent division into 3 subclusters. Isolates from patients with confirmed epidemiological links differed by 0–11 SNPs.
Conclusions. Strain-specific SNP genotyping allowed rapid and inexpensive identification of M. tuberculosis outbreak isolates in a population-based strain collection. Subsequent targeted WGS provided detailed insights into transmission dynamics. This combined approach could be applied to track bacterial pathogens in real time and at high resolution.
Keywords: tuberculosis, outbreak, whole genome sequencing, genomic epidemiology, screening
Tuberculosis transmission has traditionally been investigated using contact tracing and molecular typing [1, 2]. However, social contact data are often hard to obtain retrospectively, especially in high-risk groups such as homeless individuals and substance abusers, who are difficult to trace [3–7]. Moreover, classical molecular epidemiological techniques such as IS6110 restriction fragment-length polymorphism (RFLP) analysis and mycobacterial interspersed repetitive unit – variable number of tandem repeat (MIRU-VNTR) analysis interrogate only a small proportion of the mycobacterial genome and therefore suffer from limited resolution [8].
More recently, whole-genome sequencing (WGS) of Mycobacterium tuberculosis has been used to investigate tuberculosis outbreaks [9]. Known as “genomic epidemiology” [10], this emerging field uses WGS to detect unknown transmission events, identify superspreaders, and exclude or confirm epidemiologically suspected transmission links [11–14]. Moreover, WGS can also be used to detect drug resistance mutations [15]. Even though routine WGS has the potential to replace classical genotyping [14, 16], analyzing WGS data remains resource-intensive and requires further standardization to meet public health needs, particularly for tracking ongoing outbreaks in real time [9].
In 1993, a tuberculosis outbreak was reported in the canton of Bern, Switzerland [17]. Twenty-two cases were involved, and their M. tuberculosis isolates shared identical IS6110 RFLP patterns. As in other affluent countries [18, 19], this outbreak involved mainly homeless individuals and substance abusers. In 2012, we studied the molecular epidemiology of tuberculosis in Switzerland. We used the classic methods of spoligotyping and MIRU-VNTR to genotype 520 M. tuberculosis isolates from patients in whom tuberculosis was diagnosed between 2000 and 2008 (12.3% of all culture-confirmed tuberculosis cases in Switzerland during the study period) [20]. Among 68 isolates from the canton of Bern, 2 were identified as belonging to the same outbreak described in 1993, indicating that this particular strain was still circulating in the area.
In the present study, we used a combination of single-nucleotide polymorphism (SNP) typing and targeted WGS to track the spread of the outbreak over 2 decades. Using representative isolates from the historical outbreak, we first developed a novel strain-specific SNP-typing assay to rapidly and inexpensively identify all tuberculosis cases caused by this strain in the canton of Bern between 1991 and 2011. We then applied targeted WGS to all cluster isolates identified by the screening assay to study the outbreak dynamics in relation to social contact information.
METHODS
Study Setting and Sample Set
We subcultured 1642 patient isolates available from the M. tuberculosis strain collection at the Institute for Infectious Diseases (Bern, Switzerland). These isolates were all collected between 1991 and 2011 and correspond to 84.6% of all 1940 tuberculosis cases (all forms) notified in the canton of Bern during the same period (Figure 1). Subcultures were performed on Löwenstein-Jensen slants according to international laboratory standards. Purified DNA for WGS was obtained using the CTAB extraction method after subculturing a single colony in 7H9 liquid medium [21]. Bulk extracts (ie, without single colony selection) were available for 4 isolates.
Figure 1.
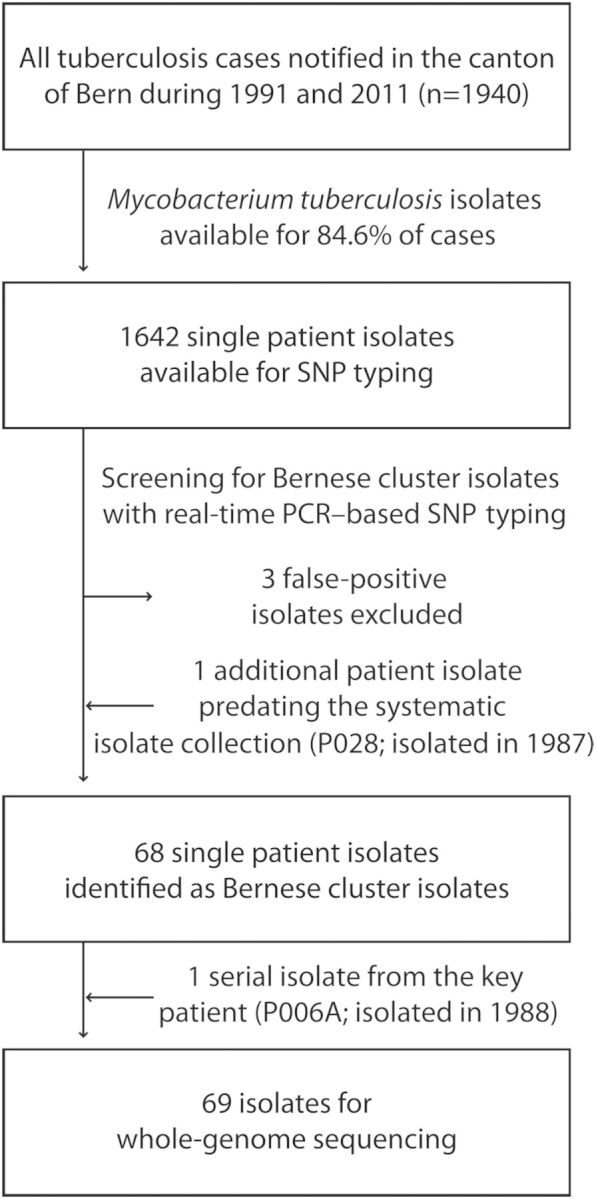
Overview of patient isolates and whole genome sequences generated. A total of 1642 isolates collected between 1991 and 2011 were available for single-nucleotide polymorphism (SNP) genotyping. Three isolates showed ambiguous SNP-typing results and were excluded. One additional patient isolate (P028; isolated in 1987) reported in the original publication [17] and predating the systematic collection of isolates in 1991 was included in the study. For the key patient, a second isolate (P006B; isolated in 1991 [17]) was available and was included in the genomic analyses.
The collection included the 22 historical outbreak isolates reported by Genewein et al [17]. One strain isolated in 1987, before systematic collection was started in 1991, was also included (P028, originally termed “patient 1” [17]). Finally, for 1 outbreak patient from 1991, we identified an additional strain isolated in 1988 (P006A, originally termed “patient 2”; Figure 1).
Cluster Strain–Specific SNP-Typing Assay and Screening of Strain Collection
We performed WGS on 1 historical outbreak isolate from 1992 [17] and 2 isolates from 2005 and 2008 with the same MIRU-VNTR and spoligotyping patterns [20] associated with the so-called Bernese cluster, as described below. We also performed WGS on 2 isolates with the same spoligotyping pattern (isolation years, 2001 and 2004) but a different MIRU-VNTR pattern (3 and 4 different loci, compared with the outbreak isolate), 1 additional lineage 4 isolate from another study, and the reference strain H37Rv (Figure 2). The 3 outbreak isolates shared 118 SNPs not observed in any of the control isolates (Figure 2). We used one of these outbreak-specific SNPs (878 174 GA; position in reference to H37Rv) to develop a real-time polymerase chain reaction (PCR) SNP-typing assay (TaqMan, Life Technologies, Switzerland), as described previously [22]. All 1642 available isolates were screened for the presence of that SNP. For confirmation, we subjected all isolates with a mutation at this position to a second, phylogenetically redundant SNP-typing assay (981 565 CT). Both SNPs were selected to be synonymous and located in genomic regions suitable for primer and probe design.
Figure 2.

Initial neighbor joining phylogeny of Mycobacterium tuberculosis isolates. Three whole-genome sequences from the historic outbreak and 4 control isolates were used to identify single-nucleotide polymorphisms (SNPs) specific to the outbreak genotype. Node support was assessed by bootstrapping over 1000 pseudo-replicates and is indicated as a percentage.
WGS and Phylogenetic Analyses
All isolates identified by the screening assay and the additional serial isolate from patient P006 were subjected to Illumina WGS at GATC Biotech (Konstanz, Germany), with a median nucleotide coverage of 157.3 reads (range, 29.1–896.9 reads). Sequence read mapping and SNP calling was done as previously described [23]. We considered SNPs with a coverage of at least 10 sequencing reads and a value of 20 in the Phred-scaled quality score. SNPs in genes annotated as “PE/PPE/PGRS,” “maturase,” “phage,” “insertion sequence,” or “13E12 repeat family protein” were removed. Additionally, positions with missing nucleotide calls in at least 3 isolates were excluded. We used a second short-read alignment tool (SMALT, Wellcome Trust Sanger Institute, United Kingdom) to obtain SNP calls. Only positions called by both methods after filtering for the criteria mentioned above were included for further analysis. A subset of 28 SNPs was confirmed by Sanger sequencing (Supplementary Materials).
A genomic network with all variable positions was generated using Fluxus Network Software (http://www.fluxus-engineering.com) and the median joining algorithm. Arlequin 3.5.1.12 [24] was used to calculate genetic distances and fixation indices (FST) to estimate population separation between genomic subclusters. Statistical significance was calculated with permutations.
Raw sequencing data are available under accession number PRJEB5925 (European Nucleotide Archive).
Clinical and Sociodemographic Data Collection
We collected clinical and sociodemographic data for all patients identified as belonging to the cluster. Treating physicians, hospital archives, the Bernese Lung Association, and the cantonal health authorities collected the data, using standardized questionnaires. We also collected contact tracing information for confirmed or presumptive links among cluster patients. The National Tuberculosis Surveillance Registry (Federal Office of Public Health) provided basic demographic data (age, sex, birth place, and disease site) for all tuberculosis cases notified in the canton of Bern between 1991 and 2011.
Definitions
We categorized patients as having new tuberculosis, recurrent tuberculosis, or an unknown previous treatment status, according to international definitions [25]. Links between cases were considered confirmed for contacts named in the contact tracing information. Links between cases were considered presumptive when contacts were not clearly named but were strongly supported by other contact tracing information (ie, visiting common hotspots of transmission, shared housing, and shared place of work). Alcohol abuse was defined as daily consumption of alcohol, and smoking was defined as past or current smoking. We defined “milieu” as a combined variable capturing high-risk populations (substance abusers and/or homeless individuals) and/or patients frequenting high-risk settings (ie, drug injection places, methadone distribution places, and homeless shelters).
Statistical Analyses
We used χ2 tests or Fisher exact tests to assess differences between groups in binary variables and the Wilcoxon rank sum test for analysis of continuous variables. We investigated differences between (1) the characteristics of patients in the Bernese cluster and all other notified tuberculosis cases in the canton of Bern between 1991 and 2011 and (2) patients in the genomic subclusters.
Ethics Statement
Ethics approval for this study was obtained from the ethics committee of the canton of Bern. The treating physicians sought written informed consent from study participants. In most cases, however, informed consent could not be obtained because the patient could not be located or was known to have died. We therefore obtained permission from the Federal Expert Commission on Confidentiality in Medical Research to use the data provided by the treating physicians.
Role of the Funding Sources
The funders had no role in study design, data collection and analysis, decision to publish, or preparation of the article.
RESULTS
Identification of Bernese Cluster Isolates by Strain-Specific SNP Typing
Using the strain-specific real-time PCR SNP-typing assay, we screened 1642 M. tuberculosis single patient isolates for the Bernese cluster–specific SNP (878 174 GA) and identified 71 of 1642 (4.3%) isolates as belonging to this cluster. All isolates but 3 were confirmed by use of a second, phylogenetically redundant SNP (981 565 CT). These 3 isolates with ambiguous results were excluded from further analysis, as subsequent WGS revealed mean pair-wise distances of 91, 148, and 174 SNPs to the other cluster isolates. In contrast, all other cluster isolates were separated by ≤19 SNPs (Supplementary Table 1). This corresponds to a specificity of 99.8% (3 false-positive results out of 1574 noncluster isolates), when considering our screening results based on only the first strain-specific SNP. All 22 historical isolates described in 1993 [17] were correctly identified by both SNP-typing assays (sensitivity, 100%) as having Bernese cluster genotype. Hence, we identified a total of 68 patients linked to the cluster strain (Figures 1 and 3).
Figure 3.

Epidemic curve of the 68 patients identified as tuberculosis cluster cases. Gray boxes indicate patients associated with the social milieu (homeless individuals and/or substance abusers). One additional patient isolate (P028; isolated in 1987) reported in the original publication [17] and predating the systematic collection of isolates in 1991 was included in the study. For 1 patient from 1991 [17], a second isolate (P006A; isolated in 1988) was available and was therefore backdated.
For one patient, 2 isolates (P006A and P006B, isolated in 1988 and 1991, respectively) were available, and we included both for further analyses because of the central role of this patient described in the original study (originally termed “patient 2” [17]). Hence, we included 69 cluster isolates in the WGS analyses (Figure 1).
To illustrate the strengths of our novel combined approach, we compared the costs, advantages, and disadvantages of the different methods used in outbreak investigations of tuberculosis (Table 1). Our strain-specific SNP assay to screen 1642 isolates was approximately 15 times less expensive than the current gold standard based on MIRU-VNTR. A combination of the SNP assay and targeted WGS for 69 cluster isolates was approximately 20 times less expensive than performing WGS of the entire collection.
Table 1.
Comparison of Tuberculosis Outbreak Tracking Methods, Considering the Scenario of the Present Study (68 Outbreak Patients of 1642 Patient Isolates to Be Screened)
| This Study |
WGS of Entire Collection (n = 1642) | MIRU-VNTR (n = 1642) | Spoligotyping (n = 1642) | Contact Tracing | ||
|---|---|---|---|---|---|---|
| SNP Assay for Identification of Cluster Isolates (n = 1642) | Targeted WGS of Identified Cluster Isolates (n = 69) | |||||
| Estimated cost, US$a | ||||||
| Per isolate | 3 (SNP assay) | 330 (targeted WGS) | 330 | 49 | 26 | High |
| Total | 4926b (SNP assay) | 22 770 (targeted WGS) | 541 860 | 80 458 | 42 692 | … |
| Advantages | Rapid identification of cluster isolates; inexpensive | Highest resolution among cluster isolates; additional information (eg, drug resistance mutations) | Highest resolution among all isolates (in all clusters); additional information obtained (eg, drug resistance mutations) | Current gold-standard for molecular epidemiology; can be semiautomatized | Low technology requirement | Information on transmission hotspots for targeted prevention; information on secondary cases |
| Disadvantages | No further resolution among cluster isolates; performance of assay depends on selection of initial isolates for WGS (eg, SNP selection) | Previous identification of outbreak isolates necessary | Expensive; extensive bioinformatic expertise necessary | Limited resolution within outbreak clusters | Low resolution of outbreak cluster analysis when used as single method | Expensive and time-consuming; misses many cases, particularly in high-risk populations |
| Prospective use | Can be used in real time once outbreak is identified and an assay established; highest resolution among outbreak isolates if used in combination with targeted WGS | In combination with SNP assay | Can be used in real time once bioinformatics expertise is established | Routine use | Yes | Yes |
Abbreviations: MIRU-VNTR, mycobacterial interspersed repetitive unit–variable number of tandem repeat; SNP, single-nucleotide polymorphism; WGS, whole-genome sequencing.
a Cost calculations were based on commercially available services (http://www.genoscreen.fr and http://www.gatc-biotech.com) or estimated according to in-house costs (as of August 2014). The total cost of SNP and targeted WGS analyses in this study was US$27 696.
b For WGS of 6 initial isolates and screening using the strain-specific SNP-genotyping assay of 1642 isolates.
Description of the Tuberculosis Cluster Over 21 Years
Of the 68 patients in the Bernese cluster, 55 (80.9%) received their diagnosis during 1998 or earlier, and 13 received their diagnosis between 1999 and 2011 (Figure 3). The characteristics of the 68 cluster patients, compared with characteristics of all other tuberculosis cases diagnosed in the same region and period, are presented in Table 2. Cluster patients were more likely to be male (79.4% vs 57.3%; P < .001), born in Switzerland (83.8% vs 47.4%; P < .001), and to have pulmonary tuberculosis as opposed to extrapulmonary tuberculosis (94.1% vs 75.1%; P < .001). The median age of the cluster patients was 41 years (interquartile range [IQR], 34–53 years), compared with 44 years (IQR, 29–71 years) for all other patients with tuberculosis (P = .12). Most (67.6%) of the cluster patients were part of the local injection drug scene and/or homeless milieu. Among cluster patients, 19.1% were infected with human immunodeficiency virus (HIV; HIV information was unavailable for noncluster patients). Four particular hotspots of tuberculosis transmission were identified within the milieu: 1 short-term homeless shelter, 1 long-term social integration home, 1 meeting point for injection drug and methadone supply, and 1 bar where substance abusers met. The distribution of cluster patients among these 4 transmission hotspots, the social milieu, and the general population are presented in Figure 4.
Table 2.
Characteristics of Cases Confirmed to Be in the Tuberculosis Cluster, Compared With All Other Notified Tuberculosis Cases, in the Canton of Bern Between 1991 and 2011
| Characteristic | Bernese Cluster Cases (n = 68) | Other Cases (n = 1872) | P Value |
|---|---|---|---|
| Age at tuberculosis diagnosis, y | 41 (34–53) | 44 (29–71) | .12 |
| Sex | <.001 | ||
| Male | 54 (79.4) | 1072 (57.3) | |
| Female | 14 (20.6) | 800 (42.7) | |
| Birth region | <.001 | ||
| Switzerland | 57 (83.8) | 888 (47.4) | |
| Europe (without Switzerland) | 10 (14.7) | 398 (21.3) | |
| Sub-Saharan Africa | 0 | 227 (12.1) | |
| Asia | 1 (1.5) | 284 (15.2) | |
| Caribbean and Latin America | 0 | 31 (1.7) | |
| Other | 0 | 36 (1.9) | |
| Unknown | 0 | 8 (0.4) | |
| Tuberculosis site | <.001 | ||
| Pulmonary | 64 (94.1) | 1406 (75.1) | |
| Extrapulmonary | 4 (5.9) | 466 (24.9) | |
| Tuberculosis category | |||
| New case | 54 (79.4) | … | |
| Recurrent | 7 (10.3) | … | |
| Unknown | 7 (10.3) | … | |
| Imprisonment within 2 y of diagnosis | 9 (13.2) | … | |
| Diabetes | 3 (4.4) | … | |
| Alcohol abuse | 39 (57.4) | … | |
| Smoker | 41 (60.3) | … | |
| Injection drug user | 18 (26.5) | … | |
| Homeless | 21 (30.9) | … | |
| HIV positive | 13 (19.1) | … | |
| Homeless/substance abuser milieu | 46 (67.6) | … | |
| Residence | |||
| Bern City | 37 (54.4) | … | |
| Outside Bern City | 29 (42.6) | … | |
| Unknown | 2 (2.9) | … |
Data are no. (%) patients or median (interquartile range). Data for some characteristics were missing for the other cases notified to the Canton of Bern.
Abbreviation: HIV, human immunodeficiency virus.
Figure 4.

Distribution of cluster patients with tuberculosis in the milieu of substance abusers and homeless people. The 4 main hotspots of transmission that were identified by social contact tracing are shown (a short-term homeless shelter, a long-term social integration home, a meeting point for substance abusers, and a bar). Milieu patients are associated with a particular social context (homeless, substance abuser scene). Solid lines indicate confirmed epidemiological links, and dashed lines indicate suspected social links. Presumptive individual links between milieu patients are not shown because these patients are highly interlinked.
Contact investigation provided information on potential patient-to-patient links (Figure 4). Fourteen of 68 patients (20.6%) had confirmed epidemiological links (Figure 4). Confirmed links were more frequent between patients sharing transmission hotspots, indicating the large degree of social interaction in these settings. Only 1 confirmed link, between a father and his daughter (P040-P041), was identified in the general population.
WGS of Bernese Cluster Isolates
A total of 133 variable positions were identified among the 69 cluster isolates (Supplementary Table 2). We generated a median joining network using these 133 variable positions (Figure 5). Despite identical MIRU-VNTR and spoligotyping patterns (Supplementary Table 3), 52 of 69 isolates (75.4%) were discriminated by at least 1 SNP from their most closely related neighbor. The maximum number of SNPs between any 2 isolates was 19 (Supplementary Table 1), and the mean pair-wise distance (±SD) between all isolates was 6.0 ± 2.9 SNPs. Patient isolates with confirmed epidemiological links differed by 0–11 SNPs (Supplementary Table 1). No drug resistance–associated mutation was detected among the 69 cluster isolates (Supplementary Materials).
Figure 5.
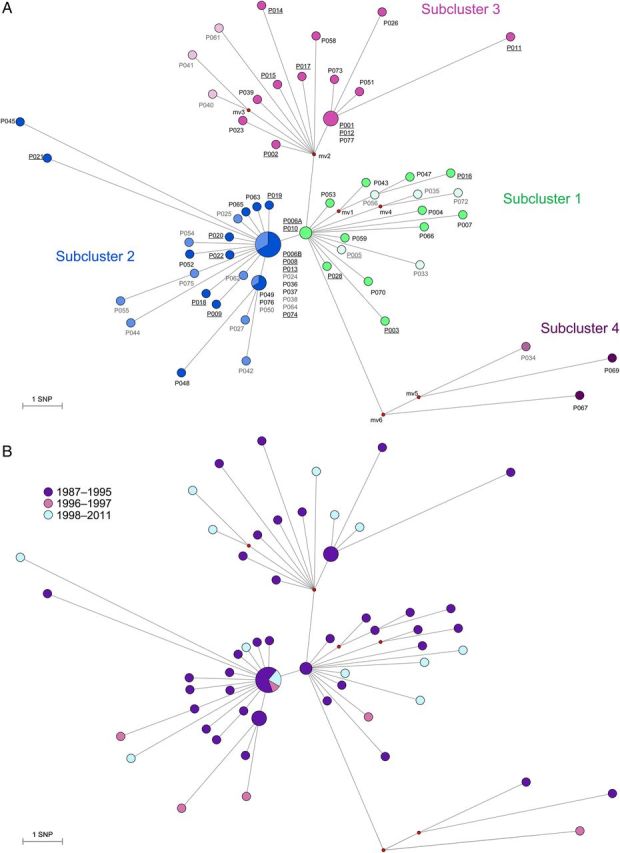

Median Joining network using 133 variable single nucleotide positions (SNP) among whole genome sequences of Mycobacterium tuberculosis cluster isolates of the “Bernese cluster” outbreak. Branch lengths correspond to number of SNPs. Circle sizes correspond to number of isolates, median vectors (mv) are hypothetical genotypes. Position of “mv6” is the root of the network. A, Network showing the four identified “sub-clusters. Darker circles in each subcluster indicate patients that were associated with the particular social milieu (homeless, substance abuser scene), lighter circles are patients in the non-milieu population. Underlined labels represent isolates that were identified in the original publication [17]. B, Network colored according to time period when the M. tuberculosis strains were isolated. C, Network showing patients associated with a particular hotspot.
Subclusters and Key Patient
The genomic network revealed 3 independent star-like structures, suggesting (1) an early divergence of a shared ancestor strain into 3 subclusters (Figure 5A) and (2) the presence of one or several superspreaders. A fourth, more distantly related subcluster was separated by 9 SNPs from the nearest isolate (P006A; Figure 5A). In contrast, subclusters 1 and 2 were separated by 1 SNP, and subclusters 1 and 3 were separated by 2 SNPs. The average pairwise distance within each subcluster was 4.2 (subcluster 1), 3.1 (subcluster 2), 5 (subcluster 3), and 9.3 SNPs (subcluster 4). All corresponding SNP distances were larger between subclusters than within subclusters (4.8 SNPs between subclusters 1 and 2, 6.8 SNPs between subclusters 1 and 3, 12.2 SNPs between subclusters 1 and 4, 7.3 SNPs between subclusters 2 and 3, 12.6 SNPs between subclusters 2 and 4, and 14.6 SNPs between subclusters 3 and 4). Pairwise fixation indices (FST) between subclusters were between 0.24 (subcluster 1 and 2) and 0.67 (subcluster 2 and 4; P < .005 for all comparisons), further supporting the subcluster distinction.
The central position of subcluster 1 was occupied by the first isolate from the key patient, patient P006 (P006A; isolated in 1988) together with isolate P010. The second isolate from the key patient (P006B; isolated 1991) was found in the central position of subcluster 2. This suggests a second tuberculosis episode in patient P006, generating further secondary cases. Seven other isolates were genomically clustered with P006B and could also be the source of transmission in subcluster 2. However, patient P006 was a homeless substance abuser who was known to have interrupted treatment and had a history of treatment failure, and a key role for this patient in the outbreak was already suspected in 1993.
The central position of subcluster 3 remained unoccupied (ie, no isolate was available with this hypothetical genotype). This could be explained by an unsampled strain variant from patient P002 (ie, from a mixed infection of microevolved strains) that had been transmitted to other subcluster 3 patients. Such a variant would have been missed as a result of the single colony isolation step preceding WGS. Manual inspection of the corresponding Sanger sequence trace files generated from a separate DNA preparation without the single colony isolation step revealed a double peak at the SNP separating P002 from the hypothetical node mv2 (genomic position 2 156 041) in the bulk isolate of P002, indicating the presence of a mixed population in P002. Alternatively, an unsampled patient isolate (reported as “A,” “B,” and “C” by Genewein et al [17]) might correspond to the central position of subcluster 3.
When plotting the period of isolation of M. tuberculosis strains in the genomic network (Figure 5B), we found no evidence that the different subclusters were associated with specific periods.
Finally, we compared the patient characteristics between the subclusters, excluding subcluster 4 (genetically distant, epidemiologically unrelated) and patient P006, whose isolates belonged to both subclusters 1 and 2. We found that HIV infection was more frequent in subcluster 1 (7 of 17 [41.2%]) than in the other subclusters (3 of 30 [9.7%] in subcluster 2 and 3 of 17 [17.6%] in subcluster 3; P = .04). All 3 subclusters included a majority of individuals from the social milieu (12 of 17 [70.6%] in subcluster 1, 17 of 30 [56.7%] in subcluster 2, and 14 of 17 [82.4%] in subcluster 3; P = .19). Subcluster 3 was associated with 2 particular transmission hotspots: a long-term social integration home (1 of 17 [5.9%] in subcluster 1, 0 of 30 in subcluster 2, and 7 of 17 [41.2%] in subcluster 3; P < .001; Figure 5C), and a meeting point for methadone supply (1 of 17 [5.9%] in subcluster 1, 1 of 30 [3.3%] in subcluster 2, and 5 of 17 [29.4%] in subcluster 3; P = .02).
DISCUSSION
Using a novel combination of a rapid and inexpensive strain-specific SNP screening assay and targeted WGS, we tracked a tuberculosis cluster spanning 21 years and revealed the transmission dynamics among the outbreak patients.
Our study demonstrated the feasibility and advantages of tracking a tuberculosis outbreak by using a strain-specific SNP-based screening assay in a large population-based collection of M. tuberculosis isolates. We subsequently performed targeted WGS on the 69 identified cluster isolates, which, combined with social contact data, enabled us to retrace transmission dynamics at high resolution. The combined cost of 6 initial whole-genome sequences used to design the SNP-typing assay and the subsequent population-wide screening by real-time PCR was low (approximately US$4900), compared with the cost of screening all isolates with any other genotyping method. Additionally, the time required for screening was substantially reduced, making this a powerful approach for identifying and tracking tuberculosis outbreaks in real time. Even though our study was retrospective, our approach could be used to screen isolates prospectively.
Our results indicate that the sensitivity and specificity of this approach are nearly 100%. However, we could only estimate the technical test characteristic because WGS data were not available for the entire collection. Importantly, the performance of a strain-specific SNP-typing assay depends on the selection of SNPs, and the selection of SNPs depends on the isolates initially sequenced. For the successful design of such an assay, we recommend the following: (1) select at least 2 known clustered isolates for WGS, (2) include at least 2 control isolates with genotyping patterns closely related to but different from those of the clustered isolates (eg, MIRU-VNTR), (3) identify SNPs specific to all clustered isolates and absent in the control isolates, (4) exclude SNPs in genes known to be associated with drug resistance, (5) select SNPs suitable for probe and primer design, and (6) use at least 2 SNPs for the screening of isolates, as the specificity of each SNP might vary.
Using our combined approach and linking it to clinical and contact tracing data, we found that the tuberculosis cluster continued to propagate in Bern, mainly in particular transmission hotspots and in the originally described high-risk populations of substance abusers and homeless people [17]. This is consistent with previous reports from other low-incidence settings [4, 19, 26, 27]. The outbreak involved a key patient who caused numerous secondary cases, which corresponds to superspreader behavior. Most outbreak cases occurred between 1991 and 1995, followed by 16 years of sporadic cases, the majority of which were likely cases of reactivation tuberculosis. The cases in the early 1990s coincided with known peaks of heroin abuse in Switzerland. However, 32.4% of all cluster cases involved the nonmilieu population, possibly reflecting transmission from the milieu to the wider community. In retrospect, more secondary cases could have been identified if our novel screening method had been available in the 1990s. Indeed, strain-specific SNP typing would have provided an inexpensive method to identify outbreak cases more rapidly. Furthermore, targeted WGS would have identified superspreaders in a context where contact tracing is particularly difficult. Such superspreader behavior could have then been targeted with intensified control measures to interrupt transmission.
The targeted WGS analyses of all cluster isolates identified by strain-specific SNP typing shed new light on the transmission dynamics of the outbreak, compared with traditional genotyping methods. Whereas MIRU-VNTR and spoligotyping showed identical genotyping patterns, WGS revealed distinct genotypes for 76.5% of the Bernese cluster isolates. In particular, we identified 4 genomic subclusters not revealed by classical genotyping, likely reflecting concomitant but independent clusters of a common ancestral strain. However, the genetic distances between subclusters were small (1, 2, and 3 SNPs between subclusters 1, 2, and 3), and therefore the definition of “subcluster” may be debatable. The subclusters were, however, supported by FST values indicating separation of these populations.
Two sequential isolates from the key patient, isolated in 1988 and 1991, occupied the central positions of subclusters 1 and 3, respectively. This suggests that 2 disease episodes of this patient led to 2 independent star-like patterns in the genomic network, indicating superspreader behavior [12–14]. The central role of this patient was already suspected in the original description of the outbreak [17]. Hence, WGS analyses indicated that this patient likely caused more secondary cases than previously assumed.
Despite the many advantages of WGS, our results also showed that interpreting WGS data has limitations. For example, nearly 25% of cluster isolates were genomically indistinguishable from at least 1 other isolate. This emphasizes the need to include repetitive regions of the genome that are currently excluded because of technical limitations [28, 29]. Furthermore, there is increasing evidence that bacterial populations within patients are heterogeneous as a consequence of ongoing microevolution, further complicating the interpretation of transmission events [30]. In our study, genomes were generated from single colonies for most isolates. Yet, considering potential clonal variants that were randomly excluded from the sequencing process could influence the way transmission events are inferred. With improving sequencing technologies, future studies should sequence bulk isolates rather than single colonies and consider within-host heterogeneity in bacterial populations. Mutations can also arise during laboratory culture; these could be avoided by performing WGS directly from sputum [31].
In conclusion, our strain-specific SNP-based screening approach offers a rapid and inexpensive way of tracking tuberculosis outbreaks retrospectively and prospectively. This novel screening method, combined with targeted WGS, can be used to guide control interventions by rapid and inexpensive screening, revealing transmission hotspots and missing links in transmission chains. Future studies could use this approach in real time to track ongoing outbreaks of tuberculosis and other infectious diseases in hospital settings, as well as population-wide.
Supplementary Data
Supplementary materials are available at The Journal of Infectious Diseases online (http://jid.oxfordjournals.org). Supplementary materials consist of data provided by the author that are published to benefit the reader. The posted materials are not copyedited. The contents of all supplementary data are the sole responsibility of the authors. Questions or messages regarding errors should be addressed to the author.
Notes
Acknowledgments. We thank all of the patients with tuberculosis who participated in this study; the treating physicians and hospitals, as well as the Swiss HIV Cohort Study, for providing clinical information; the Institute for Infectious Diseases, University of Bern, Switzerland, for providing the clinical isolates; and the National Tuberculosis Surveillance Registry at the Federal Office of Public Health, the Bernese Lung Association, and the Cantonal health authorities, for supporting the collection of clinical data and contact-tracing information.
Financial support. This work was supported by the Bernese Lung Association, the Swiss National Science Foundation (grants PP00P3_150750 and 33CS30_134277, to the Swiss HIV Cohort Study), the US National Institutes of Health (grants AI090928 and U01AI069924), and the European Research Council (grant 309540-EVODRTB).
Potential conflicts of interest. All authors: No reported conflicts.
All authors have submitted the ICMJE Form for Disclosure of Potential Conflicts of Interest. Conflicts that the editors consider relevant to the content of the manuscript have been disclosed.
References
- 1.Cook VJ, Shah L, Gardy J, Bourgeois A-C. Recommendations on modern contact investigation methods for enhancing tuberculosis control. Int J Tuberc Lung Dis 2012; 16:297–305. [DOI] [PubMed] [Google Scholar]
- 2.McElroy PD, Rothenberg RB, Varghese R, et al. A network-informed approach to investigating a tuberculosis outbreak: implications for enhancing contact investigations. Int J Tuberc Lung Dis 2003; 7:S486–93. [PubMed] [Google Scholar]
- 3.Cook VJ, Sun SJ, Tapia J, et al. Transmission network analysis in tuberculosis contact investigations. J Infect Dis 2007; 196:1517–27. [DOI] [PubMed] [Google Scholar]
- 4.Anderson LF, Tamne S, Brown T, et al. Transmission of multidrug-resistant tuberculosis in the UK: a cross-sectional molecular and epidemiological study of clustering and contact tracing. Lancet Infect Dis 2014; 14:406–15. [DOI] [PubMed] [Google Scholar]
- 5.Asghar RJ, Patlan DE, Miner MC, et al. Limited utility of name-based tuberculosis contact investigations among persons using illicit drugs: results of an outbreak investigation. J Urban Health 2009; 86:776–80. [DOI] [PMC free article] [PubMed] [Google Scholar]
- 6.Burki T. Tackling tuberculosis in London's homeless population. Lancet 2010; 376:2055–6. [DOI] [PubMed] [Google Scholar]
- 7.Lambregts-van Weezenbeek CSB, Sebek MMGG, van Gerven PJHJ, et al. Tuberculosis contact investigation and DNA fingerprint surveillance in The Netherlands: 6 years’ experience with nation-wide cluster feedback and cluster monitoring. Int J Tuberc Lung Dis 2003; 7:S463–70. [PubMed] [Google Scholar]
- 8.Kato-Maeda M, Metcalfe JZ, Flores L. Genotyping of Mycobacterium tuberculosis: application in epidemiologic studies. Future Microbiol 2011; 6:203–16. [DOI] [PMC free article] [PubMed] [Google Scholar]
- 9.Walker TM, Monk P, Smith EG, Peto TEA. Contact investigations for outbreaks of Mycobacterium tuberculosis: advances through whole genome sequencing. Clin Microbiol Infect 2013; 19:796–802. [DOI] [PubMed] [Google Scholar]
- 10.Gardy JL. Investigation of disease outbreaks with genome sequencing. Lancet Infect Dis 2013; 13:101–2. [DOI] [PubMed] [Google Scholar]
- 11.Bryant JM, Schürch AC, van Deutekom H, et al. Inferring patient to patient transmission of Mycobacterium tuberculosis from whole genome sequencing data. BMC Infect Dis 2013; 13:110. [DOI] [PMC free article] [PubMed] [Google Scholar]
- 12.Gardy JL, Johnston JC, Sui SJH, et al. Whole-genome sequencing and social-network analysis of a tuberculosis outbreak. N Engl J Med 2011; 364:730–9. [DOI] [PubMed] [Google Scholar]
- 13.Roetzer A, Diel R, Kohl TA, et al. Whole genome sequencing versus traditional genotyping for investigation of a Mycobacterium tuberculosis outbreak: a longitudinal molecular epidemiological study. PLoS Med 2013; 10:e1001387. [DOI] [PMC free article] [PubMed] [Google Scholar]
- 14.Walker TM, Ip CL, Harrell RH, et al. Whole-genome sequencing to delineate Mycobacterium tuberculosis outbreaks: a retrospective observational study. Lancet Infect Dis 2013; 13:137–46. [DOI] [PMC free article] [PubMed] [Google Scholar]
- 15.Köser CU, Bryant JM, Becq J, et al. Whole-genome sequencing for rapid susceptibility testing of M. tuberculosis. N Engl J Med 2013; 369:290–2. [DOI] [PMC free article] [PubMed] [Google Scholar]
- 16.Diep BA. Use of whole-genome sequencing for outbreak investigations. Lancet Infect Dis 2013; 13:99–101. [DOI] [PubMed] [Google Scholar]
- 17.Genewein A, Telenti A, Bernasconi C, et al. Molecular approach to identifying route of transmission of tuberculosis in the community. Lancet 1993; 342:841–4. [DOI] [PubMed] [Google Scholar]
- 18.Abubakar I, Stagg HR, Cohen T, et al. Controversies and unresolved issues in tuberculosis prevention and control: a low-burden-country perspective. J Infect Dis 2012; 205:S293–300. [DOI] [PubMed] [Google Scholar]
- 19.Bamrah S, Yelk Woodruff RS, Powell K, Ghosh S, Kammerer JS, Haddad MB. Tuberculosis among the homeless, United States, 1994–2010. Int J Tuberc Lung Dis 2013; 17:1414–9. [DOI] [PMC free article] [PubMed] [Google Scholar]
- 20.Fenner L, Gagneux S, Helbling P, et al. Mycobacterium tuberculosis transmission in a country with low tuberculosis incidence: role of immigration and HIV infection. J Clin Microbiol 2012; 50:388–95. [DOI] [PMC free article] [PubMed] [Google Scholar]
- 21.van Embden JD, Cave MD, Crawford JT, et al. Strain identification of Mycobacterium tuberculosis by DNA fingerprinting: recommendations for a standardized methodology. J Clin Microbiol 1993; 31:406–9. [DOI] [PMC free article] [PubMed] [Google Scholar]
- 22.Stucki D, Malla B, Hostettler S, et al. Two new rapid SNP-typing methods for classifying Mycobacterium tuberculosis complex into the main phylogenetic lineages. PLoS ONE 2012; 7:e41253. [DOI] [PMC free article] [PubMed] [Google Scholar]
- 23.Coscolla M, Lewin A, Metzger S, et al. Novel Mycobacterium tuberculosis complex isolate from a wild chimpanzee. Emerg Infect Dis 2013; 19:969–76. [DOI] [PMC free article] [PubMed] [Google Scholar]
- 24.Excoffier L, Laval G, Schneider S. Arlequin (version 3.0): an integrated software package for population genetics data analysis. Evol Bioinform Online 2005; 1:47–50. [PMC free article] [PubMed] [Google Scholar]
- 25.Rieder HL, Watson JM, Raviglione MC, et al. Surveillance of tuberculosis in Europe. Working Group of the World Health Organization (WHO) and the European Region of the International Union Against Tuberculosis and Lung Disease (IUATLD) for uniform reporting on tuberculosis cases. Eur Respir J 1996; 9:1097–104. [DOI] [PubMed] [Google Scholar]
- 26.Mitruka K, Oeltmann JE, Ijaz K, Haddad MB. Tuberculosis outbreak investigations in the United States, 2002–2008. Emerg Infect Dis 2011; 17:425–31. [DOI] [PMC free article] [PubMed] [Google Scholar]
- 27.Zenner D, Southern J, van Hest R, et al. Active case finding for tuberculosis among high-risk groups in low-incidence countries. Int J Tuberc Lung Dis 2013; 17:573–82. [DOI] [PubMed] [Google Scholar]
- 28.Bryant JM, Harris SR, Parkhill J, et al. Whole-genome sequencing to establish relapse or re-infection with Mycobacterium tuberculosis: a retrospective observational study. Lancet Respir Med 2013; 1:786–92. [DOI] [PMC free article] [PubMed] [Google Scholar]
- 29.Copin R, Coscollá M, Seiffert SN, et al. Sequence diversity in the pe_pgrs genes of Mycobacterium tuberculosis is independent of human T cell recognition. MBio 2014; 5:e00960-00913. [DOI] [PMC free article] [PubMed] [Google Scholar]
- 30.Pérez-Lago L, Comas I, Navarro Y, et al. Whole genome sequencing analysis of intrapatient microevolution in Mycobacterium tuberculosis: potential impact on the inference of tuberculosis transmission. J Infect Dis 2014; 209:98–108. [DOI] [PubMed] [Google Scholar]
- 31.Blainey PC. The future is now: single-cell genomics of bacteria and archaea. FEMS Microbiol Rev 2013; 37:10.1111/1574-6976.12015. [DOI] [PMC free article] [PubMed] [Google Scholar]
Associated Data
This section collects any data citations, data availability statements, or supplementary materials included in this article.