

Background: hGH is an orthotopically expressed oncoprotein associated with mammary epithelial cell tumorigenesis.
Results: The miR-96-182-183 cluster is regulated by autocrine/paracrine hGH and targets BRMS1L and GHR.
Conclusion: Autocrine/paracrine hGH promotes breast cancer epithelial-mesenchymal transition and invasion via stimulating the miRNA-96-182-183 cluster.
Significance: Autocrine/paracrine hGH and the miR-96-182-183 cluster might be exploited as a therapy or prognostic marker for breast cancer.
Keywords: breast cancer, epithelial-mesenchymal transition (EMT), growth hormone, invasion, microRNA (miRNA), BRMS1L, miR-96-182-183 cluster
Abstract
Human growth hormone (hGH) plays critical roles in pubertal mammary gland growth, development, and sexual maturation. Accumulated studies have reported that autocrine/paracrine hGH is an orthotopically expressed oncoprotein that promotes normal mammary epithelial cell oncogenic transformation. Autocrine/paracrine hGH has also been reported to promote mammary epithelial cell epithelial-mesenchymal transition (EMT) and invasion. However, the underlying mechanism remains largely obscure. MicroRNAs (miRNAs) are reported to be involved in regulation of multiple cellular functions of cancer. To determine whether autocrine/paracrine hGH promotes EMT and invasion through modulation of miRNA expression, we performed microarray profiling using MCF-7 cells stably expressing wild type or a translation-deficient hGH gene and identified miR-96-182-183 as an autocrine/paracrine hGH-regulated miRNA cluster. Forced expression of miR-96-182-183 conferred on epithelioid MCF-7 cells a mesenchymal phenotype and promoted invasive behavior in vitro and dissemination in vivo. Moreover, we observed that miR-96-182-183 promoted EMT and invasion by directly and simultaneously suppressing BRMS1L (breast cancer metastasis suppressor 1-like) gene expression. miR-96 and miR-182 also targeted GHR, providing a potential negative feedback loop in the hGH-GHR signaling pathway. We further demonstrated that autocrine/paracrine hGH stimulated miR-96-182-183 expression and facilitated EMT and invasion via STAT3 and STAT5 signaling. Consistent with elevated expression of autocrine/paracrine hGH in metastatic breast cancer tissue, miR-96-182-183 expression was also remarkably enhanced. Hence, we delineate the roles of the miRNA-96-182-183 cluster and elucidate a novel hGH-GHR-STAT3/STAT5-miR-96-182-183-BRMS1L-ZEB1/E47-EMT/invasion axis, which provides further understanding of the mechanism of autocrine/paracrine hGH-stimulated EMT and invasion in breast cancer.
Introduction
Growth hormone (GH)5 is a protein hormone secreted primarily from the anterior pituitary and plays critical roles in mammary gland development at puberty (1). GH is required for mammary gland development, with functions in both the mammary epithelial and stromal compartments, resulting in both ductal elongation and the differentiation of the ductal epithelium into terminal end buds (2, 3). Accumulated studies have demonstrated that autocrine/paracrine hGH is an orthotopically expressed oncoprotein and promotes human mammary epithelial cell oncogenic transformation through several mechanisms by increasing proliferation and survival of immortalized human mammary epithelial cells (4) and enhancing telomerase activity through stabilization of the hTERT mRNA (5). We have further reported that autocrine hGH also promotes epithelial-mesenchymal transition (EMT) in epithelioid breast cancer cells, resulting in an invasive phenotype with increased MMP activity through repression of plakoglobin expression and relocalization of E-cadherin to the cytoplasm (6). However, the detailed mechanism of how hGH regulates EMT and invasion remain obscure.
As small endogenous non-coding RNAs consisting of 21–24 nucleotides, microRNAs (miRNAs) specifically recognize complementary target sequences on the cognate mRNAs and repress gene expression post-transcriptionally by triggering mRNA degradation or translational repression (7). Although highly conserved among different species, miRNAs appear to be highly regulated by developmental stage and tissue specificity and function as context-specific regulators (8). Recent studies have found that miRNAs are widely expressed in the normal pubertal mammary gland and orchestrate mammary gland development by regulating cell proliferation, apoptosis, differentiation, and metabolism (9). Further, deregulation of miRNA expression may result in oncogenic transformation and mammary tumor formation (10). Although elevated autocrine hGH levels have been documented to contribute to breast cancer progression (11), whether hGH should influence the expression pattern and the functional roles of miRNAs in this context remains unknown.
In this study, we performed miRNA expression profiling and identified miR-96-182-183 as a prominent autocrine hGH-regulated miRNA cluster in a breast cancer cell model. We observed that the miR-96-182-183 cluster facilitates EMT and invasion of breast cancer cells through directly targeting BRMS1L. In addition, we demonstrated that autocrine hGH stimulates the expression of the miR-96-182-183 cluster via STAT3/STAT5-binding elements in the promoter region of miR-96-182-183. Collectively, we herein report that autocrine hGH elicited a novel signaling feedback loop centered around the miR-96-182-183 cluster to regulate EMT and invasion in breast cancer.
Experimental Procedures
Cell Lines and Cell Culture
All of the human breast cancer and non-tumorigenic human mammary cell lines used in this study were from the American Type Culture Collection (ATCC) and cultured as recommended.
MicroRNA Microarrays
The miRNA microarray was performed by ChipScreen Bio-tech (Shenzhen, China). Basically, the miRNAs were extracted from MCF-7 MUT and MCF-7 hGH cells using the mirVanaTM miRNA isolation kit (Ambion). miRNA (2 μg) was ligated to a monoreactive Cy3 dye (Amersham Biosciences) using a mirVanaTM miRNA labeling kit (Ambion Inc.) overnight at 4 °C, followed by ethanol precipitation. After overnight hybridization at 37 °C of labeled RNA on NCode human miRNA microarray V3 (Invitrogen, MIRAH305) and extensive washing, slides were scanned using a LuxScanTM 10K (CapitalBio, Ltd.) array scanner, where the photomultiplier settings were automatically adjusted. Microarray images were analyzed using GenePix Pro version 6.0 (Axon, Ltd.). Data were normalized by global average normalization. All flagged spot or background-subtracted spot intensities whose values were below 1000 were removed from the analysis. The miRNA expression were considered as significantly different between the two conditions when the -fold changes of normalized medians were ≥2 or ≤0.5 and p value was <0.05 according to Student's t test. The GEO accession number for microarray analyses is GSE58845.
miRNAs, siRNAs, Plasmid Constructs, and Transfections
miRNA mimics, 2′-O-methylated antisense oligonucleotide (ASO), siRNA targeting BRMS1L, STAT3, and STAT5 mRNA, and their cognate control RNAs were purchased from Genepharma (Shanghai, China). The RNA was transfected using Lipofectamine 2000 (Invitrogen), following the manufacturer's instructions. For the miRNA redundant assay, we inserted perfectly complementary sequences against each miRNA as well as scrambled sequences into psiCHECK2 (Promega), fused to the 3′-UTR of Renilla luciferase. For the miRNA-expressing stable cell line, a DNA fragment about 300 bp upstream and downstream around the miRNA locus was cloned into pBabe-puro retroviral vector to generate the pri-miR-96-183 and pri-miR-182 plasmids. pCMV-BRMS1L plasmid was purchased from Origene. pcDNA3.1-G120R was cloned by substitution of glycine 120 with an arginine in the human GH gene. For miRNA target report assays, the 3′-UTR sequences of BRMS1L, GHR, and miRNA binding sites were amplified from the genomic DNA and subcloned into the psiCHECK2 (Promega). For the miRNA promoter assay, a 2000-bp DNA fragment containing STAT3 and STAT5 binding sites upstream from the miR-96-182-183 precursor was cloned into pGL3-Basic plasmid (Promega). All of the mutant constructs were generated using the QuikChange II XL site-directed mutagenesis kit (Stratagene) and confirmed by sequencing. The plasmid transfection was performed following the manufacturer's instructions using Effectene (Qiagen). RNA oligonucleotide and plasmid co-transfection were performed using Lipofectamine 2000 (Invitrogen). Forty-eight hours after transfection, cells were plated for a functional assay or harvested for RNA and protein analyses.
Cell Function Assays
All functional assays, such as total cell number count, soft agar colony formation assay, two-dimensional or three-dimensional Matrigel assay, and in vitro cell motility (migration, invasion, and wound healing) assays, were carried out as described (12). Colony scattering assays were performed as reported previously (13). All of the images were taken using a phase microscope (Olympus, Tokyo, Japan).
Retrovirus Production and Transduction
The pBabe miRNA-expressed and pBabe control viruses were generated by transfection of pBabe constructs together with the gag/pol and VSV-G plasmids into HEK-293T cells using Effectene (Qiagen). The virus particles were harvested at 48 and 72 h later and filtered by a 0.45-μm filter unit (Millipore). MCF7 cells were infected with recombinant retrovirus-transducing units in the presence of 8 μg/ml Polybrene (Sigma) and then selected with 1 μg/ml puromycin.
Tumor Xenograft in Nude Mice
All animal studies were approved by the Institutional Animal Care and Use Committee, University of Science and Technology of China (USTCACUC1301019). MCF7-pBabe, MCF7 pri-miR-182, and MCF7 pri-miR-96-183 cells were resuspended in a 1:1 solution of PBS and Matrigel (BD Biosciences), and 5 × 10⁶ cells were orthotopically injected into the mammary fat pad or 1.5 × 10⁶ cells were injected into the tail vein of 3–4-week-old female BALB/c nude mice (Hunan Slaccas Co.) as described (4). For MDA-MB-435s cells, 2 × 10⁶ cells (1:1 solution of PBS and Matrigel) were injected into the mammary fat pad of mice for the orthotopic injection model, or 1 × 10⁶ cells were injected directly into the lateral tail vein of 6-week-old female BALB/c nude mice. Tumor growth was analyzed by measuring tumor length (L) and width (W) and calculating tumor volume based on the formula, volume (mm3) = L × W2 × ∏/6. After 8 weeks (MCF7 cells) or 6 weeks (MDA-MB-435s cells), mice were euthanized, and lungs and livers were surgically dissected for histology. Histological analysis with hematoxylin and eosin (H&E) was carried out as described (12).
Immunofluorescence Staining and Confocal Microscopy
For immunofluorescence, cells were seeded on coverslips and fixed with 4% paraformaldehyde/PBS for 30 min at room temperature. After a 5-min permeabilization with 0.1% Triton X-100, cells were blocked with 1% BSA for 1–2 h and incubated with rhodamine phalloidin (20 μg/ml; Molecular Probes) or primary antibodies including GHR and BRMS1L overnight at 4 °C. Then secondary antibodies conjugated with 488 or 647 Alexa dye were applied, and DAPI was used for nuclear staining. Slides were mounted with Slow Fade (Invitrogen), and images were taken using confocal microscopy (Zeiss).
Luciferase Reporter Assay
Cells (5 × 10⁴/well) were seeded at about 60% confluence in 24-well plates. For the miRNA target reporter assay, cells were cotransfected with 0.2 μg of psiCHECK-2 vectors and either 20 pmol of miRNA mimics or negative control using Lipofectamine 2000. For the STAT3- and STAT5-mediated miRNA expression, 0.2 μg of pGL3 Basic luciferase reporters plus 20 pmol of STAT3 or STAT5 siRNAs were transfected into cells using Lipofectamine 2000. pRL-TK plasmid was provided as an internal transfection control. The total cell lysates were harvested 48 h after transfection, and the firefly and Renilla luciferase activities were measured using the Dual-Luciferase reporter assay system (Promega) according to the manufacturer's instructions.
ChIP Assay
Chromatin immunoprecipitation was performed using the EZ ChIP kit (Upstate Biotechnology, Inc., Lake Placid, NY) and carried out following the manufacturer's instructions. The DNA fragments containing a STAT3 or STAT5 binding site upstream of the miR-96-182-183 promoter were measured by quantitative RT-PCR (qRT-PCR).
RNA Isolation, miRNA Array, and qRT-PCR Analysis; Protein Analysis
Total RNA from MCF-7-MUT and MCF-7-hGH cells was prepared using TRIzol (Invitrogen). The miRNA and mRNA were extracted from culture cells and clinical samples using the mirVana miRNA isolation kit (Ambion). RNA was then converted to cDNA using the RevertAid first strand cDNA synthesis kit (Thermo Scientific). The SYBR Premix Ex Taq kit (Takara) was used to determine the expression levels using GAPDH or U6 snRNA as a control. All of the proteins were prepared by modified radioimmune precipitation lysis buffer. Western blot analysis was carried out as described previously with β-ACTIN as input control (14).
Patients and Specimens
The tissue population consisted of 49 consecutive invasive mammary ductal carcinoma and 27 consecutive normal mammary tissues from the First Affiliated Hospital of Anhui Medical University (Hefei, Anhui, China) between 2009 and 2010. The histopathological diagnosis of the specimens was consistent with breast neoplasia in accordance with World Health Organization guidelines (15). Histology grade was analyzed based on the Scarff-Bloom-Richardson system (16). This study was approved by the Institutional Review Board with informed consent of involved patients. The study procedures followed the ethical standards of the responsible committee on human experimentation and with the Helsinki Declaration of 1975, as revised in 2008.
In Situ Hybridization and Immunohistochemistry (IHC) in Formalin-fixed Paraffin-embedded Tissues
In situ hybridization was performed as described previously to show expression of miRNA in normal mammary tissues and breast cancer specimens (14). IHC was carried out as described (17).
Reagents
Media, sera, and antibiotics were from Gibco. Protein electrophoresis reagents were from Bio-Rad. 5′-Digoxigenin-labeled miRCURY LNATM (locked nucleic acid) detection probes for miRNA were from Exiqon (Woburn, MA).
Statistical Analysis
The quantification of Western blot, Immunofluorescence, and immunochemistry were performed on at least three biological replicates using ImageJ. The χ2 test was performed to analyze the correlation between the expression levels of miRNA and BRMS1L and breast cancer patients' clinicopathologic parameters. All experiments were repeated 2–3 times. All numerical data are presented as mean ± S.E. from a representative experiment performed in triplicate, and statistical analyses were assessed by Student's t test. p < 0.05 was considered as significant.
Results
Identification of miR-96-182-183 Cluster as Autocrine hGH-stimulated miRNAs
To determine specific miRNA expression patterns regulated by autocrine hGH in breast cancer cells, we utilized a well characterized cellular model of autocrine hGH expression (18): MCF-7-hGH cells, which stably synthesize and secrete hGH, and MCF-7-MUT cells, which stably express the hGH gene but with the start codon disabled. We verified hGH protein expression in MCF-7-hGH cells by Western blot analysis, whereas no hGH protein was detectable in MCF-7-MUT cells, as described previously (18) (Fig. 1A). We performed microarray profiling by use of this cell model and identified a set of autocrine hGH-regulated miRNAs (Fig. 1, A and B). qRT-PCR of the relative expression levels of four miRNAs (miR-151-5p, miR-342-3p, miR-142-5p, and miR-155) in these two cell lines was performed to verify the microarray data (Fig. 1C). Among these autocrine hGH-regulated miRNAs, we focused on the miR-96-182-183 cluster, which resides within the intergenic region on human chromosome 7q32.2 (Fig. 1C) and has been reported to be processed from a common primary transcript in mice (19). The qRT-PCR data confirmed that miR-96, miR-182, and miR-183 are all highly expressed in MCF-7 hGH cells compared with the cognate control cells, suggesting that they might be regulated and play critical roles in autocrine hGH-mediated functional effects as a group (Fig. 1D).
FIGURE 1.

Autocrine hGH stimulates miR-96-182-183 cluster expression. A, scatter plot of miRNA expression profiling in MCF-7-MUT and MCF-7-hGH cells. hGH expression is shown on the right. B, heat map diagram with hierarchical clustering of miRNAs in MCF-7-MUT and MCF-7-hGH cells. Each row represents an miRNA, and the clustering tree is shown on the left. C, miRNA expression levels in MCF-7-MUT and MCF-7-hGH cells were analyzed by qRT-PCR. D, schematic diagram of miR-96-182-183 cluster on human chromosome 7q32.2. Striped boxes, miRNAs; gray boxes, protein-coding genes UBE2H and NRF1; arrows, transcriptional orientations. E, miRNA expression levels were analyzed by qRT-PCR in 16 human mammary epithelial cell lines. F, luciferase reporter activities of internal miR-96-182-183 expression were performed in MCF-7 and MDA-MB-435s cells. *, p < 0.05; **, p < 0.01; ***, p < 0.001 (Student's t test). Error bars, S.E.
To assess the roles of the miR-96-182-183 cluster in breast cancer cells, we initially executed a preliminary screen for miR-96-182-183 cluster expression by qRT-PCR in three immortalized but otherwise normal human mammary epithelial cells. Five non-metastatic, and eight metastatic breast cancer cell lines. Interestingly, we observed high expression levels of these miRNAs in seven metastatic cell lines (Fig. 1E). Additionally, we observed a strong correlation among the expression levels of miR-96, miR-182, and miR-183 (Pearson coefficient >0.80), further confirming that they function as a cluster. Based on their expression pattern, we chose the non-metastatic MCF-7 and T47D cell lines and metastatic MDA-MB-435s and MDA-MB-468 cell lines for further investigation.
To examine whether the miR-96-182-183 cluster is functionally active in tumor cell lines, we generated luciferase reporter constructs containing perfectly complementary sequences of each miRNA as well as scrambled sequences fused to the 3′-UTR of luciferase. We detected a 20–40% reduction of luciferase activity in MCF-7 cells and a 40–80% decrease in MDA-MB-435s cells, whereas scrambled construct showed luciferase activity similar to that of the empty vector. Collectively, these data indicated that the miR-96-182-183 cluster is expressed and may possess an active role in breast cancer progression.
miR-96-182-183 Cluster Promotes Breast Cancer Cell Migration, Invasion, and EMT in Vitro
Given that the miR-96-182-183 cluster is highly expressed in metastatic breast cancer cells, we next determined the functional role of miR-96-182-183 in breast cancer cell motility through manipulation of their expression levels by transfection of either synthetic miRNA mimics or ASO. We observed that forced expression of miR-96, miR-182, or miR-183 in MCF-7 cells exerted no appreciable effect on cell proliferation or colony formation in soft agar (Fig. 2, A and B) but increased the number and size of colonies as assayed in two- and three-dimensional Matrigel culture (Fig. 2C, a–h). Moreover, MCF-7 cells transfected with miRNA mimics exhibited a spindle-like and a scattered, elongated, and mesenchymal cellular phenotype in two-dimensional culture compared with the typical epithelial-like control cells (Fig. 2C, i–p). Further, transient expression of each miRNA in MCF-7 cells resulted in a more rapid wound closing (Fig. 2D) and a significant increase in cell migration and invasion compared with the control cells (Fig. 2E). Finally, in colony-scattering assays, we observed a 2-fold higher proportion of scattered cells and a 2-fold lower proportion of compact cell colonies in MCF-7 cells with forced expression of each miRNA in comparison (Fig. 2F).
FIGURE 2.

Forced expression of miR-96-182-183 cluster promotes breast cancer cell migration, invasion, and EMT in vitro. A, total cell number assays. 5 × 10³ MCF-7 cells transfected with miRNA mimics were seeded with 10% FBS and counted after 6 days. B, soft agar assay. 5 × 10³ MCF-7 cells transfected with miRNA mimics were seeded in 0.35% agarose. Colonies were counted after incubation for 14 days. C, miR-96-182-183 mimics alter MCF-7 cell morphology. a–d, two-dimensional Matrigel culture for 7 days; e–h, three-dimensional Matrigel culture for 10 days; i–l, monolayer adherent morphology under light field; m–p, rhodamine phalloidin staining of F-actin cytoskeleton was visualized by confocal microscopy. Magnification was ×200 (a–l) and ×400 (m–p). D, wound-healing assay of MCF-7 cells transfected with miRNA mimics or scrambled oligonucleotides. Magnification was ×100. E, transwell migration and invasion assay of MCF-7 cells transfected with miRNA mimics or control. F, 1 × 10³ MCF-7 cells transfected with miRNA mimics or control were seeded in a 10-cm Petri dish. Percentages of each colony category were calculated. G, expression of EMT markers was measured by Western blot after transfection with miRNA mimics in MCF-7 cells (left) or T47D cells (right). H, changes of EMT marker band intensity relative to β-ACTIN intensity in MCF-7 (top) or T47D cells (bottom). *, p < 0.05; **, p < 0.01; ***, p < 0.001 (Student's t test). Error bars, S.E.
Conversely, depletion of miR-96, miR-182, or miR-183 in highly invasive MDA-MB-435s cells by transfection of specific ASO remarkably reduced colony numbers and sizes in two- and three-dimensional culture on Matrigel (Fig. 3C, a–h) and produced a “cobblestone-like” epithelial cellular morphology compared with control cells (Fig. 3C, i–p). Further, miRNA depletion in MDA-MB-435s cells led to a retarded wound closure (Fig. 3D) and a significant reduction in cell migration and invasion compared with control cells (Fig. 3E). In colony scattering assays, we observed a higher percentage of compact cell colonies and a lower proportion of scattered cells with miRNA depletion in MDA-MB-435s cells (Fig. 3F). Similarly, this reduction in cell migration and invasion was not due to impairment of cell viability (Fig. 3, A and B).
FIGURE 3.

miR-96-182-183 cluster depletion inhibits MDA-MB-435s cell migration, invasion and EMT in vitro. A, total cell number assays. 5 × 10³ MDA-MB-435s cells transfected with miRNA ASO were seeded with 10% FBS and counted after 5 days. B, soft agar assay. 5 × 10³ MDA-MB-435s cells transfected with miRNA ASO were seeded in 0.35% agarose. Colonies were counted after incubation for 14 days. C, miR-96-182-183 ASO alters MDA-MB-435s cell morphology. a–d, morphogenesis after cell growth in two-dimensional Matrigel for 5 days was observed under a phase-contrast microscope. e–h, morphogenesis after cell growth in three-dimensional Matrigel for 7 days was observed. i–l, monolayer adherent morphology of MDA-MB-435s cells with depleted expression of miR-96-182-183 under light field. m–p, rhodamine phalloidin staining of F-actin cytoskeleton of cells on monolayer culture were visualized by confocal microscopy. Images were taken at ×200 magnification for a–l and at ×400 magnification for m–p. D, wound-healing assay of MDA-MB-435s cells transfected with miRNA ASO or scrambled oligonucleotides. Images were taken at ×100 magnification. E, transwell migration assay and Matrigel invasion assay of MDA-MB-435s cells transfected with miRNA ASO or scrambled sequences. F, 1 × 10³ MDA-MB-435s cells transfected with miRNA ASO or scrambled sequences were seeded in a 10-cm Petri dish. Percentages of each colony category were calculated. G, the expression of EMT markers was measured by Western blot after transfection with miRNA ASO in MDA-MB-435s cells (left) or MDA-MB-468 cells (right). H, changes of EMT marker band intensity relative to β-ACTIN intensity in MDA-MB-435s (top) or MDA-MB-468 cells (bottom). *, p < 0.05; **, p < 0.01; ***, p < 0.001 (Student's t test); NS, not significant. Error bars, S.E.
Accumulated evidence indicates that promotion of EMT, in which epithelial cells lose cell-cell contacts and exhibit cytoskeletal remodeling and changes in cell polarity, endows cells with mesenchymal morphology and increases cancer cell invasion and metastasis (20). To evaluate whether miR-96-182-183 modulates EMT, we examined the expression of epithelial and mesenchymal markers by Western blot. MCF-7 or T47D cells transfected with miRNA mimics expressed lower levels of the epithelial markers (E-cadherin and plakoglobin; although miR-182 mimics did not alter expression of E-cadherin in MCF-7 cells) and higher levels of the mesenchymal markers (FN1 and vimentin) (Fig. 2, G and H). Conversely, MDA-MB-435s or MDA-MB-468 cells transfected with miRNA ASO exhibited higher levels of epithelial markers (plakoglobin in MDA-MB-435s; E-cadherin and plakoglobin in MDA-MB-468) and lower levels of mesenchymal markers (FN1 and vimentin) (Fig. 3, G and H). Together, these results suggest that forced expression of the miR-96-182-183 cluster is sufficient to promote EMT, migration, and invasion of breast cancer cells in vitro.
miR-96-182-183 Cluster Initiates Tumor Invasion in Vivo
We next asked whether the miR-96-182-183 cluster could initiate invasion and metastasis of otherwise non-metastatic MCF-7 cells in vivo. We therefore constructed two retroviral vectors harboring pri-miR-96-183 and pri-miR-182 and introduced them into MCF-7 cells to produce two stable cell lines, respectively. We further confirmed elevated miR-96/miR-183 expression in MCF-7 pri-miR-96-183 cells and miR-182 expression in MCF-7 pri-miR-182 cells, respectively (Fig. 4A).
FIGURE 4.

miR-96-182-183 cluster initiates tumor invasion and distant metastasis in vivo. A, qRT-PCR analysis of miR-96-182-183 expression in MCF-7 stable cells. B, tumor growth curve of MCF-7-pri-miR-96-183, pri-miR-182, or control cells injected orthotopically in the fat pad of nude mice. C, H&E staining of tumors and lungs isolated from mice orthotopically injected with MCF-7-pri-miR-96-183, pri-miR-182, or control cells. Magnification was ×200. D, the pulmonary micrometastasis nodules in mice were counted. E, tumor tissues were analyzed for EMT marker expression by Western blot (left). Changes of band intensity relative to β-ACTIN intensity (right) are shown. F, Kaplan-Meier survival curve of mice that received tail vein injection of MCF-7-pri-miR-96-183, pri-miR-182, or control cells (n = 8). G, H&E-stained sections of lungs and livers isolated from mice that received tail vein injection at week 8. Magnification was ×200 for lungs and ×400 for livers. H, incidence of lung and liver metastasis in mice with tail vein injection. The χ2 test was used to analyze the correlation between parameters of different groups. *, p < 0.05; **, p < 0.01; ***, p < 0.001 (Student's t test). Error bars, S.E.
Cancer cell metastasis is a process during which cancer cells invade neighboring tissue, disseminate via the circulatory system, and finally grow from micrometastases into larger secondary tumors (21). To evaluate whether the miR-96-182-183 cluster affected tumor invasion, we orthotopically injected 5 × 10⁶ MCF-7-pri-miR-96-183, MCF-7-pri-miR-182, or pBabe control cells into the mammary fat pads of nude mice. At 3.5 weeks postimplantation, we observed a mild increase in the volume of tumors generated by pri-miR-96-183 and pri-miR-182 cells (Fig. 4B). The control tumors were strictly noninvasive, surrounded with well delineated fibrotic capsules (Fig. 4C, a, d, and g). In stark contrast, tumors generated by pri-miR-96-183 or pri-miR-182 cells displayed a massive desmoplastic reaction, with a poorly encapsulated and highly invasive phenotype, including local infiltration into muscle (Fig. 4C, b and c), as well as tumor emboli in blood (Fig. 4C, e and f) and lymph vessels (Fig. 4C, h and i). Moreover, pulmonary metastases were easily detectable in the lungs of host mice injected with pri-miR-96-183 or pri-miR-182 cells (Fig. 4, C (k and l) and D), whereas no metastases were detected in mice injected with control cells (Fig. 4C, j). Additionally, we observed that tumors derived from the pri-miR-96-183 and pri-miR-182 groups expressed lower amounts of epithelial markers (E-cadherin and plakoglobin) and higher amounts of mesenchymal markers (FN1 and vimentin) by Western blot (Fig. 4E) compared with control groups.
We also utilized xenograft models by injection of MDA-MB-435s cells with ASO, orthotopically in the mammary fat pad or directly into the lateral tail vein of nude mice. We observed a significant decline in the expression of miR-96, miR-182, and miR-183 in MDA-MB-435s ASO cells compared with MDA-MB-435s NC cells (Fig. 5A). We next orthotopically injected 2 × 10⁶ MDA-MB-435s ASO or NC cells into the mammary fat pads and found a slight decrease in the volume of tumors generated by MDA-MB-435s ASO cells at 4 weeks postimplantation (Fig. 5B). Moreover, we observed local infiltration into muscle (Fig. 5C, a), tumor emboli in blood and lymph vessels (Fig. 5C, c), and metastasis loci in both lungs (Fig. 5C, e) and livers (Fig. 5C, g) of mice injected with MDA-MB-435s NC cells, whereas none of the above were observed in mice with MDA-MB-435s ASO cells (Fig. 5C, b, d, f, and i). Hence, these results suggest that the miR-96-182-183 cluster initiated invasion of non-metastatic breast cancer cells in vivo.
FIGURE 5.

Depletion of miR-96-182-183 cluster eliminates tumor invasion and distant metastasis in vivo. A, qRT-PCR analysis of miR-96-182-183 expression in MDA-MB-435s ASO cells. B, tumor growth curve of MDA-MB-435s NC or ASO cells injected orthotopically in the fat pad of nude mice. C, H&E staining of tumors, lungs, and livers isolated from mice orthotopically injected with MDA-MB-435s NC or ASO cells. Magnification was ×200. D, H&E-stained sections of lungs and livers isolated from mice that received tail vein injection at week 6. Magnification was ×200 for lungs and ×400 for livers. E, incidence of lung and liver metastasis in mice with tail vein injection. The χ2 test was used to analyze the correlation between parameters of different groups. *, p < 0.05; **, p < 0.01 (Student's t test). Error bars, S.E.
miR-96-182-183 Cluster Initiates Distant Metastasis in Vivo
We further evaluated whether expression of the miR-96-182-183 cluster would impact distant tumor metastasis. To this end, 1.5 × 10⁶ MCF-7 pri-miR-96-183, pri-miR-182, or control cells were directly injected into the circulation of mice, which circumvents the initial steps of local invasion and intravasation (22). Mice injected with MCF-7 pri-miR-96-183 or pri-miR-182 cells via the tail vein started to die 4 weeks postinjection, with a median survival of 5.25 or 6.25 weeks, respectively, whereas mice injected with control cells exhibited a median survival of over 10 weeks (Fig. 4F). To determine the cause of death, we autopsied the mice and observed multiple tumor emboli in both lungs and livers of mice injected with MCF-7-pri-miR-96-183 (8 of 8 in lung; 5 of 8 in liver) or MCF-7-pri-miR-182 cells (8 of 8 in lung; 4 of 8 in liver), whereas no metastases were observed in mice (0 of 8 in lung or liver) injected with control cells (Fig. 4, G and H). Conversely, we injected 1 × 10⁶ MDA-MB-435s NC or ASO cells into the tail vein of mice. We observed fewer tumor emboli in both lungs and livers of mice injected with MDA-MB-435s ASO cells 6 weeks post-tail vein injection, compared with mice injected with MDA-MB-435s NC cells (Fig. 5, D and E). These observations demonstrate that miR-96-182-183 cluster expression drives distant tumor metastasis in breast cancer cells that are otherwise non-metastatic, thereby functioning as a cluster of potently pro-metastatic miRNAs.
BRMS1L Is a Direct and Common Target of miR-96-182-183 Cluster
Given the demonstrated roles of the miR-96-182-183 cluster in breast cancer invasion and metastasis, we next assessed the underlying mechanism whereby this miRNA cluster exerts pro-metastatic properties. We employed three algorithms (MiRanda (23), Pictar (24), and TargetScan (7)) to screen for the potential downstream targets. 217, 215, and 87 genes were predicted to be targets of miR-96, miR-182, and miR-183, respectively, and we identified the common targets predicted by all three programs (Fig. 6A). To further define the putative downstream effectors, we next screened the mRNA expression levels of several genes known to be involved in cancer invasion and metastasis (25) by qRT-PCR in MCF-7 cells transfected with miR-96, miR-182, miR-183 mimics, or control. As shown in the heat map, several key genes (ZEB genes, MMP genes, CDH1, JUP, FN1, and VIM) that are involved in EMT, cancer invasion, and metastasis were modulated by the miR-96-182-183 cluster (Fig. 6B). By a combination of these two strategies, two genes attracted our attention: BRMS1L and GHR. BRMS1L possesses 79% homology in amino acid sequence to BRMS1 (breast cancer metastasis suppressor) (26), which is often deleted in breast cancer patients and suppresses metastasis, but not tumorigenicity, of melanoma and breast cancer cells (27, 28).
FIGURE 6.

miR-96–182-183 cluster promotes migration, invasion and EMT by directly targeting BRMS1L. A, three computational algorithms identified 87 putative target genes of miR-183. B, heat map depicting the mRNA expression profile of an array of genes involved in cancer invasion and metastasis by qRT-PCR in MCF-7 cells transfected with miRNA mimics or control. C, schematic diagram of miR-96-182-183 binding sites on BRMS1L mRNA. ATG, start codon; CDS, coding sequence; TAA, stop codon. Luciferase activity with wild type or mutant 3′-UTRs was performed after co-transfection with miRNA mimics or control in MCF-7 cells. D, the BRMS1L, ZEB1, and E47 protein levels were measured by Western blot after transfection with miRNA mimics in MCF-7 cells (left). Changes of band intensity relative to β-ACTIN intensity (right) are shown. E, BRMS1L was measured by immunofluorescence staining after transfection with miRNA mimics in MCF-7 cells. The number indicates the relative change of fluorescence intensity. Magnification was ×200. F, expression of BRMS1L was analyzed by Western blot in 16 human mammary epithelial cell lines (top). Changes of band intensity relative to β-ACTIN intensity (bottom) are shown. G, decreased expression of epithelial markers and increased expression of mesenchymal markers in MCF-7 cells by forced miR-96-182-183 expression were rescued via BRMS1L overexpression (left). Changes of band intensity relative to β-ACTIN intensity (right) are shown. H, miR-96-182-183 overexpression enhanced cell migration and invasion were abrogated by BRMS1L overexpression. *, p < 0.05; **, p < 0.01; ***, p < 0.001 (Student's t test). Error bars, S.E.
We next determined whether BRMS1L is a direct target of the miR-96-182-183 cluster. The 3′-UTR of BRMS1L mRNA contains one element that is partially complementary to miR-183 and the other site that matches both miR-96 and miR-182 (Fig. 6C). We therefore cloned the wild type or mutant of BRMS1L 3′-UTR, which deleted the complementary sequences and hence cannot be recognized by cognate miRNAs, into the luciferase reporter plasmid psi-CHECK2 and transfected these constructs with miRNA mimics into MCF-7 cells. We observed that all three miRNAs significantly repressed the relative luciferase activities, whereas the mutated 3′-UTR abrogated the repression (Fig. 6C). Furthermore, we measured the effects of these miRNAs on BRMS1L expression. Forced expression of each miRNA markedly inhibited BRMS1L at both mRNA (Fig. 6B) and protein levels (Fig. 6, D and E). We next detected BRMS1L expression by Western blot in 16 normal human mammary epithelial cell and breast cancer cell lines. Consistently, we observed higher expression in three normal human mammary epithelial cells and five non-metastatic cell lines, whereas lower BRMS1L expression was observed in eight metastatic cell lines (p = 0.002), negatively correlated with expression of mi-96-182-183 (Figs. 1E and 6F). Collectively, BRMS1L is a bona fide and common target of the miR-96-182-183 cluster.
BRMS1L Regulates EMT by Repressing ZEB1 and E47
We next attempted to determine the mechanism whereby BRMS1L regulates the EMT process. Previous studies have reported that EMT could be induced by several zinc finger proteins, including the SNAIL (SNAIL, SLUG, and SMUC), ZEB (ZEB1 and ZEB2), and bHLH (E47 and TWIST1) families (20). We screened the expression levels of these proteins in MCF-7 cells transfected with miR-96, miR-182, or miR-183 mimics or control. Among those genes, ZEB1 and E47 were significantly up-regulated with overexpression of the miR-96-182-183 cluster in MCF-7 cells (Fig. 6D). Moreover, ZEB1 and E47 were down-regulated after forced expression of BRMS1L (Fig. 6G), suggesting that BRMS1L suppresses EMT via ZEB1 and E47. We further asked whether BRMS1L was required for miR-96-182-183-mediated EMT, migration, and invasion of breast cancer cells. Forced expression of BRMS1L in MCF-7 cells could rescue decreased expression of epithelial markers (E-cadherin and plakoglobin) and elevated expression of ZEB1, E47, and mesenchymal markers (FN1 and vimentin) consequent to forced expression of miR-96-182-183 (Fig. 6G). Moreover, forced expression of BRMS1L reduced the enhanced migration and invasion of MCF-7 cells consequent to expression of miR-96-182-183 (Fig. 6H). Overall, BRMS1L appears to be a critical mediator for miR-96-182-183 cluster-mediated EMT, migration, and invasion of breast cancer cells via repression of ZEB1 and E47.
GHR Is Another Direct Target of miR-96 and miR-182
GHR is a member of the type I cytokine receptor superfamily and functions as a transmembrane receptor for GH. Upon binding of GH, GHR activates intracellular signaling pathways, modulating cell growth and survival (29). It has been reported that the effects of autocrine hGH on human breast cancer cell behavior are mediated via the GHR (30) or GHR-prolactin receptor heterodimers (31). Interestingly, we identified an element complementary to miR-96 and miR-182 in the GHR 3′-UTR (Fig. 7A). We therefore determined whether GHR could be another direct target of the miR-96-182-183 cluster. We observed that only miR-96 and miR-182, but not miR-183, inhibited the relative luciferase activities of wild type GHR 3′-UTR, whereas mutation of the miRNA binding site abrogated the inhibition (Fig. 7A). Further, we observed that forced expression of miR-96 or miR-182, but not miR-183, could repress GHR expression (Fig. 7, B and D) in MCF-7 cells, whereas miR-96 or miR-182 depletion increased GHR expression in MDA-MB-435s cells (Fig. 7, C and E). To further ascertain whether miR-96 or miR-182 targets GHR in vivo, we performed IHC and observed that GHR expression levels were significantly lower in tumors derived from MCF-7 pri-miR-96-183 and pri-miR-182 cells compared with tumors from control cells (Fig. 7F). Thus, GHR is another direct target of miR-96 and miR-182.
FIGURE 7.

GHR is another direct target of miR-96 and miR-182. A, schematic diagram of miR-96 and miR-182 binding sites on GHR mRNA. ATG, start codon; CDS, coding sequence; TAG, stop codon. Luciferase activity were performed after co-transfection with miRNA mimics or control in MCF-7 cells. B–E, GHR protein levels were measured by Western blot and immunofluorescence staining after transfection with miRNA mimics in MCF-7 cells (B (left) and D) or with miRNA ASO in MDA-MB-435s cells (C (left) and E). Changes of band intensity relative to β-ACTIN intensity (B and C, right) are shown. The number in D and E indicates the relative change of fluorescence intensity. Magnification was ×200. F, GHR expression in tumor sections by IHC. The number represents the percentage of DAB-positive staining in tissues. Magnification was ×400. G, relative miRNA expression by qRT-PCR in MCF-7-hGH cells transfected with pcDNA3.1-G120R. H, Western blot showed that autocrine hGH repressed BRMS1L and promoted MCF-7 cell EMT, and the effects were abrogated by miR-96-182-183 depletion (left). Changes of band intensity relative to β-ACTIN intensity (right) are shown. I, transwell assay revealed that the promotion of MCF-7 cell migration and invasion by autocrine hGH was diminished by miR-96-182-183 depletion. *, p < 0.05; **, p < 0.01; ***, p < 0.001 (Student's t test). Error bars, S.E.
We next determined whether the increased expression of miR-96-182-183 cluster by autocrine hGH is mediated via interaction with GHR. hGH-G120R is a mutant form of human GH with substitution of glycine 120 with an arginine and is widely used as GH antagonist by preventing GHR dimerization (32). Transfection of MCF-7 hGH cells with hGH G120R expression vector resulted in dramatically reduced expression of the miR-96-182-183 cluster (Fig. 7G), indicating that hGH stimulates miR-96-182-183 cluster expression via the GHR. Thus, a negative feedback loop exists within the hGH-GHR-miR-96-182-183 cluster axis.
To examine whether the effects of autocrine hGH on breast cancer cell EMT and invasion are mediated by the miR-96-182-183 cluster, we further transfected miR-96-182-183 ASO mix into MCF-7 hGH and MUT cells. Consistent with our previous finding that hGH could reduce plakoglobin expression (6), we observed that hGH promoted EMT, migration, and invasion of MCF-7 cells via increased expression of miR-96-182-183, ZEB1, and E47 as well as BRMS1L depletion (Fig. 7, H and I). Collectively, these observations indicate that autocrine hGH promotes EMT and invasive behavior of breast cancer cells via a GHR-miR-96-182-183 cluster-BRMS1L-ZEB1/E47 axis.
Autocrine hGH Stimulates miR-96-182-183 Cluster Expression via STAT3 and STAT5
We next determined which pathways mediate autocrine hGH-stimulated miR-96–182-183 cluster expression. It has been reported that GH activation of the GHR stimulates several signaling pathways important for cell growth and survival, including the JAK2/STAT, c-Src/p44/42 MAPK, and PI3K/AKT pathways (33). rVista version 2.0 was employed to screen potential conserved transcription factor binding sites in the 5 kb region upstream of miR-96-182-183 precursor (34). Interestingly, we identified two conserved STAT3 binding motifs and one conserved STAT5 binding site upstream of the transcription start site (+1) of the human miR-183 stem-loop (Fig. 8A). As expected (35), we observed higher phospho-STAT3 and phospho-STAT5 levels in MCF-7 hGH cells compared with MCF-7 MUT cells (Fig. 8C). We next performed ChIP analysis to validate whether STAT signaling controls miR-96-182-183 expression by binding to these putative sites. The ChIP assay revealed that, upon autocrine hGH stimulation, STAT3 and STAT5 directly binds to the promoter region of miR-96-182-183 cluster (Fig. 8B). Further, we constructed a 2-kb fragment upstream of the miRNA cluster precursor subcloned into pGL3 luciferase reporter plasmid. We observed that the relative luciferase activity increased 8-fold upon autocrine hGH stimulation, whereas depletion of STAT3 or STAT5 by use of specific STAT3 or STAT5 siRNA (Fig. 8C) significantly abolished the increase (Fig. 8D). Additionally, depletion of STAT3 or STAT5 markedly abrogated the autocrine hGH-stimulated increased expression of miR-96-182-183 cluster and mesenchymal markers (FN1 and vimentin) as well as diminished expression of BRMS1L and epithelial markers (E-cadherin and plakoglobin) (Fig. 8, E and F). Overall, these findings indicate that autocrine hGH modulates miR-96-182-183 expression via the STAT3 and STAT5 signaling pathways.
FIGURE 8.

Autocrine hGH stimulates miR-96-182-183 cluster expression via STAT3 and STAT5. A, bioinformatic analysis predicted two STAT3 motifs (gray box) and one STAT5 (black box) motif in the 5-kb regulatory region upstream of miR-96-182-183 precursor. The numbers indicate distance relative to the transcription start site (+1). The white box represents negative control sequence for the ChIP assay. B, ChIP assay by qRT-PCR in MCF-7-MUT and MCF-7-hGH cells. C, the expression of phospho-STAT3, total STAT3, phospho-STAT5, STAT5A, and STAT5B was detected by Western blot. β-ACTIN served as input control (left). Changes of band intensity relative to β-ACTIN intensity (right) are shown. D, luciferase assays for promoter activity in MCF-7-MUT and MCF-7-hGH cells transfected with STAT3 or STAT5 siRNA. E, qRT-PCR analysis of miR-96-182-183 and BRMS1L expression after STAT3 or STAT5 siRNA transfection in MCF-7-MUT or MCF-7-hGH cells. F, STAT3 or STAT5 siRNA abrogated autocrine hGH-mediated EMT change (left). Changes of band intensity relative to β-ACTIN intensity (right) are shown. *, p < 0.05; **, p < 0.01; ***, p < 0.001 (Student's t test). Error bars, S.E.
miR-96-182-183 Cluster Expression Is Elevated in Metastatic Breast Tumors
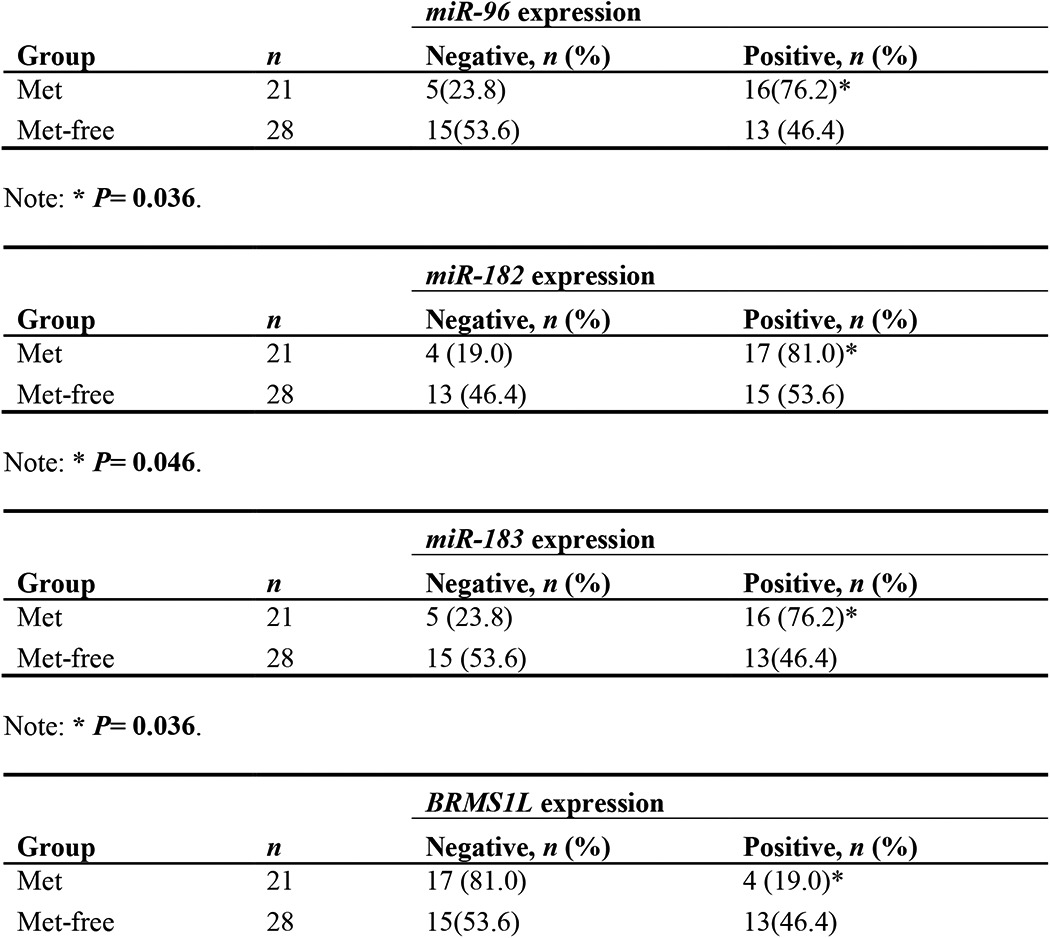
To determine whether miR-96-182-183 expression correlates with clinical outcome in breast cancer patients, we initially examined their expression levels by qRT-PCR in archived breast tissue specimens from patients with benign breast diseases (normal, n = 27), primary non-metastatic tumors (metastasis-free, n = 28) and aggressive metastatic tumors (metastatic, n = 21). Compared with normal tissue, we observed significantly higher levels of miR-96-182-183 and lower levels of BRMS1L in samples from patients with primary breast tumors (Fig. 9, A and B, and Table 1). Significantly increased levels of miR-96-182-183 and lower levels of BRMS1L were observed in tumors from the patients with lymph node metastases compared with the tumors from patients without metastases (Fig. 9, A and B, and Table 2).
FIGURE 9.

miR-96-182-183 cluster expression is elevated in metastatic breast tumors. A, heat map shows the expression profile of miRNAs and BRMS1L by qRT-PCR. B, expression of miRNAs and BRMS1L was detected by qRT-PCR in benign and malignant breast tissues. C, expression of miRNAs was examined by in situ hybridization, and expression of hGH, GHR, and BRMS1L was detected by IHC in formalin-fixed paraffin-embedded breast cancer specimens and normal mammary specimens. Magnification was ×400. D, quantification of miRNAs and hGH, GHR, and BRMS1L levels in formalin-fixed paraffin-embedded breast cancer specimens and normal mammary specimens. The values represent the average percentage of DAB-positive cells. E, schematic representation reveals the signaling pathway of the miR-96-182-183 cluster involved in regulation of breast cancer EMT and invasion. n.s., not significant; *, p < 0.05; **, p < 0.01; ***, p < 0.001 (Student's t test). Error bars, S.E.
TABLE 1.
Expression levels of miR-96-182-183 cluster and BRMS1L in human breast cancer (BC) specimens and normal breast tissues
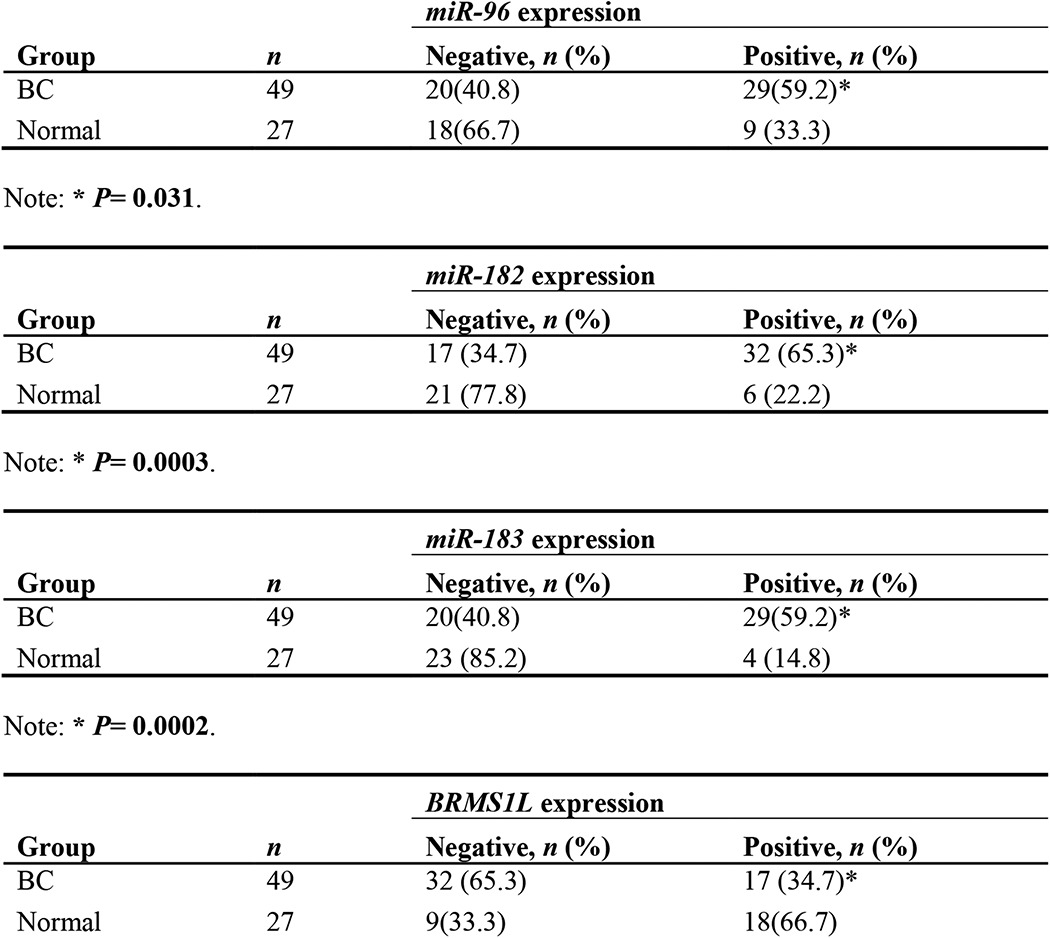
TABLE 2.
Expression levels of miR-96-182-183 cluster and BRMS1L in metastasis-free breast cancer (Met-free) specimens and metastatic breast cancer (Met) specimens
To further confirm that miR-96-182-183 cluster expression is elevated in metastatic breast tumors, we utilized in situ hybridization to detect the abundance of the three miRNAs as well as IHC to examine the protein levels of hGH, GHR, and BRMS1L in fresh benign breast tissues, primary non-metastatic tumors, and metastatic tumors. Consistent with our previous report (11, 36, 37), higher expression levels of hGH and GHR were observed in metastatic tumors compared with normal tissues and non-metastatic tumors (Fig. 9, C and D). Concordantly, we also found metastatic tumors possess the highest expression levels of the miR-96-182-183 cluster and the lowest levels of BRMS1L (Fig. 9, C and D). Together, these data indicate that miR-96-182-183 cluster expression is maximally elevated in metastatic breast tumors along with the increased expression of autocrine hGH.
Discussion
Female mammary gland development commences in the embryonic period and sequentially proceeds through puberty, pregnancy, lactation, and involution (38). During these different stages, mammary gland development is precisely controlled by a variety of endocrine and paracrine signals, such as estrogen, GH, progesterone, and prolactin (9). In addition to being secreted from the anterior pituitary gland, GH is also secreted by the mammary gland in an autocrine/paracrine manner and thereby plays critical roles in mammary gland development and differentiation (2, 3). Increased expression of autocrine GH has been demonstrated to be implicated in breast cancer initiation and progression through IGF-1-dependent or -independent pathways. Although the GH/IGF-1 axis has emerged as an important mediator of tumor development and progression (39), we and other groups showed that in an IGF-1-independent context, autocrine GH expression enhances breast cancer cell proliferation, transformation, survival, and angiogenesis both in vitro and in vivo by up-regulation of an array of oncogenes, including hTERT, MMP genes, VEGF, HOXA1, and TFF3 (35, 41). However, the underlying mechanism of how hGH regulates EMT and invasion remains largely obscure.
In this study, we screened and profiled autocrine hGH-stimulated miRNA expression patterns and observed nine up-regulated and 24 down-regulated miRNAs. Several of these miRNAs have been well documented in other studies. For example, miR-151-5p has been validated to be frequently amplified and promote invasion and metastasis in hepatocellular carcinoma (42) and breast cancer (43). Conversely, miR-20b was reported to modulate HIF-1 and VEGF expression in breast cancer, and miR-137 is down-regulated in colorectal cancer and suppresses cell invasion and metastasis, suggesting their tumor suppressor functions (44, 45). The miR-96-182-183 cluster has been reported to modulate cancer invasion and metastasis in liver cancer (46), melanoma (47), prostate cancer (48), and breast cancer (49). Hundreds of putative targets of this cluster were identified by bioinformatics analysis (Fig. 6A). We utilized both in silico analysis and mRNA expression screening to identify a novel target, BRMS1L, which was further verified to be simultaneously targeted by all three miRNAs in this cluster and serve as a downstream effector to mediate autocrine hGH-promoted EMT and invasion of breast cancer cells. BRMS1L is a member of the same family as mSds3 and BRMS1, which share a conserved Sds3-like domain (26). BRMS1 is frequently deleted in breast cancer patients and is known to inhibit metastasis but not the growth of melanoma and breast cancer cells (27). However, the role of BRMS1L remains largely unknown. BRMS1L is a component of the mSin3a family of histone deacetylase complexes, which promotes histone deacetylation and nucleosome remodeling, leading to transcriptional silencing (50). Multiple components of SIN3 complexes possess suppressor roles in cancer, and a recent study reported that BRMS1L suppressed metastasis in non-small cell lung cancer cells (51). We demonstrated herein that BRMS1L could repress invasion and EMT in breast cancer cells via repression of ZEB1 and E47.
We also identified GHR to be another direct target of miR-96 and miR-182. It has been reported that the functions of autocrine hGH on human breast cancer cells are mediated via the GHR (30) or GHR-prolactin receptor heterodimers (31). hGH binds to both GHR and prolactin receptor in humans and promotes GHR-GHR or GHR-prolactin receptor conformational changes to activate the downstream oncogenic signaling pathways (31). Interestingly, we found that after induction by autocrine hGH, miR-96 and miR-182 could target GHR and thereby introduce a negative feedback loop in the hGH-GHR-miR-96-182-183 axis.
JAK2/STATs are among the major signaling pathways activated by hGH, and STAT proteins could regulate cell growth, differentiation, migration, and survival in multiple cell types (33). We have reported that STAT3 mediates the oncogenic effects of autocrine hGH, including proliferation, migration, and invasion, in endometrial carcinoma cells (52). Although there are some controversies about the roles of STAT5 in cancer initiation and progression (53–56), our results suggested that there are two STAT3 binding sites and one STAT5 binding site in the promoter region of the miR-96-182-183 cluster and that depletion of either STAT3 or STAT5 decreased miRNA cluster expression and inhibited the EMT process, which is consistent with our previous reports that both STAT3 and STAT5 are activated in response to autocrine hGH (13, 52). Determination of the precise role of STAT5 in human breast cancer progression requires significant further study. We had previously reported that autocrine hGH stimulated epithelial to mesenchymal transition and invasion of mammary carcinoma cells through repression of plakoglobin and relocalization of E-cadherin without alteration in E-cadherin expression (6, 40). However, in the present study, we now observe autocrine hGH repression of E-cadherin, albeit slight. It is possible that the later passages of the stable cell lines used in this study have phenotypically evolved, perhaps epigenetically, such that E-cadherin expression is now regulated by autocrine hGH (40). In any case, autocrine hGH expression in mammary carcinoma cells resulted in disruption of the adherent junctions in both studies with resultant EMT and cell invasion.
In summary, in this study, we have reported that autocrine hGH regulates specific miRNA expression and have further examined the functional roles and underlying mechanism of miR-96-182-183 in promoting breast cancer EMT and invasion. We have elucidated a novel hGH-GHR-STAT3/STAT5-miR-96-182-183/BRMS1L-ZEB1/E47-EMT-invasion axis (Fig. 9E), which sheds new light on the mechanism of autocrine hGH-stimulated EMT and invasion of breast cancer cells. Our findings suggest that autocrine hGH and the miR-96-182-183 cluster might be exploited as prognostic markers or therapy targets for breast cancer.
This work was supported by the National Key Scientific Program of China (2012CB934002), the Chinese Academy of Science (XDA01040410), National Natural Science Foundation of China (81272925, 81472494, 81302322, 81402191), CAS President's International Fellowship Initiative (2015VBA031) and the Cancer Science Institute of Singapore through grants from the ministry of education and the National Research Foundation of Singapore.
- GH
- growth hormone
- hGH
- human growth hormone
- miRNA
- microRNA
- EMT
- epithelial-mesenchymal transition
- ASO
- antisense oligonucleotide
- qRT-PCR
- quantitative RT-PCR
- IHC
- immunohistochemistry
- GHR
- growth hormone receptor
- NC
- negative control.
References
- 1. Zhu T., Goh E. L., Graichen R., Ling L., Lobie P. E. (2001) Signal transduction via the growth hormone receptor. Cell. Signal. 13, 599–616 [DOI] [PubMed] [Google Scholar]
- 2. Kleinberg D. L. (1997) Early mammary development: growth hormone and IGF-1. J. Mammary Gland Biol. Neoplasia 2, 49–57 [DOI] [PubMed] [Google Scholar]
- 3. Walden P. D., Ruan W., Feldman M., Kleinberg D. L. (1998) Evidence that the mammary fat pad mediates the action of growth hormone in mammary gland development. Endocrinology 139, 659–662 [DOI] [PubMed] [Google Scholar]
- 4. Zhu T., Starling-Emerald B., Zhang X., Lee K. O., Gluckman P. D., Mertani H. C., Lobie P. E. (2005) Oncogenic transformation of human mammary epithelial cells by autocrine human growth hormone. Cancer Res. 65, 317–324 [PubMed] [Google Scholar]
- 5. Emerald B. S., Chen Y., Zhu T., Zhu Z., Lee K. O., Gluckman P. D., Lobie P. E. (2007) αCP1 mediates stabilization of hTERT mRNA by autocrine human growth hormone. J. Biol. Chem. 282, 680–690 [DOI] [PubMed] [Google Scholar]
- 6. Mukhina S., Mertani H. C., Guo K., Lee K. O., Gluckman P. D., Lobie P. E. (2004) Phenotypic conversion of human mammary carcinoma cells by autocrine human growth hormone. Proc. Natl. Acad. Sci. U.S.A. 101, 15166–15171 [DOI] [PMC free article] [PubMed] [Google Scholar]
- 7. Bartel D. P. (2009) MicroRNAs: target recognition and regulatory functions. Cell 136, 215–233 [DOI] [PMC free article] [PubMed] [Google Scholar]
- 8. Lagos-Quintana M., Rauhut R., Yalcin A., Meyer J., Lendeckel W., Tuschl T. (2002) Identification of tissue-specific microRNAs from mouse. Curr. Biol. 12, 735–739 [DOI] [PubMed] [Google Scholar]
- 9. Piao H. L., Ma L. (2012) Non-coding RNAs as regulators of mammary development and breast cancer. J. Mammary Gland Biol. Neoplasia 17, 33–42 [DOI] [PMC free article] [PubMed] [Google Scholar]
- 10. Calin G. A., Croce C. M. (2006) MicroRNA signatures in human cancers. Nat. Rev. Cancer 6, 857–866 [DOI] [PubMed] [Google Scholar]
- 11. Wu Z. S., Yang K., Wan Y., Qian P. X., Perry J. K., Chiesa J., Mertani H. C., Zhu T., Lobie P. E. (2011) Tumor expression of human growth hormone and human prolactin predict a worse survival outcome in patients with mammary or endometrial carcinoma. J. Clin. Endocrinol. Metab. 96, E1619–E1629 [DOI] [PubMed] [Google Scholar]
- 12. Pandey V., Perry J. K., Mohankumar K. M., Kong X. J., Liu S. M., Wu Z. S., Mitchell M. D., Zhu T., Lobie P. E. (2008) Autocrine human growth hormone stimulates oncogenicity of endometrial carcinoma cells. Endocrinology 149, 3909–3919 [DOI] [PMC free article] [PubMed] [Google Scholar]
- 13. Tang J. Z., Zuo Z. H., Kong X. J., Steiner M., Yin Z., Perry J. K., Zhu T., Liu D. X., Lobie P. E. (2010) Signal transducer and activator of transcription (STAT)-5A and STAT5B differentially regulate human mammary carcinoma cell behavior. Endocrinology 151, 43–55 [DOI] [PubMed] [Google Scholar]
- 14. Qian P., Zuo Z., Wu Z., Meng X., Li G., Wu Z., Zhang W., Tan S., Pandey V., Yao Y., Wang P., Zhao L., Wang J., Wu Q., Song E., Lobie P. E., Yin Z., Zhu T. (2011) Pivotal role of reduced let-7g expression in breast cancer invasion and metastasis. Cancer Res. 71, 6463–6474 [DOI] [PubMed] [Google Scholar]
- 15. Tavassoéli F. A., Devilee P. (2003) Pathology and Genetics of Tumours of the Breast and Female Genital Organs: IARC WHO Classification of Tumours, World Health Organization, Geneva [Google Scholar]
- 16. Elston C. W., Ellis I. O. (1991) Pathological prognostic factors in breast cancer: I. the value of histological grade in breast cancer: experience from a large study with long-term follow-up. Histopathology 19, 403–410 [DOI] [PubMed] [Google Scholar]
- 17. Kong X., Li G., Yuan Y., He Y., Wu X., Zhang W., Wu Z., Chen T., Wu W., Lobie P. E., Zhu T. (2012) MicroRNA-7 inhibits epithelial-to-mesenchymal transition and metastasis of breast cancer cells via targeting FAK expression. PLoS One 7, e41523. [DOI] [PMC free article] [PubMed] [Google Scholar]
- 18. Kaulsay K. K., Mertani H. C., Törnell J., Morel G., Lee K. O., Lobie P. E. (1999) Autocrine stimulation of human mammary carcinoma cell proliferation by human growth hormone. Exp. Cell Res. 250, 35–50 [DOI] [PubMed] [Google Scholar]
- 19. Weston M. D., Pierce M. L., Rocha-Sanchez S., Beisel K. W., Soukup G. A. (2006) MicroRNA gene expression in the mouse inner ear. Brain Res. 1111, 95–104 [DOI] [PubMed] [Google Scholar]
- 20. Thiery J. P., Acloque H., Huang R. Y., Nieto M. A. (2009) Epithelial-mesenchymal transitions in development and disease. Cell 139, 871–890 [DOI] [PubMed] [Google Scholar]
- 21. Fidler I. J. (2003) The pathogenesis of cancer metastasis: the “seed and soil” hypothesis revisited. Nat. Rev. Cancer 3, 453–458 [DOI] [PubMed] [Google Scholar]
- 22. Valastyan S., Reinhardt F., Benaich N., Calogrias D., Szász A. M., Wang Z. C., Brock J. E., Richardson A. L., Weinberg R. A. (2009) A pleiotropically acting microRNA, miR-31, inhibits breast cancer metastasis. Cell 137, 1032–1046 [DOI] [PMC free article] [PubMed] [Google Scholar] [Retracted]
- 23. John B., Enright A. J., Aravin A., Tuschl T., Sander C., Marks D. S. (2004) Human microRNA targets. PLoS Biol. 2, e363. [DOI] [PMC free article] [PubMed] [Google Scholar]
- 24. Krek A., Grün D., Poy M. N., Wolf R., Rosenberg L., Epstein E. J., MacMenamin P., da Piedade I., Gunsalus K. C., Stoffel M., Rajewsky N. (2005) Combinatorial microRNA target predictions. Nat. Genet. 37, 495–500 [DOI] [PubMed] [Google Scholar]
- 25. Qian P., Banerjee A., Wu Z. S., Zhang X., Wang H., Pandey V., Zhang W. J., Lv X. F., Tan S., Lobie P. E., Zhu T. (2012) Loss of SNAIL regulated miR-128-2 on chromosome 3p22.3 targets multiple stem cell factors to promote transformation of mammary epithelial cells. Cancer Res. 72, 6036–6050 [DOI] [PubMed] [Google Scholar]
- 26. Nikolaev A. Y., Papanikolaou N. A., Li M., Qin J., Gu W. (2004) Identification of a novel BRMS1-homologue protein p40 as a component of the mSin3A/p33(ING1b)/HDAC1 deacetylase complex. Biochem. Biophys. Res. Commun. 323, 1216–1222 [DOI] [PubMed] [Google Scholar]
- 27. Meehan W. J., Welch D. R. (2003) Breast cancer metastasis suppressor 1: update. Clin. Exp. Metastasis 20, 45–50 [DOI] [PubMed] [Google Scholar]
- 28. Gong C., Qu S., Lv X. B., Liu B., Tan W., Nie Y., Su F., Liu Q., Yao H., Song E. (2014) BRMS1L suppresses breast cancer metastasis by inducing epigenetic silence of FZD10. Nat. Commun. 5, 5406. [DOI] [PubMed] [Google Scholar]
- 29. Waters M. J., Shang C. A., Behncken S. N., Tam S. P., Li H., Shen B., Lobie P. E. (1999) Growth hormone as a cytokine. Clin. Exp. Pharmacol. Physiol. 26, 760–764 [DOI] [PubMed] [Google Scholar]
- 30. Kaulsay K. K., Zhu T., Bennett W., Lee K. O., Lobie P. E. (2001) The effects of autocrine human growth hormone (hGH) on human mammary carcinoma cell behavior are mediated via the hGH receptor. Endocrinology 142, 767–777 [DOI] [PubMed] [Google Scholar]
- 31. Xu J., Zhang Y., Berry P. A., Jiang J., Lobie P. E., Langenheim J. F., Chen W. Y., Frank S. J. (2011) Growth hormone signaling in human T47D breast cancer cells: potential role for a growth hormone receptor-prolactin receptor complex. Mol. Endocrinol. 25, 597–610 [DOI] [PMC free article] [PubMed] [Google Scholar]
- 32. Harding P. A., Wang X., Okada S., Chen W. Y., Wan W., Kopchick J. J. (1996) Growth hormone (GH) and a GH antagonist promote GH receptor dimerization and internalization. J. Biol. Chem. 271, 6708–6712 [DOI] [PubMed] [Google Scholar]
- 33. Brooks A. J., Waters M. J. (2010) The growth hormone receptor: mechanism of activation and clinical implications. Nat. Rev. Endocrinol. 6, 515–525 [DOI] [PubMed] [Google Scholar]
- 34. Loots G. G., Ovcharenko I. (2004) rVISTA 2.0: evolutionary analysis of transcription factor binding sites. Nucleic Acids Res. 32, W217–W221 [DOI] [PMC free article] [PubMed] [Google Scholar]
- 35. Perry J. K., Mohankumar K. M., Emerald B. S., Mertani H. C., Lobie P. E. (2008) The contribution of growth hormone to mammary neoplasia. J. Mammary Gland Biol. Neoplasia 13, 131–145 [DOI] [PMC free article] [PubMed] [Google Scholar]
- 36. Mertani H. C., Zhu T., Goh E. L., Lee K. O., Morel G., Lobie P. E. (2001) Autocrine human growth hormone (hGH) regulation of human mammary carcinoma cell gene expression: identification of CHOP as a mediator of hGH-stimulated human mammary carcinoma cell survival. J. Biol. Chem. 276, 21464–21475 [DOI] [PubMed] [Google Scholar]
- 37. Raccurt M., Lobie P. E., Moudilou E., Garcia-Caballero T., Frappart L., Morel G., Mertani H. C. (2002) High stromal and epithelial human gh gene expression is associated with proliferative disorders of the mammary gland. J. Endocrinol. 175, 307–318 [DOI] [PubMed] [Google Scholar]
- 38. Rijnkels M., Kabotyanski E., Montazer-Torbati M. B., Hue Beauvais C., Vassetzky Y., Rosen J. M., Devinoy E. (2010) The epigenetic landscape of mammary gland development and functional differentiation. J. Mammary Gland Biol. Neoplasia 15, 85–100 [DOI] [PMC free article] [PubMed] [Google Scholar]
- 39. Chhabra Y., Waters M. J., Brooks A. J. (2011) Role of the growth hormone-IGF-1 axis in cancer. Expert Rev. Endocrinol. Metab. 6, 71–84 [DOI] [PubMed] [Google Scholar]
- 40. Shafiei F., Rahnama F., Pawella L., Mitchell M. D., Gluckman P. D., Lobie P. E. (2008) DNMT3A and DNMT3B mediate autocrine hGH repression of plakoglobin gene transcription and consequent phenotypic conversion of mammary carcinoma cells. Oncogene 27, 2602–2612 [DOI] [PubMed] [Google Scholar]
- 41. Perry J. K., Liu D. X., Wu Z. S., Zhu T., Lobie P. E. (2013) Growth hormone and cancer: an update on progress. Curr. Opin. Endocrinol. Diabetes Obes. 20, 307–313 [DOI] [PubMed] [Google Scholar]
- 42. Ding J., Huang S., Wu S., Zhao Y., Liang L., Yan M., Ge C., Yao J., Chen T., Wan D., Wang H., Gu J., Yao M., Li J., Tu H., He X. (2010) Gain of miR-151 on chromosome 8q24.3 facilitates tumour cell migration and spreading through downregulating RhoGDIA. Nat. Cell Biol. 12, 390–399 [DOI] [PubMed] [Google Scholar]
- 43. Krell J., Frampton A. E., Jacob J., Pellegrino L., Roca-Alonso L., Zeloof D., Alifrangis C., Lewis J. S., Jiao L. R., Stebbing J., Castellano L. (2012) The clinico-pathologic role of microRNAs miR-9 and miR-151–5p in breast cancer metastasis. Mol. Diagn. Ther. 16, 167–172 [DOI] [PubMed] [Google Scholar]
- 44. Cascio S., D'Andrea A., Ferla R., Surmacz E., Gulotta E., Amodeo V., Bazan V., Gebbia N., Russo A. (2010) miR-20b modulates VEGF expression by targeting HIF-1 α and STAT3 in MCF-7 breast cancer cells. J. Cell. Physiol. 224, 242–249 [DOI] [PubMed] [Google Scholar]
- 45. Liang L., Li X., Zhang X., Lv Z., He G., Zhao W., Ren X., Li Y., Bian X., Liao W., Liu W., Yang G., Ding Y. (2013) MicroRNA-137, an HMGA1 target, suppresses colorectal cancer cell invasion and metastasis in mice by directly targeting FMNL2. Gastroenterology 144, 624–635.e4 [DOI] [PubMed] [Google Scholar]
- 46. Huynh C., Segura M. F., Gaziel-Sovran A., Menendez S., Darvishian F., Chiriboga L., Levin B., Meruelo D., Osman I., Zavadil J., Marcusson E. G., Hernando E. (2011) Efficient in vivo microRNA targeting of liver metastasis. Oncogene 30, 1481–1488 [DOI] [PubMed] [Google Scholar]
- 47. Segura M. F., Hanniford D., Menendez S., Reavie L., Zou X., Alvarez-Diaz S., Zakrzewski J., Blochin E., Rose A., Bogunovic D., Polsky D., Wei J., Lee P., Belitskaya-Levy I., Bhardwaj N., Osman I., Hernando E. (2009) Aberrant miR-182 expression promotes melanoma metastasis by repressing FOXO3 and microphthalmia-associated transcription factor. Proc. Natl. Acad. Sci. U.S.A. 106, 1814–1819 [DOI] [PMC free article] [PubMed] [Google Scholar]
- 48. Hirata H., Ueno K., Shahryari V., Deng G., Tanaka Y., Tabatabai Z. L., Hinoda Y., Dahiya R. (2013) MicroRNA-182–5p promotes cell invasion and proliferation by down regulating FOXF2, RECK and MTSS1 genes in human prostate cancer. PLoS One 8, e55502. [DOI] [PMC free article] [PubMed] [Google Scholar]
- 49. Hannafon B. N., Sebastiani P., de las Morenas A., Lu J., Rosenberg C. L. (2011) Expression of microRNA and their gene targets are dysregulated in preinvasive breast cancer. Breast Cancer Res. 13, R24. [DOI] [PMC free article] [PubMed] [Google Scholar]
- 50. Silverstein R. A., Ekwall K. (2005) Sin3: a flexible regulator of global gene expression and genome stability. Curr. Genet. 47, 1–17 [DOI] [PubMed] [Google Scholar]
- 51. Hurst D. R., Welch D. R. (2011) Unraveling the enigmatic complexities of BRMS1-mediated metastasis suppression. FEBS Lett. 585, 3185–3190 [DOI] [PMC free article] [PubMed] [Google Scholar]
- 52. Tang J. Z., Kong X. J., Banerjee A., Muniraj N., Pandey V., Steiner M., Perry J. K., Zhu T., Liu D. X., Lobie P. E. (2010) STAT3α is oncogenic for endometrial carcinoma cells and mediates the oncogenic effects of autocrine human growth hormone. Endocrinology 151, 4133–4145 [DOI] [PubMed] [Google Scholar]
- 53. Hosui A., Kimura A., Yamaji D., Zhu B. M., Na R., Hennighausen L. (2009) Loss of STAT5 causes liver fibrosis and cancer development through increased TGF-β and STAT3 activation. J. Exp. Med. 206, 819–831 [DOI] [PMC free article] [PubMed] [Google Scholar]
- 54. Oberley C. C., Bilger A., Drinkwater N. R. (2014) Genetic background determines if Stat5b suppresses or enhances murine hepatocarcinogenesis. Mol. Carcinog. 10.1002/mc.22165 [DOI] [PMC free article] [PubMed] [Google Scholar]
- 55. Zhang L., Zhao Z., Feng Z., Yin N., Lu G., Shan B. (2012) RNA interference-mediated silencing of Stat5 induces apoptosis and growth suppression of hepatocellular carcinoma cells. Neoplasma 59, 302–309 [DOI] [PubMed] [Google Scholar]
- 56. Barash I. (2006) Stat5 in the mammary gland: controlling normal development and cancer. J. Cell. Physiol. 209, 305–313 [DOI] [PubMed] [Google Scholar]