

Abstract
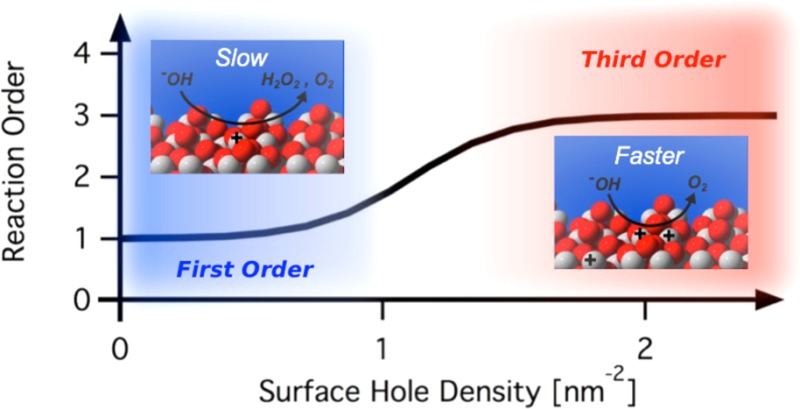
Water oxidation is a key chemical reaction, central to both biological photosynthesis and artificial solar fuel synthesis strategies. Despite recent progress on the structure of the natural catalytic site, and on inorganic catalyst function, determining the mechanistic details of this multiredox reaction remains a significant challenge. We report herein a rate law analysis of the order of water oxidation as a function of surface hole density on a hematite photoanode employing photoinduced absorption spectroscopy. Our study reveals a transition from a slow, first order reaction at low accumulated hole density to a faster, third order mechanism once the surface hole density is sufficient to enable the oxidation of nearest neighbor metal atoms. This study thus provides direct evidence for the multihole catalysis of water oxidation by hematite, and demonstrates the hole accumulation level required to achieve this, leading to key insights both for reaction mechanism and strategies to enhance function.
Introduction
One of the great challenges in chemistry, and particularly electrochemistry, is the catalysis of multielectron or multihole reactions. The mechanism of such reactions is generally ambiguous, particularly whether the reaction consists of a succession of independent oxidation/reduction steps or a concerted mechanism. Additionally, the question of whether it requires the accumulation of charges carriers on a single site or on multiple adjacent sites is not fully answered. The water oxidation reaction (or oxygen evolution reaction, OER) is often regarded as the exemplary multielectron reaction, being a key reaction in plant photosynthesis and central to developing strategies for renewable fuel synthesis from water.1,2 In photosynthesis, this reaction is driven by a manganese cluster within the photosystem II (PS II) reaction center, which accumulates four oxidizing equivalents in order to oxidize two water molecules to molecular oxygen.3−5 Similarly, synthetic water oxidation catalysts have been mostly based on multimetal centers or surfaces to enable this reaction.6−8 Interest in solar driven fuel synthesis is motivating extensive studies of photocatalyst materials capable of oxidizing water under solar irradiation, including in particular metal oxides due to their stability under oxidizing conditions.9,10 However, while such “photocatalysts” can harness solar irradiation to drive the water oxidation reaction, it is generally unclear if the surfaces of such oxide materials are catalytic for this reaction, in the sense of enabling concerted multielectron/hole chemistry and/or stabilizing reaction intermediates. In this study, we present the first rate law analysis of photoinduced water oxidation on a metal oxide semiconductor surface by photoinduced absorption spectroscopy (PIA). We demonstrate that at sufficiently high surface hole densities (> ∼1 hole/nm2), hematite photoanodes become capable of driving water oxidation with third order dependence on hole density, indicative of a reaction mechanism requiring the accumulation of three holes or oxidized equivalents to reach the rate-determining reaction step.
While rate law analyses of water oxidation have been limited to date, there is extensive evidence that efficient water oxidation catalysis requires the accumulation of multiple holes or “oxidizing equivalents”. The oxygen-evolving catalytic site in plants, located within the Photosystem II reaction center, comprises primarily a Mn4Ca based center5,11 capable of accumulating four oxidizing equivalents to oxidize water with turnover rates of up to 1000 s–1.4 The formation of higher oxidation states has also been reported to be important for inorganic water oxidation catalysts, including for example manganese and cobalt oxides.12,13 Previous optoelectronic studies on hematite photoanodes have also related an absorption signal at 580 nm to the oxidation of low valent iron–hydroxyl surface species to surface bound iron species with higher valence states on hematite photoanodes (such as Fe=O).14−16 Intermediate states in the water oxidation process have also been reported on other oxides surfaces such as TiO2.17−19 In most models of water oxidation in such systems, the rate-determining step is thought to involve oxygen–oxygen bond formation, requiring multiple oxidations at a single site. These studies thus highlight the potentially critical role of positive charge accumulation for water oxidation, and have identified some of the intermediate states involved on some surfaces, but have not quantified how many holes (or “oxidizing equivalents”) are required to reach the rate-determining step. Determining how many holes are required to reach the rate-determining step is of interest both in terms of the mechanism of reaction, and in terms of the extent of hole accumulation required on the oxide surface to drive efficient water oxidation.
There have been extensive studies of inorganic photocatalysts for solar driven water splitting, motivated by the pioneering study of titania by Fujishima and Honda.20 Research has particularly focused on earth-abundant transition metal oxides, due to their stability, low cost and large accessibility. Attention is now focused on visible light absorbing oxides, including in particular hematite, or α-Fe2O3.21 The time scale of water oxidation on such metal oxide semiconductors has been characterized as rather slow, with rate constants for hole transfer to water in the range of 0.1–10 s–1.22−27 In order for such systems to attain high photocurrent densities, substantial accumulation of holes is therefore required at the interface with water.28 Significant progress has been made in characterizing the competing recombination processes that can limit this hole accumulation, employing both frequency-modulated measurements and time-resolved techniques.29−32 Such studies have focused in particular on the importance of the space charge layer formed at the photoanode surface both in spatially separating the photogenerated electrons and holes, and in preventing recombination of surface accumulated holes with bulk electrons (“back electron/hole recombination”).29,32 Studies using potential and light-modulated absorption spectroscopy have related a broad optical feature, peaking around 600 nm, to the formation of high valence iron species on the surface, such as Fe(IV) or Fe(V), with >0.1s lifetime, assuming these states to be involved in both surface recombination and OER.14,15 A sharper but similar absorption signal detected by spectroelectrochemistry was also observed under water oxidation conditions and related to the same species and to the accumulated surface charge measured by impedance spectroscopy and cyclic voltammetry.16 Because of the deep valence bands of such oxides, valence band holes exhibit oxidation energies close to that required to drive the thermodynamically challenging one hole oxidation of water. Indeed, our studies employing transient absorption spectroscopy as a function of excitation density and temperature have both been supportive of such an outer sphere oxidation of water by individual valence band hematite holes, without the need for any multiply oxidized intermediate states, at least under the pulsed laser excitation conditions employed in these studies.22,33 Nevertheless, the reaction kinetics under steady state conditions, i.e., when a constant amount of holes is accumulated at the surface, remains elusive and the question of how the rate and mechanism of reaction depends upon the density of surface-accumulated holes has not been substantially addressed to date.
In this study, we present the first rate law analysis of photoinduced water oxidation on a phototoanode surface, demonstrating the possibility of multihole concerted reactions on an earth abundant metal oxide semiconductor surface, namely hematite. The approach described in this article is complementary to studies of reaction intermediates as we focus specifically on how the reaction rate depends quantitatively on accumulation of photogenerated holes on the oxide surface. The methods used are photoinduced absorption (PIA) spectroscopy and step on/off photocurrent measurements, which provide a simultaneous comparison between the density of accumulated photogenerated holes and the flux of charges across the interface. An unexpected reaction order of three with respect to accumulated surface hole density is obtained under high hole accumulation conditions.
Experimental Section
Preparation of the Hematite Sample
Nanostructured iron oxide samples were prepared by atmospheric pressure chemical vapor deposition (APCVD), according to the method developed by Kay et al.34 The samples investigated in this study are dendritic with 5–10 nm feature size on the top of the nanostructures. The hematite layer is approximately 400 nm thick, doped with silicon (1.5% dopant concentration), and include a SiO2 buffer layer at the interface with the conductive substrate (FTO TEC15). The role of this underlayer has been discussed previously.35
Photoelectrochemical Setup
All measurements have been performed in a 3-electrode cell. The cell was filled with 10 mL of 1 M NaOH electrolyte solution (pH 13.6) and platinum gauze was used as a counter electrode. The sample was irradiated at the electrolyte/semiconductor interface and the illuminated area was determined to be 0.5026 cm2. Potentials were applied against a silver/silver chloride reference electrode, with saturated KCl solution (E = +0.197 V vs NHE). Potentials are converted to potentials against the reversible hydrogen potential (VRHE), according to the Nernst equation. Potentials were applied between the sample and the reference electrode using a ministat from Sycopel Scientific Ltd.
Illumination was provided by one or two LEDs (LZ1–10U600, LedEngin Inc.), emitting at 365 nm. The light intensity was controlled by applying a fixed current (from 0.1 to 0.7 A) and adapting the voltage source to minimize stabilization time. The light intensity was measured by a Si photodiode (FDS100-CAL from Thorlabs), placed at the same position as the sample.
Optoelectronic Setup
Photoinduced absorption (PIA) and transient photocurrent (TPC) were measured simultaneously for a 10 s period, with light pulses produced with the UV Led (5 s on/5 s off). For PIA measurements, the probe light source was a tungsten lamp (Bentham IL1 tungsten lamp), and the probe wavelength (650 nm) was selected using a monochromator placed prior to the sample. Several long pass and band-pass filters (Comar Instruments) were used to attenuate the pump (LED) light arriving at the detector. Transmitted photons were collected with a Si photodiode (Hamamatsu S3071). The bare detector signal was recorded with a National Instruments (NI USB-6211) DAQ card (without amplification), and corresponds to the average of 20 to 50 LED pump pulses. Electronic charges, generated by a pulse from a blue LED (5 s on/off) can absorb a continuous probe light (650 nm in our case), detected as a decrease in transmittance of the probe through the sample, converted to a positive change in absorbance (optical density or O.D.). Most metal oxide semiconductors, such as Fe2O3, TiO2, WO3 or BiVO4 exhibit a strong absorption signal at wavelengths below band gap excitation, which has been assigned to photogenerated charges.22,25,26,33 Hence, a positive change in absorbance between during and before the pulse is directly proportional to the number of photogenerated species. From previous time-resolved absorption studies, the signal on the second time scale has been assigned to photogenerated holes accumulated at the photoanode surface (see Results section).
Photocurrents were recorded by measuring the change in potential across a 98.2 ohm resistor, set in series between the counter electrode and the potentiostat. The value of the resistance was selected to match the typical series resistance of the cell. The signal was sent to an oscilloscope (Tektronics TDS 2012c), and converted to photocurrent density, according to Ohm’s law.
Light pulses were generated via a MOSFET (STF8NM50N from STMicroelectronics), with a frequency generator (TG300 from Thurlby Thandar Instruments) controlling the gate, and the LED power supply (QL564P from TTi) connected at the drain and the source. The frequency generator was setup to generate a 5 V square wave with a frequency of 0.09 Hz. A second signal from the frequency generator was used to trigger both the oscilloscope and the DAQ card. The oscilloscope and the DAQ card were controlled by a homemade Labview program and data were processed using Igor Pro software.
Experimental methods are further detailed in the Supporting Information.
Results
Figure 1 shows the current–voltage characteristic of the hematite photoanode under monochromatic illumination (365 nm) as a function of illumination intensity. The photocurrent onsets at an applied potential of 1.0 VRHE and reaches a plateau at 1.3–1.4 VRHE. The photoanode performance shown here is in agreement with previous reports using the same type of electrode.21,34 Dark current is not shown in Figure 1 but is negligible at bias potentials below 1.7 VRHE and can be found in previous reports using APCVD hematite photoanodes.21,34,36,37
Figure 1.
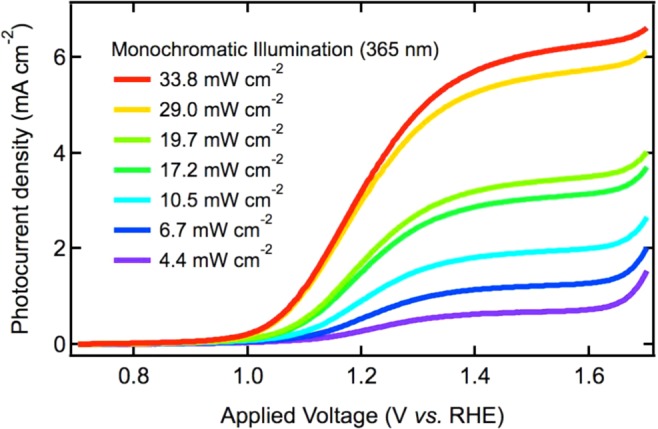
Current–voltage characterization of the hematite photoanode under monochromatic illumination (365 nm) at different light intensities, ranging from 4.4 to 33.8 mW cm–2 measured at the sample position (see legend).
One method to monitor the photogenerated holes produced by optical excitation of a hematite photoanode is to detect the change in light transmission of the sample. Previous transient absorption studies have assigned a broad positive optical signal, observed from 600 nm to the near-infrared, to light absorption by photogenerated holes.14,33,38 Other studies assigned the optical signal, peaking at 570–600 nm, acquired by spectro-electrochemistry or potential/light modulated absorption spectroscopy, to higher valence iron atoms (Fe oxidation state >3) or to Fe=O species on the surface (holes localized on iron atoms).14−16 The assignment of our long-lived optical signal to photogenerated holes on the surface is supported by previous optical spectroscopy studies, wherein the signal intensity decreased in the presence of hole scavengers, and correlated with photocurrent densities.32,33 Thus, the assignment of the optical signal at >600 nm to photogenerated surface holes is assumed hereafter.
To quantify the accumulation of photogenerated holes during water photolysis, and its correlation with the water oxidation photocurrent, we have used a 5 s on/off light pulse from a 365 nm LED while holding the photoanode at 1.5 VRHE in a three-electrode setup. This applied potential was selected as it is sufficiently anodic to turn off back electron/hole recombination, implying that the only extraction pathway for holes accumulating at the photoanode surface is transfer to the electrolyte.29,32 Similar PIA data were obtained at lower bias potential but their analysis was complicated by the competitive recombination process. In addition, by recording the optical hole signal on the seconds time scale, we only observe accumulated “long-lived” holes and avoid signals from bulk holes, which decay on faster time scales.24,39,40 The resulting PIA signal, probed at 650 nm (corresponding to the peak of hematite hole absorption), and the photocurrent densities extracted simultaneously from the photoanode are shown in Figure 2a,b, respectively.
Figure 2.
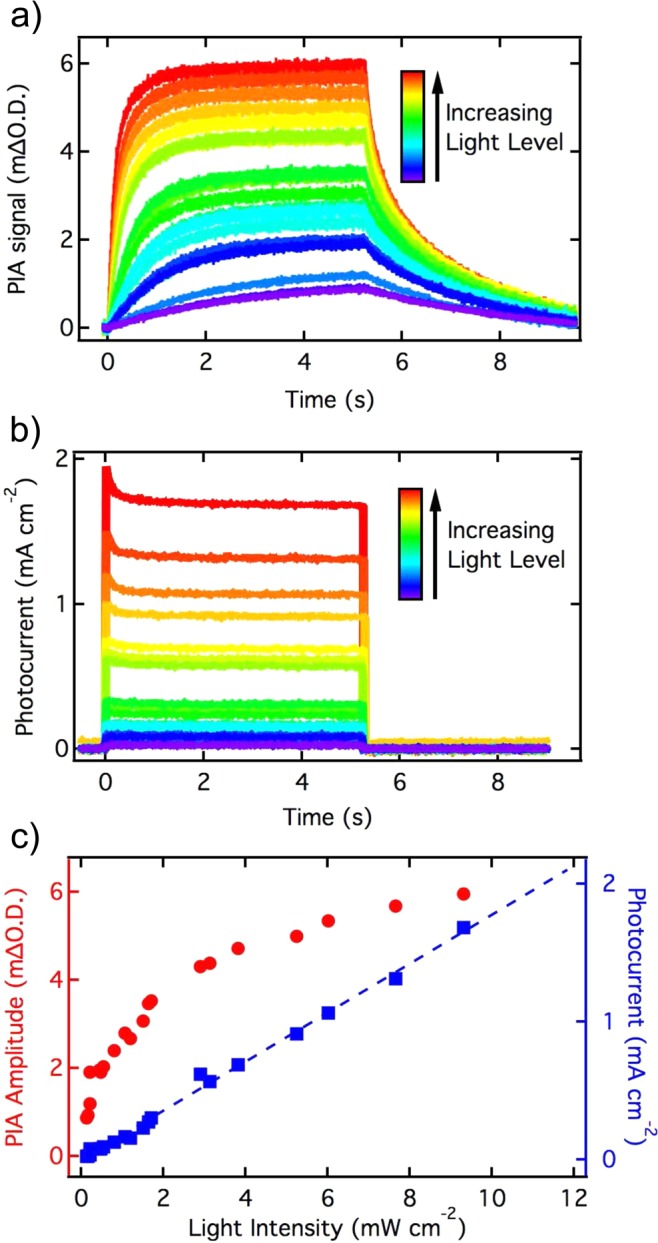
Time resolved PIA and photocurrent of a hematite photoanode during 5 s pulsed illumination at 365 nm under water oxidation conditions. The photoinduced absorption recorded at 650 nm (a) and the photocurrent density (b) were measured simultaneously, with the sample being held at 1.5 VRHE in 1 M NaOH electrolyte. (c) Steady state PIA and photocurrent densities, measured at 5 s after light-on, are shown against the light pulse intensity. The light intensities obtained from the blue LED and measured at the sample position, ranged from 0.1 to 9.3 mW cm–2.
The spectrum of the PIA signal (steady state value measured at 5 s after light-on), shown in Supporting Information (Figure S2), exhibits the same shape as that observed at long (millisecond to second) time scales in transient absorption studies under pulsed laser excitation, and previously assigned to the photogenerated hole absorption.24 Additionally PIA spectra, in the 580–950 nm range, obtained at different PIA amplitudes (corresponding to different densities of accumulated holes) are shown in Figure 3. PIA spectra, obtained during the PIA decay after light is switched off (Figure 3a) and normalized spectra obtained at different excitation intensities (Figure 3b) exhibit the same spectral shape, similar to the one recorded at relatively high excitation intensity (Figure S2 in SI). All spectra and normalized spectra are shown in Figure S3 (SI). This suggests that the same species is probed at all PIA LED intensities, namely valence band holes, with no evidence for spectral signals of different accumulated species at different light intensities. This conclusion is consistent with such long time scale PIA experiments only observing long-lived species accumulating in the electrode under continuous irradiation; shorter lived photogenerated species such as hematite electrons or higher oxidation state intermediates involved in the water oxidation process are unlikely to be observed.
Figure 3.
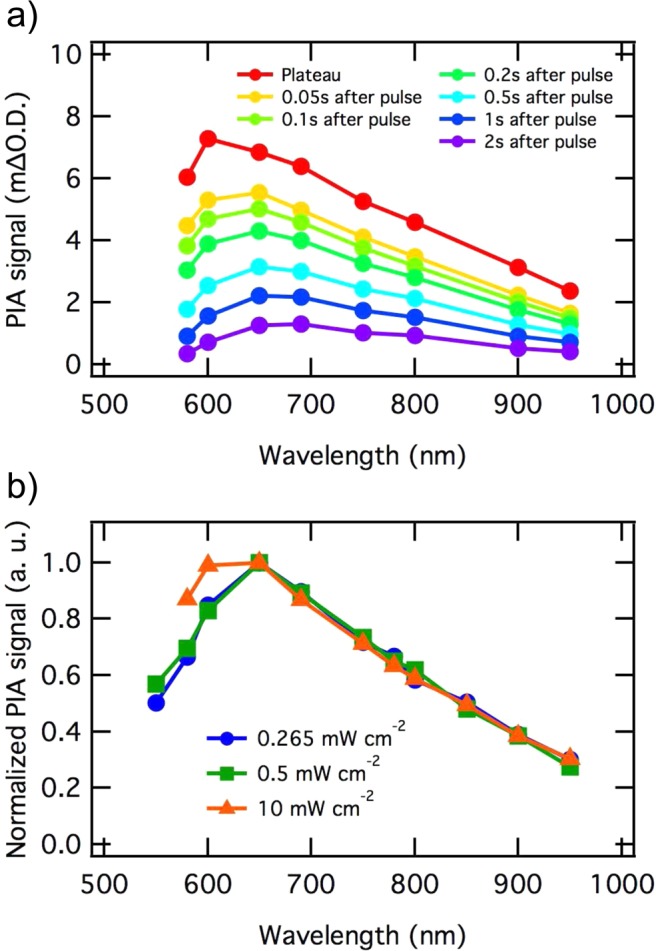
(a) Photoinduced absorption spectra of the hematite photoanode held at 1.5 VRHE in 1 M NaOH, measured on the equilibrium plateau attained during illumination and during the PIA decay after LED is switched off. (b) Normalized PIA spectra measured on the equilibrium plateau under three different LED intensities.
The photocurrent increases and decreases rapidly after the LED is turned on and off (0 s and approximately 5 s respectively, Figure 2b). We note that the rise and fall of the current will be determined by the time scale of electron transport through the hematite photoanode to the external circuit, with the fast response time being consistent with millisecond transport times typically reported for such photoanode materials.33 The rise and decay time constants related to the photocurrent appear to be independent of the light intensity used (the initial peak and decay of the photocurrent may be associated with a reduction in charge separation efficiency induced by hole accumulation, or potentially an experimental artifact; in either case this feature is not considered further herein). In contrast to the photocurrent transients, the PIA absorption signal both rises and decays slowly following the switching on and off of the LED, with the rise and decay time constants accelerating as the pulse light intensity is increased (Figure 2a). The slower PIA kinetics compared to the photocurrent kinetics is explained by the longer time required for the accumulation, and decay, of holes at the photoanode surface.
In this study, we are concerned not so much with the kinetics of hole accumulation at the hematite surface, but rather the rate with which these accumulated holes oxidize water. In this regard, a key observation from the data in Figure 2a,b is the different behavior of the “steady state” (i.e., after 5 s irradiation) values of the PIA and the photocurrent as a function of light intensity, as shown in Figure 2c. The photocurrent appears to increase linearly with light intensity over the full range tested experimentally, with a slope of 0.177 mA mW–1. This corresponds to a quantum efficiency of 60% at a wavelength of 365 nm, consistent with the incident photon to current efficiencies (IPCE) measured at the same applied potential under similar illumination (see Supporting Information Figure S4). In striking contrast to this linear photocurrent behavior, the PIA signal amplitude is clearly sublinear with the illumination intensity. If we take this PIA signal as a direct assay of valence band hole density (see below for further consideration of this point), it is apparent that, at high light intensities, the accumulated hole density increases more slowly than the photocurrent density.
In order to elucidate further this nonlinear relationship between surface hole density and photocurrent density, we plot in Figure 4 the steady state photocurrent against steady state PIA signal (measured at 5s, before the LED is switched off). Furthermore, to provide a more physical insight, the PIA signal amplitude has been converted into a density of accumulated holes (bottom axis in Figure 4). This was achieved by measuring PIA and photocurrent density data at 0.9 VRHE, a potential below the onset of the photocurrent where essentially all holes transferred to the photoanode surface undergo back recombination with bulk electrons, allowing the optical signal amplitude to be related directly to a current transient, as detailed in Supporting Information, Figure S5. Calibration was calculated between 0 and 0.9 mΔO.D., because of the low charge accumulation measured at 0.9 VRHE, potentially due to low band bending at this potential, and was extrapolated to values up to 6 mΔO.D. (Figure 2c). This calibration of the PIA signal resulted in a conversion factor of 4.5 × 10¹³ holes cm–2 mΔO.D.–1, which corresponds to a molar extinction coefficient of 640 M–1 cm–1 for the surface-accumulated photogenerated holes. This value is consistent with the molar extinction coefficient measured by Cummings et al. and Klahr et al. for high valence iron atoms and Fe=O species, respectively.14,16 From this calibration, and accounting for the surface roughness of 21 for the photoanodes employed,34 it is apparent that the PIA transients observed under water oxidation conditions (at 1.5 VRHE) correspond, for the range of light intensities employed, to surface hole densities in the range 0.1 to 10 holes nm–2.
Figure 4.
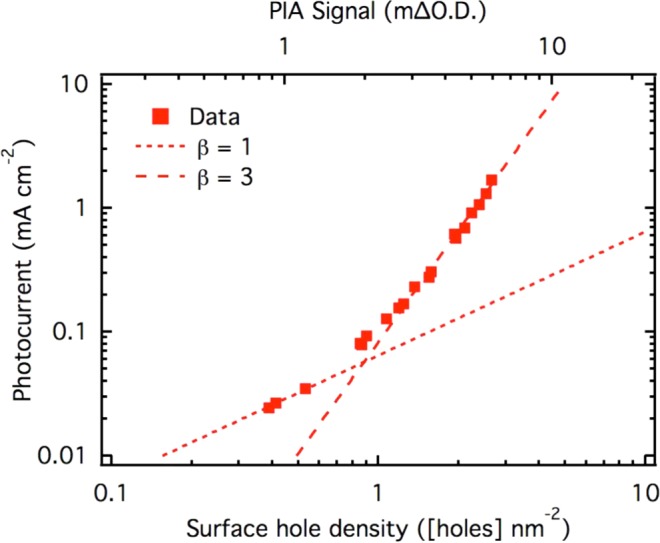
Relationship between photocurrent and density of accumulated surface holes. The steady state photocurrent is shown against the steady state PIA amplitude (top x-axis), measured simultaneously during a 5 s light on/off step experiment. The hematite sample was kept at 1.5 VRHE in 1 M NaOH. The PIA signal was converted to a density of accumulated holes from transient photocurrent recorded in a light step experiment at 0.9 VRHE (see Figure S4 in Supporting Information).
The plot of photocurrent versus surface hole density shown in Figure 4 exhibits two distinct regions, one at low density of accumulated surface holes (corresponding to low light intensities) and one at high density. Simple linear fits to this plot in the limits of low and high hole density yield gradients of 1.1 ± 0.1 and 3.2 ± 0.1. The first fitted region is only based on three points due to the technical limitations engendered by such low light intensities (noisy transient currents especially). It is, however, consistent with our observation of first order behavior from transient absorption studies, which observed the rate constant for water oxidation to be independent of hole density for a range of relatively low hole densities (hole absorption signals in range 0.05–0.35 mΔO.D.).33 This transition from first to third order behavior is also supported by further data presented below.
We now consider a simple kinetic model to describe our results. We will then go on to further data and rate law analyses of water oxidation employing this model. Under the anodic bias conditions used herein (1.5 VRHE), the model others and we have employed to describe interfacial charge carriers’ dynamics can be simplified by neglecting hole consumption from back electron recombination.23,30,32 This model is depicted graphically in Figure 5. We consider a surface density of accumulated holes, ps, which is defined by eq 1:
| 1 |
where Jholes is the flux of photogenerated holes toward the surface during illumination, kWO the water oxidation rate constant and β the reaction order with respect to accumulated holes. The model assumes a faradaic efficiency of unity for water oxidation by hematite holes transferred to the electrolyte. At high current densities, this hole transfer has been shown to result in oxygen evolution; we note that at lower current densities alternative oxidation products, such as hydrogen peroxide, may also be important. This equation can be simplified when considering steady state (approximated to 5 s after illumination in our study above). Under these conditions, the density of holes is not changing with time and the photocurrent equals the flux of holes toward the surface, as detailed in eq 2.
| 2 |
Consequently, the two regions observed in Figure 4 correspond to two different reaction orders as observed by the slope on a log–log plot, with data fitting giving reaction orders of 1.1 and 3.2 at low and high surface hole densities, respectively. For clarity a dotted line, representing a reaction order of 1 in holes, and a broken line representing a third order reaction in holes, have been superimposed on the data in Figure 4. The kWO values obtained from the fittings are 4 s–1 for the first region (β fixed at 1) and 5.2 s–1 holes –2 nm4 for the second region (β fixed at 3). Our analysis above of the rate law for water oxidation has been based on our plot, in Figure 2, of the accumulated PIA valence band hole signal versus photocurrent density. From this analysis we observe a transition from first to third order as the hole density is increased.
Figure 5.
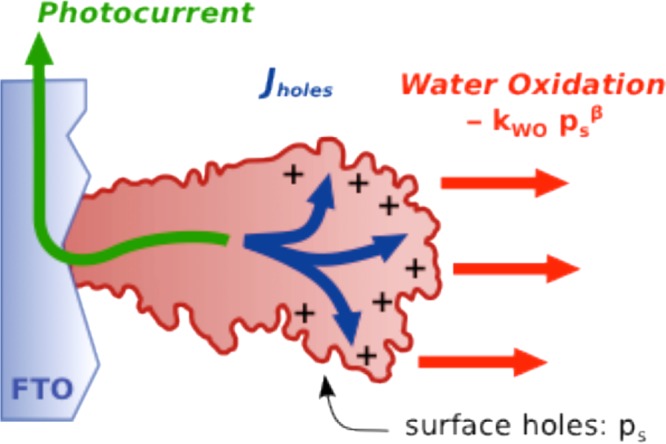
Sketch representing the kinetic model developed to determine the water oxidation reaction order on photogenerated holes.
We turn now to consider further evidence for such a transition in reaction order. Our simple kinetic model described above indicates that the water oxidation reaction order can also be obtained from the decay of the PIA signal after the light has been switched off. Under these conditions, eq 1 can be simplified to eq 3 as the diffusion of photogenerated holes is null in the absence of light.
| 3 |
Two different methods have been used to extract the reaction order from the decay, as illustrated in Figure 6. First, the initial decays of the derivative of the PIA signal against PIA signal amplitude, recorded instantly after the light is switched off at several light intensities, have been fitted to a power law function (linear on log–log plot, Figure 6a), in accordance with eq 3. The same equation was also used to obtain the reaction order by following the decay slope of a differentiated PIA decay, obtained at one light intensity during the PIA recovery to the prepulse level (6.02 mW cm–2, Figure 6b). The details of both analyses, which each yielded the effective reaction order as a function of hole density ps, are shown in Supporting Information (Figure S6). These data are overlaid in Figure 7 with the reaction orders obtained from Figure 4 and from previous transient absorption spectroscopy studies.33 It is apparent that all of these experimental approaches are in agreement, showing a transition from approximately first order to third order behavior as the accumulated surface hole density is increased from <1 to >2 holes nm–2. In particular, we observe a transition between first and third order behavior from both studies of hole accumulation versus photocurrent density under increasing continuous irradiation and from analyses of hole decay dynamics once the light (and photocurrent) have been turned off. This agreement between different analyses, each of which has different assumptions and approximations, provides strong support for the validity of our analysis. For example, from our analysis of PIA versus photocurrent alone it is difficult to rule out that the increasing saturation of PIA signal at high light intensities may derive from the accumulation of nonabsorbing hematite holes (i.e., a change in average hole extinction coefficient with hole density). However, the presence of such nonabsorbing holes at high light intensities would not result in a transition from third to first order decay dynamics after the light is turned off (if anything, the presence of such states would result in a retardation of the initial decay at high hole densities, the opposite of our experimental observation). This allows us to conclude that such nonabsorbing species are not a significant concern for the study reported herein.
Figure 6.
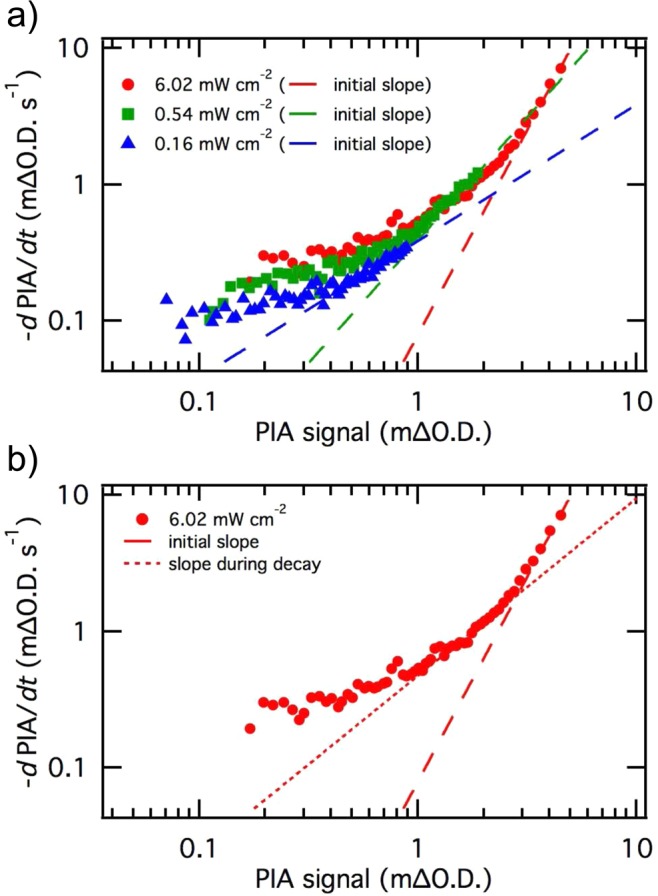
(a) Initial slope of the derivative of the PIA signal against the PIA signal amplitude, shown at three different light intensities. (b) Initial slope and slope of the derivative of the PIA signal during the PIA decay after light is switched off, shown for one light intensity.
Figure 7.
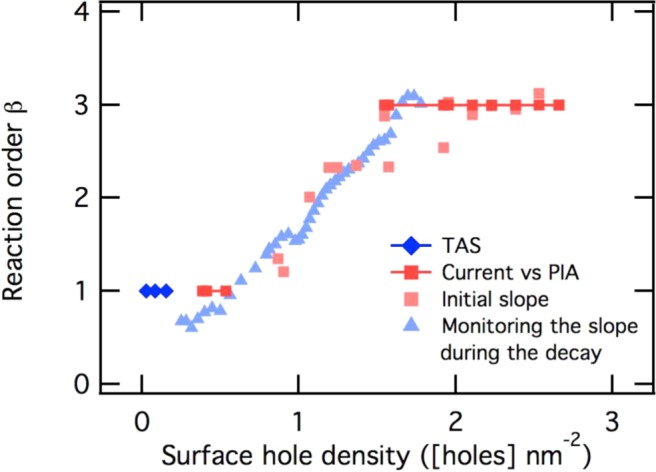
Change in reaction order with increased surface hole density. The reaction order determined by different techniques (see legend) is shown against the surface hole density accumulated during water oxidation.
Discussion
We have found that three different analyses based on measurement of the photoinduced absorption signal assigned to hematite holes under stepped light irradiation all indicate that the rate of water oxidation is first order in photogenerated holes at low accumulated hole densities, and third order and high accumulated hole densities. The first order kinetics measured in this study at low light intensities is consistent with previous reports using short (∼6 ns) laser excitation to measure charge carriers’ lifetime and OER thermal activation.22,24,33 This behavior has been rationalized with water oxidation proceeding via single-hole oxidation steps. However, this is the first report, to the best of our knowledge, of the observation of a third order rate law in hole density for the OER under high hole accumulation on hematite, or indeed on any oxide surface. This order is striking given that water oxidation requires the transfer of four holes for the generation of one molecule of oxygen, while our data clearly indicate a third rather than fourth order dependence on hole density. It is possible that such a nonunity rate law may result from either the energetics or mobility of surface holes being dependent upon surface hole density, and at present it is impossible to rule out such dependencies. (We note that hole mobility is most likely to limit the oxygen evolution process at low accumulated hole density, as suggested by Cummings et al.;14 the third order behavior reported herein is only observed at high hole densities, where hole mobility is unlikely to be a critical consideration). However, it is certainly interesting to consider whether this third order behavior under high hole accumulation results in a reaction mechanism where the rate-determining step requires the three-hole oxidation of a reaction intermediate.
Previous estimates on the surface density of iron atoms on hematite surfaces have yielded values ranging from 4–12 atoms nm–2.41,42 We consider an average of ∼8 atoms nm–2 for the nanocrystalline films studied herein. Our data therefore suggest that the third order regime is attained when there is an average of circa one hole per four surface iron atoms. From the crystallographic structure of hematite,43 each iron surface atom has between three and four closest neighboring metal atoms. This indicates that the transition from first to third order for the OER occurs when each oxidized Fe atoms has on average one nearest neighbor also oxidized. This significant result suggests that the diffusion length of holes on the surface may be relatively unimportant, with multihole water oxidation becoming possible when nearest neighbor iron atoms are oxidized.
Several mechanistic studies of water oxidation on oxide surfaces provide indirect support for a third order rate law. Previous studies regarding the OER mechanism and its intermediates on precious metals and on metal oxide surfaces have considered the formation of an M-OOH species (M = metal) being the key step in the reaction mechanism.18,44 Elizarova et al. also considered the formation of a bridging peroxo species between two metal atoms but assumed that the disappearance of this intermediate did not lead to the formation of an O2 molecule. However, both the formation of superoxide (M–O–O–M) and metal-oxy-hydroxide (M-OOH) have been observed on TiO2 and Co3O4 nanoparticles by time-resolved infrared spectroscopy, with the mechanism involving the superoxide species being detected as the faster one.45,46 Kay et al. considered that the OER reaction occurred on a single metal atom (Co-OOH) but with contribution of a second cobalt atom on a hematite photoanode modified with Co(NO3)2.34 Finally, time-resolved and frequency modulated spectroscopic studies have evidenced the formation of high valent Fe ions on the surface, potentially involving Fe=O species, to be required on a hematite surface for the OER to evolve.14,16 In all the mechanisms discussed, the rate-determining step involved is oxygen–oxygen bond formation, with this being proposed to require three oxidations.
On the basis of this literature, Figure 8 illustrates two plausible catalytic mechanisms for water oxidation on hematite under high hole accumulation conditions, consistent with the third order rate law in holes reported herein. The mechanism that is first order in holes is not further discussed as it only occurs at very low charge accumulation density and consequently at light intensities too low to be relevant for applications under solar irradiation. The transition between the first and third order mechanism occurs between 0.25 and 0.5 sun (1 and 2 holes nm–2 respectively), considering a constant IPCE of 60% (IPCE of hematite is decreasing with increasing wavelength in reality) and a band gap of 2.1 eV. Mechanism A involves the coupling of two adjacent high-valent iron-oxo species on the surface,1 which may involve the transient formation of an Fe(V)-oxo. Mechanism B proceeds via a nucleophilic attack of a hydroxide anion on a bridging surface oxygen, resulting in peroxide formation, which is similar to a mechanism proposed in a theoretical study.47 We note that analogous discussions are ongoing for the mechanism of water oxidation by the OEC of Photosystem II.4 For either mechanism, our data suggest that the initial oxidation of two neighboring surface irons is relatively facile, with the rate-determining step being the third oxidation resulting in either formation of an Fe(V)-oxo (Mechanism A) or oxidation of the bridging oxygen (Mechanism B), and the resultant oxygen–oxygen bond formation. The mechanism discussed herein is drawn for highly basic conditions, where the hematite surface is predominantly deprotonated considering an isoelectric pH of 8.4–8.5. Because of the deep valence band of such metal oxide semiconductors, this mechanism is not expected to change at lower bias potential as long as a sufficient hole accumulation level is reached. We note however that the study herein is limited to strongly anodic bias conditions to avoid complications from the competitive process of back electron recombination occurring at lower applied potential.
Figure 8.
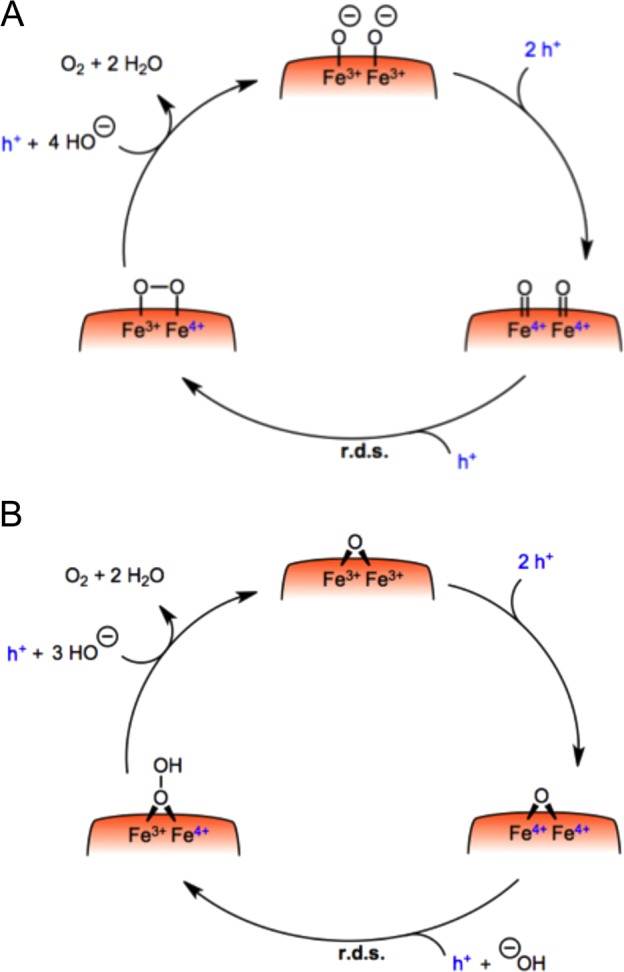
Plausible mechanisms for water oxidation catalysis on a hematite surface. In both cases, the mechanism involves the accumulation of three holes to reach the rate-determining step. In (A), the high alkaline conditions yield a surface where most of the surface hydroxyls have been deprotonated.
This study demonstrates the possibility of a concerted multihole OER on hematite surfaces. The photocurrent achieved at one sun and 1.5 VRHE with this type of sample is about 4 mA cm–2.21 These photocurrents correspond to an accumulated hole density of 3.9 holes nm–2, conditions under which the third order mechanism dominates. For the same hole concentration at the surface, extrapolation of the first order behavior in Figure 4 indicates that only 0.23 mA cm–2 photocurrent would be attained with the first order mechanism. In other words, the third order mechanism leads to an increase of ∼20 fold in the current compared to that which would be obtained from the first order reaction alone at the same surface hole density.
As discussed above, the transition from first to third order involves an acceleration of the reaction kinetics, resulting in an increase in the OER rate constant on the hematite surface. This is likely to be most noticeable in the JV characterization (Figure 1) at lower bias potentials than the one used in the study herein (1.5 VRHE), due to the kinetic competition between water oxidation and back electron/hole recombination being most important around the photocurrent onset.32 (In this study, a strong anodic bias was employed specifically to avoid complications to the data analysis arising from this kinetic competition). In particular, an increase in water oxidation rate constant at high hole densities, as observed herein, might be expected to result in a cathodic shift of the onset of the water oxidation photocurrent as the light intensity is increased. Such a shift in onset potential is indeed apparent in the current/voltage curves shown in Figure 1. However, a quantitative analysis of this point is beyond the scope of this study.
While the hematite surface is indeed catalyzing a multihole concerted reaction under one sun, its catalytic properties for the OER are moderate as the reaction rate is increased by only 1 order of magnitude with the change in mechanism. We are currently investigating other metal oxide semiconductors and catalytic overlayers, commonly used in water splitting devices, to compare their abilities to catalyze multielectron reactions.
Conclusion
The rate order of the water oxidation reaction has been investigated on hematite photoanodes by photoinduced absorption of accumulated holes and photocurrent densities recorded simultaneously. A transition from first order to third order in photogenerated holes has been identified when a sufficient density of holes is accumulated at the semiconductor-electrolyte interface to oxidize two nearest neighbor surface metal atoms. This transition was confirmed by agreement between three different analyses. The third order reaction is rationalized by considering the rate-limiting formation of an intermediate, which requires the incorporation of three holes. It is argued that this rate law is consistent with reaction mechanisms based on recent observations of intermediates involving oxygen–oxygen bond formation during the oxygen evolution reaction on other metal oxide surfaces.
This study clearly demonstrates the ability of a metal oxide semiconductor surface, such as hematite, to drive a multihole reaction, but also highlights the modest catalytic properties of this surface. Our findings will help to tailor the design of metal oxide anodes and photoanodes for water oxidation with regards to achieving high localized hole concentration, and the need for cocatalysts to enhance function. Further work is currently in progress with different materials and overlayers to determine their function and abilities to catalyze this complex but fascinating reaction.
Acknowledgments
F.L.F., E.P., S.R.P. and J.R.D. thank the European Research Council (project Intersolar 291482) for funding. F.L.F. thanks the Swiss National science Foundation (project: 140709). S.D.T. and M.G. thank the Swiss Federal Office for Energy (PECHouse Competence Center, contract number SI/500090–02) for financial support. E.P. thanks EPSRC for award of a DTP studentship.
Supporting Information Available
Detailed experimental parameters, PIA spectra recorded at several accumulated hole density, current–voltage and IPCE characteristics of the sample, calibration of the PIA signal and methods details used to extract the reaction order from the PIA decay. The Supporting Information is available free of charge on the ACS Publications website at DOI: 10.1021/jacs.5b02576.
The authors declare no competing financial interest.
Supplementary Material
References
- Lewis N. S.; Nocera D. G. Proc. Natl. Acad. Sci. U. S. A. 2006, 103, 15729–15735. [DOI] [PMC free article] [PubMed] [Google Scholar]
- Walter M. G.; Warren E. L.; McKone J. R.; Boettcher S. W.; Mi Q.; Santori E. A.; Lewis N. S. Chem. Rev. 2010, 110, 6446–6473. [DOI] [PubMed] [Google Scholar]
- Cox N.; Retegan M.; Neese F.; Pantazis D. A.; Boussac A.; Lubitz W. Science 2014, 345, 804–808. [DOI] [PubMed] [Google Scholar]
- Vinyard D. J.; Ananyev G. M.; Charles Dismukes G. Annu. Rev. Biochem. 2013, 82, 577–606. [DOI] [PubMed] [Google Scholar]
- Ferreira K. N.; Iverson T. M.; Maghlaoui K.; Barber J.; Iwata S. Science 2004, 303, 1831–1838. [DOI] [PubMed] [Google Scholar]
- Sala X.; Romero I.; Rodríguez M.; Escriche L.; Llobet A. Angew. Chem., Int. Ed. 2009, 48, 2842–2852. [DOI] [PubMed] [Google Scholar]
- Wiechen M.; Najafpour M. M.; Allakhverdiev S. I.; Spiccia L. Energy Environ. Sci. 2014, 7, 2203–2212. [Google Scholar]
- Harriman A. Eur. J. Inorg. Chem. 2014, 2014, 573–580. [Google Scholar]
- Osterloh F. E. Chem. Soc. Rev. 2013, 42, 2294–2320. [DOI] [PubMed] [Google Scholar]
- Grätzel M. Nature 2001, 414, 338–344. [DOI] [PubMed] [Google Scholar]
- Umena Y.; Kawakami K.; Shen J.-R.; Kamiya N. Nature 2011, 473, 55–60. [DOI] [PubMed] [Google Scholar]
- Takashima T.; Hashimoto K.; Nakamura R. J. Am. Chem. Soc. 2011, 134, 1519–1527. [DOI] [PubMed] [Google Scholar]
- Kanan M. W.; Yano J.; Surendranath Y.; Dincă M.; Yachandra V. K.; Nocera D. G. J. Am. Chem. Soc. 2010, 132, 13692–13701. [DOI] [PubMed] [Google Scholar]
- Cummings C. Y.; Marken F.; Peter L. M.; Upul Wijayantha K. G.; Tahir A. A. J. Am. Chem. Soc. 2011, 134, 1228–1234. [DOI] [PubMed] [Google Scholar]
- Cummings C. Y.; Marken F.; Peter L. M.; Tahir A. A.; Wijayantha K. G. U. Chem. Commun. 2012, 48, 2027–2029. [DOI] [PubMed] [Google Scholar]
- Klahr B.; Hamann T. J. Phys. Chem. C 2014, 118, 10393–10399. [Google Scholar]
- Imanishi A.; Okamura T.; Ohashi N.; Nakamura R.; Nakato Y. J. Am. Chem. Soc. 2007, 129, 11569–11578. [DOI] [PubMed] [Google Scholar]
- Henderson M. A. Surf. Sci. Rep. 2011, 66, 185–297. [Google Scholar]
- Valdés Á.; Qu Z. W.; Kroes G. J.; Rossmeisl J.; Nørskov J. K. J. Phys. Chem. C 2008, 112, 9872–9879. [Google Scholar]
- Fujishima A.; Honda K. Nature 1972, 238, 37–38. [DOI] [PubMed] [Google Scholar]
- Warren S. C.; Voïtchovsky K.; Dotan H.; Leroy C. M.; Cornuz M.; Stellacci F.; Hébert C.; Rothschild A.; Grätzel M. Nat. Mater. 2013, 12, 842–849. [DOI] [PubMed] [Google Scholar]
- Cowan A. J.; Barnett C. J.; Pendlebury S. R.; Barroso M.; Sivula K.; Grätzel M.; Durrant J. R.; Klug D. R. J. Am. Chem. Soc. 2011, 133, 10134–10140. [DOI] [PubMed] [Google Scholar]
- Peter L. M.; Wijayantha K. G. U.; Tahir A. A. Faraday Discuss. 2012, 155, 309–322. [DOI] [PubMed] [Google Scholar]
- Barroso M.; Pendlebury S. R.; Cowan A. J.; Durrant J. R. Chem. Sci. 2013, 4, 2724–2734. [Google Scholar]
- Pesci F. M.; Cowan A. J.; Alexander B. D.; Durrant J. R.; Klug D. R. J. Phys. Chem. Lett. 2011, 2, 1900–1903. [Google Scholar]
- Ma Y.; Pendlebury S. R.; Reynal A.; Le Formal F.; Durrant J. R. Chem. Sci. 2014, 5, 2964–2973. [Google Scholar]
- Dare-Edwards M.; Goodenough J.; Hamnett A.; Trevellick P. J. Chem. Soc., Faraday Trans. 1 1983, 79, 2027–2041. [Google Scholar]
- Peter L. M.; Upul Wijayantha K. G. ChemPhysChem 2014, 15, 1983–1995. [DOI] [PubMed] [Google Scholar]
- Peter L. M. J. Solid State Electrochem. 2013, 17, 315–326. [Google Scholar]
- Klahr B.; Gimenez S.; Fabregat-Santiago F.; Hamann T.; Bisquert J. J. Am. Chem. Soc. 2012, 134, 4294–4302. [DOI] [PubMed] [Google Scholar]
- Le Formal F.; Sivula K.; Grätzel M. J. Phys. Chem. C 2012, 116, 26707–26720. [Google Scholar]
- Le Formal F.; Pendlebury S. R.; Cornuz M.; Tilley S. D.; Grätzel M.; Durrant J. R. J. Am. Chem. Soc. 2014, 136, 2564–2574. [DOI] [PubMed] [Google Scholar]
- Pendlebury S. R.; Cowan A. J.; Barroso M.; Sivula K.; Ye J.; Gratzel M.; Klug D. R.; Tang J.; Durrant J. R. Energy Environ. Sci. 2012, 5, 6304–6312. [Google Scholar]
- Kay A.; Cesar I.; Grätzel M. J. Am. Chem. Soc. 2006, 128, 15714–15721. [DOI] [PubMed] [Google Scholar]
- Le Formal F.; Gräetzel M.; Sivula K. Adv. Funct. Mater. 2010, 20, 1099–1107. [Google Scholar]
- Cesar I.; Sivula K.; Kay A.; Zboril R.; Grätzel M. J. Phys. Chem. C 2009, 113, 772–782. [Google Scholar]
- Dotan H.; Sivula K.; Grätzel M.; Rothschild A.; Warren S. C. Energy Environ. Sci. 2011, 4, 958–964. [Google Scholar]
- Pendlebury S. R.; Barroso M.; Cowan A. J.; Sivula K.; Tang J.; Grätzel M.; Klug D.; Durrant J. R. Chem. Commun. 2011, 47, 716–718. [DOI] [PubMed] [Google Scholar]
- Cherepy N.; Liston D.; Lovejoy J.; Deng H.; Zhang J. J. Phys. Chem. B 1998, 102, 770–776. [Google Scholar]
- Huang Z.; Lin Y.; Xiang X.; Rodriguez-Cordoba W.; McDonald K. J.; Hagen K. S.; Choi K.-S.; Brunschwig B. S.; Musaev D. G.; Hill C. L.; Wang D.; Lian T. Energy Environ. Sci. 2012, 5, 8923–8926. [Google Scholar]
- Zheng Y.; Cheng Y.; Wang Y.; Bao F.; Zhou L.; Wei X.; Zhang Y.; Zheng Q. J. Phys. Chem. B 2006, 110, 3093–3097. [DOI] [PubMed] [Google Scholar]
- Pflitsch C.; David R.; Verheij L. K.; Franchy R. J. Appl. Phys. 2001, 90, 1215–1221. [Google Scholar]
- Sivula K.; Le Formal F.; Grätzel M. ChemSusChem 2011, 4, 432–449. [DOI] [PubMed] [Google Scholar]
- Rossmeisl J.; Logadottir A.; Nørskov J. K. Chem. Phys. 2005, 319, 178–184. [Google Scholar]
- Nakamura R.; Nakato Y. J. Am. Chem. Soc. 2004, 126, 1290–1298. [DOI] [PubMed] [Google Scholar]
- Zhang M.; de Respinis M.; Frei H. Nat. Chem. 2014, 6, 362–367. [DOI] [PubMed] [Google Scholar]
- Liao P.; Keith J. A.; Carter E. A. J. Am. Chem. Soc. 2012, 134, 13296–13309. [DOI] [PubMed] [Google Scholar]
Associated Data
This section collects any data citations, data availability statements, or supplementary materials included in this article.