

Abstract
To investigate the feasibility of blood oxygen level dependent magnetic resonance imaging (BOLD-MRI) in evaluating human subcutaneous and visceral adipose tissue (AT) oxygenation status, as well as their responses to dietary salt loading/depletion, we enrolled 16 healthy subjects [mean body mass index (BMI): 24.8 ± 2.7 kg/m2] to conduct a dietary intervention study, beginning with a 3-day run-in period for usual diet, followed by a 7-day high-salt diet (≥ 15 g NaCl/day) and a 7-day low-salt diet (≤ 5 g NaCl/day). Abdominal BOLD-MRI scan was performed to evaluate oxygenation in waist subcutaneous and perirenal (visceral) AT. Two subjects with lower BMI were excluded because of the difficulty to identify subcutaneous AT. High salt diet led to a consistent increase in R2* signal (a parameter for increased hypoxia) both in subcutaneous and visceral AT (all P < 0.0001), which was completely regressed to baseline levels by low salt diet. In addition, subcutaneous AT R2* values at any time points, were all higher than that of visceral AT (all P < 0.0001). Pearson correlation analysis revealed that the visceral AT R2* levels were negatively associated obesity indicators (waist circumference, waist-to-hip ratio and BMI). On the contrary, although a trend towards negative associations between the subcutaneous AT R2* and obesity indicators was observed, none of the associations reached statistical significances. Thus, our data demonstrate the possibility of simultaneous detection of human subcutaneous and visceral AT oxygenation status using BOLD-MRI. In addition, there is a more close relationship visceral AT oxygenation status and the development of obesity.
Keywords: BOLD-MRI, visceral adipose tissue, subcutaneous adipose tissue, hypoxia, oxygenation, salt intake
Introduction
Emerging evidence suggests that adipose tissue (AT) is not a single homogeneous body compartment, but rather a highly active metabolic and endocrine organ with distinct developmental origins [1]. Recent longitudinal epidemiological studies have shown that different fat depots are associated with differential cardiovascular risk [2]. In these studies, most investigators focused on the prognostic values of the absolute volume fat deposit in different body compartments. However, several lines of experimental evidence [3-6], as well as a recent result from Framingham Heart Study cohort [7], suggest that the “quality” of AT, which includes AT hypoxia, microcirculation dysfunction, inflammatory cell infiltration and fibrosis, is another important characteristics linking obesity and cardiometabolic risk [8,9].
Among the several “quality” of AT, oxygenation status or AT hypoxia, is increasingly recognized as a key pathophysiological process associated with obesity, insulin resistance, and type 2 diabetes, and provides a mechanistic basis for chronic low-grade inflammation, immune cell infiltration, and alterations in adipokine production [10-12]. Currently, routinely used methods for determining human AT hypoxia are all invasive approaches, such as Clark-type oxygen electrode detected by polarography [13], microdialysis-based optochemical measurement [14], or tissue-specific venous catheterization [15]. Direct measurement of oxygen tension is the advantage of these methods, however, their disadvantages include a small sampling area that may not reflect the variations in oxygen tension among different regions, as well as the limited use in subcutaneous AT.
Blood oxygen level-dependent magnetic resonance imaging (BOLD-MRI) is a non-invasive tool for assessing organ/tissue hypoxia, which utilizes the magnetic properties of hemoglobin when it converts from the oxygenated to deoxygenated form. This method has been applied for indirect measurement of organ-level oxygenation under physiological and disease conditions [16-19]. Recently, our group provide proof-of-principle evidence supporting the feasibility of BOLD-MRI in monitoring visceral AT oxygenation in humans induced by dietary salt loading/depletion [20]. Because subcutaneous and visceral AT could be simultaneously visualized and analyzed by one BOLD-MRI scan, we thus intended to compared the BOLD-MRI signal changes in subcutaneous and visceral AT at baseline, as well as their responses to alterations in dietary salt intake, a known factor that could induce metabolic changes.
Materials and methods
Eligibility and recruitment
In this study, we enrolled non-smoking healthy volunteers by advertisement in our hospital. All subjects were screened to exclude cardiovascular disease (stroke, heart failure, coronary heart disease and peripheral artery disease), hematological disorders, cancer, diabetes and hypertension. All participants provided written informed consent. Strenuous physical exercises were forbidden throughout the study and volunteers were asked to ensure that sleep eight hours per day. The study protocol was approved by the institutional ethical committee, and was in accordance with the Declaration of Helsinki.
Study design
We conducted a three-phase dietary intervention study including usual-salt (baseline), high-salt and low-salt feeding as previously described [20,21]. Briefly, during the running-in period (baseline, the first 3 days), participants were asked to eat all their meals in the hospital’s cafeteria. From day 4 to day 17, all foods were prepared by study dietitians and provided by the investigators. The participants were required to eat their meals at a defined place while being monitored by the investigators. High-salt (15 g/day) and low-salt (5 g/day) diets were constructed with identical components (58% carbohydrate, 15% protein and 27% fat), expect for the difference in salt content, and provided a calorie amount of ~2300 kcal/day. The research protocol is shown in Figure 1. All blood pressure and heart rate measurements were recorded between 8:00 am and 10:00 am using an automatic Omron HEM-7200 device (Omron Inc., Dalian, China) in a sitting position after 10 min of rest. On days 3, 10, and 17, all participants were provided with a 4000 mL wide-neck plastic container to collect 24 h urine samples.
Figure 1.
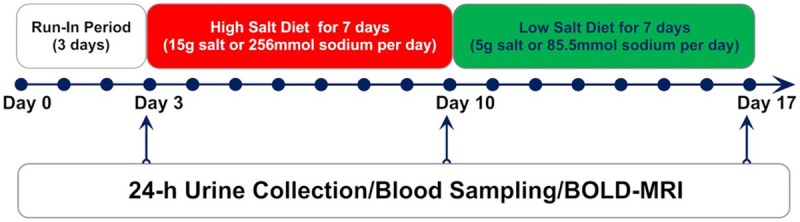
Dietary intervention protocol.
Adipose tissue BOLD-MRI examination
All volunteers in fasting state underwent dynamic BOLD-MRI on days 3, 10, and 17 by a Phillips Intera 3.0 Tesla whole body magnetic resonance system (Philips Medical Systems, the Netherlands) with a six-channel SENSE-Torso coil to receive the MR signal according previous reports [20-23]. Each volunteer was scanned in the supine position, following scout scans to determine optimal imaging planes. After an acquisition of standard three axial survey scan, a transverse TSE-T2WI sequence was performed using the following parameters: repetition time (TR)/echo time (TE) = 2416 ms/85 ms, field of view (FOV) = 375 × 297 mm2; slice thickness = 7 mm and intersection gap of 1 mm; matrix size = 288 × 192 mm2.
BOLD-MRI T2*-weighted images were performed by using a multi-echo 2D gradient-echo breathhold acquisition. Sixteen slices with a thickness of 5 mm and a gap of 0 mm were obtained in the coronal plane and transverse plane. The scanning had the following parameters: TR/TE = 120 ms/2.5~77.5 ms (echospacing = 5 ms); flip angle = 45°; matrix size = 132 × 109; NEX = 2; and FOV = 400 × 372 mm2.
Calculation of adipose tissue R2* value
The subcutaneous and visceral AT BOLD-MRI images were analyzed based on a modified protocol from previously published work [24]. We selected 8 images in which the tissue anatomic boundaries were clear from sixteen T2*- weighted images and processed them to getting the R2* maps using ImageJ (NIH, Bethesda, MD, USA). Calculated R2* value of subcutaneous and visceral AT on a pixel-by-pixel basis by fitting the corresponding echo time were also using ImageJ. Regions of interests (ROIs) with unfixed size [100-200 pixels for the abdominal subcutaneous AT, 50-80 pixels for the perirenal (visceral) AT] were placed randomly at abdominal subcutaneous and perirenal regions based on the anatomical images. For each R2* value measurement, a total of six ROIs were placed (three on the left and another three on the right); each ROI excluded big vessels. ROIs were selected by two experienced investigators and measured independently, and averaged.
Biochemical assays
Fasting blood samples were collected in all participants on days 3, 10, and 17, to measure serum glucose, total cholesterol (TC), high-density lipoprotein (HDL-C), low-density lipoprotein (LDL-C) and triglyceride (TG). Urinary sodium and potassium levels were determined by atomic absorbance spectrophotometry.
Statistical analysis
Our pilot study showed that mean difference in perirenal AT R2* values between day 3 and day 10, was ~3.0 sec-1 with a standard deviation (SD) of ~3.0 sec-1. Therefore, an estimated sample size of 12 to provides 90% power in a two-tailed approach to detect a difference in perirenal fat R2* values between day 3 and day 10. Continuous variables are presented as the mean ± SD or as median with interquartile range. The Shapiro-Wilk test for normality was performed on all continuous variables. A one-way repeated-measures ANOVA with Newman-Keuls post hoc analysis (normal distribution) or a Friedman test followed by a Dunn’s test for multiple comparisons (skewed distribution) was used to test difference across time. Comparison AT R2* value between subcutaneous and visceral AT was performed using a paired t test. Association analysis was performed using Pearson’s correlation. All statistical analysis was performed using GraphPad Prism version 5 (GraphPad Prism Software Inc., San Diego, CA, USA). A two-tailed P value < 0.05 was considered statistically significant.
Results
Demographic characteristics of participants
A total of 16 healthy subjects were enrolled, and all the subjects finished dietary intervention and three BOLD-MRI scans. Two subjects were excluded from analyses, because their abdominal subcutaneous AT was too thin to recognize during MRI scan. The remaining 14 subjects were included in final analyses: 11 men and 3 women, with mean age of 29.0 ± 4.6 years, mean body mass index (BMI) of 24.8 ± 2.7 kg/m2, mean waist circumference of 89.1 ± 9.3 cm, and mean waist-to-hip ratio of 0.88 ± 0.06.
Serum and urinary biochemical changes during dietary intervention
The physiological and biochemical changes during dietary intervention are shown in Table 1. The amount of daily sodium intake, as estimated using 24 h urinary sodium, had mean values of 149.6 mmol (8.75 g NaCl), 330.0 mmol (19.31 g NaCl) and 73.3 mmol (4.29 g NaCl) at run-in period (baseline, day 3), end of the high-salt diet feeding (day 10), and end of the low-salt diet feeding (day 17), respectively. These results indicate a perfect adherence to dietary intervention in all subjects. We did not observed obvious changes both in systolic and diastolic blood pressure levels during dietary intervention, whereas the heart rate was significantly increased at day 10 (P < 0.01). Serum triglyceride (P < 0.01) and glucose (P < 0.001) levels were significantly increased during high salt diet feeding, which could be regressed to baseline levels by low salt diet.
Table 1.
Physiological and Biochemical Changes during Dietary Intervention
| Baseline | High Salt | Low Salt | P for trend | |
|---|---|---|---|---|
| HR (bpm) | 74.93 ± 7.54 | 83.00 ± 8.50** | 79.21 ± 9.98 | 0.0013 |
| SBP (mmHg) | 119.0 ± 9.78 | 120.4 ± 7.29 | 119.6 ± 8.52 | 0.5853 |
| DBP (mmHg) | 72.50 ± 7.39 | 72.79 ± 7.76 | 72.86 ± 7.38 | 0.8961 |
| CHO (mmol/L) | 3.95 ± 0.44 | 3.88 ± 0.49 | 3.78 ± 0.55 | 0.2644 |
| TG (mmol/L) | 0.75 (0.59, 1.23) | 1.00 (0.64, 1.49)** | 0.78 (0.64, 1.14) | 0.0053 |
| LDL-C (mmol/L) | 2.54 ± 0.29 | 2.46 ± 0.30 | 2.41 ± 0.36 | 0.1694 |
| HDL-C (mmol/L) | 1.18 ± 0.13‡ | 1.11 ± 0.14 | 1.06 ± 0.13 | 0.0082 |
| GLU (mmol/L) | 4.52 ± 0.32‡ | 4.79 ± 0.29*** | 4.36 ± 0.45††† | < 0.001 |
| UV (mL/24 h) | 1604 ± 707 | 2196 ± 520** | 1514 ± 517†† | < 0.001 |
| UNa (mmol/24 h) | 149.6 ± 52.6‡‡‡ | 330.0 ± 41.464*** | 73.3 ± 23.1††† | < 0.001 |
| UK (mmol/24 h) | 27.32 ± 7.74 | 39.47 ± 8.44*** | 24.45 ± 7.24††† | < 0.001 |
| UCr (mmol/24 h) | 6.53 ± 2.06 | 9.72 ± 2.58*** | 5.82 ± 2.14††† | < 0.001 |
| VAT R2* (s-1) | 20.87 ± 2.81 | 23.68 ± 3.12*** | 20.47 ± 2.59††† | < 0.001 |
| SAT R2* (s-1) | 25.61 ± 2.99 | 28.44 ± 3.41*** | 25.34 ± 3.10††† | < 0.001 |
P < 0.05 vs. 1;
P < 0.01 vs. 1;
P < 0.001 vs. 1.
P < 0.01 vs. 2;
P < 0.001 vs. 2.
P < 0.05 vs. 3;
P < 0.001 vs. 3.
Abbreviations: HR, heart rate; SBP, systolic blood pressure; DBP, diastolic blood pressure; CHO, cholesterol; TG, serum triglyceride; LDL-C, low density lipoprotein; HDL-C, high density lipoprotein; GLU, glucose; UV, urinary volume; UNa, urinary sodium; UK, urinary potassium; UCr, urinary creatinine; VAT, visceral adipose tissue; SAT, subcutaneous adipose tissue.
Subcutaneous and visceral AT R2* value changes during dietary intervention
As shown in Table 1 and Figure 2, there was a consistent increase in both subcutaneous and visceral AT R2* values during high salt diet intervention (all P < 0.0001), a change indicating reduced tissue oxygenation. This trend was also consistently regressed to baseline levels by low salt diet. Of note, subcutaneous AT R2* values at any time points, were all higher than that of visceral AT (all P < 0.0001). This difference could be visualized from Figure 2D-F, which showed that majority area of visceral AT was occupied by colors denoting lower pseudocolor scales (dark blue, compared subcutaneous AT with bright blue). In addition, we can see from Figure 2D-F, that during high salt dietary intervention, the areas with higher pseudocolor scales were all increased both in subcutaneous AT and in visceral AT, indicating increased hypoxic state (reduced tissue oxygenation). Moreover, using Pearson’s correlation analysis, we observed a positive linear association between subcutaneous AT R2* and visceral AT R2* (Figure 3), although their association at baseline did not reach statistical significance (P = 0.066).
Figure 2.

Blood oxygen level-dependent magnetic resonance imaging (BOLD-MRI) of subcutaneous and visceral AT during dietary intervention. A: A typical abdominal coronal MRI image for the measurement of AT oxygenation. B: The waist subcutaneous and perirenal (visceral) AT from Figure A is highlighted by green and red color for ROI (region of interest) selection, respectively. C: Statistical comparison of BOLD-MRI signals during the intervention (n = 14, one-way repeated-measures ANOVA). D to F: Representative changes of BOLD-MRI images of one participant during dietary intervention on baseline (day 3), high salt (day 10) and low salt (day 17), respectively.
Figure 3.

Linear correlation analyses of subcutaneous AT R2* values and visceral AT R2* values during dietary intervention.
Relationships between subcutaneous and visceral AT R2* values and obesity indicators
We next evaluated the associations between AT R2* values and obesity indicators (BMI, waist circumference and waist-to-hip ratio) of the 14 subjects at baseline. As shown in Figure 4, the Pearson correlation analysis revealed that the visceral AT R2* levels were negatively associated all the above obesity indicators (with the exception for BMI with borderline significance, P = 0.062) with statistical significances (Figure 4, upper panel). On the contrary, although a trend towards negative associations between the subcutaneous AT R2* and obesity indicators was observed, none of the associations reached statistical significances (Figure 4, lower panel).
Figure 4.

Linear correlation analyses of subcutaneous and visceral AT R2* values at baseline and obesity indicators [waist circumference, waist-to-hip ratio and body mass index (BMI)].
Discussion
Although it is generally believed that visceral AT is more metabolically active than subcutaneous AT [25], and visceral AT is superior over its subcutaneous counterpart in cardiometabolic risk stratification [26-29], the invasive nature of traditional oxygenation measurement methods could not allow a direct comparison of hypoxic state between subcutaneous and visceral AT. In the present study, using BOLD-MRI we for the first time simultaneously measured subcutaneous and visceral AT oxygenation status in healthy subjects. Our main findings are three-fold. First, our data indicate that the oxygenation level in waist subcutaneous AT is lower than visceral AT (higher R2* value). Second, using high salt diet to induce alterations in glucose and lipid metabolism [20,21], both subcutaneous and visceral AT exhibited hypoxic response, which could be completely regressed by low salt diet. Third, visceral AT oxygenation level is negatively associated with obesity indicators (waist circumference, waist-to-hip ratio and BMI) in this cohort. Our data confirm the clinical potential of BOLD-MRI in evaluating subcutaneous AT and visceral AT hypoxia in humans, and may be helpful to resolve the current controversy regarding whether AT are presented with reduced oxygenation state in obese humans [12,14,15].
The proper function of AT relies on adequate AT blood flow [30]. Therefore, it is conceivable that visceral AT may have higher blood flow than subcutaneous AT, because visceral AT is bioenergetically more active to mitochondrial substrate supply than subcutaneous AT [25]. Indeed, a recent work confirmed the possibility of BOLD-MRI for the detection of brown AT activity in mice [31]. Our first finding that visceral oxygenation status of visceral AT is higher (lower R2* value) than subcutaneous AT in all subjects at all stages of dietary intervention further supports the general agreement that visceral AT is more metabolically active than subcutaneous AT. Our results are in line with a recent study conducted by Viljanen and coworkers in obese humans using [15O] H2O and positron emission tomography [32], which showed that blood flow per gram of adipose tissue were higher in visceral fat compared to abdominal subcutaneous fat. BOLD-MRI is used for the detection of “net” effect resulting from the balance between oxygen supply and demand. Therefore, in resting state, BOLD-MRI R2 signal is also a surrogate measurement blood flow.
The second finding from this study is that both visceral and subcutaneous AT present with a paralleled hypoxic response to high salt diet. High salt intake is closely linked with elevated blood pressure in population. However, in this study we did not observed a significant increase in blood pressure level during high salt feeding because our young, healthy participants are less likely to be sodium sensitive, a phenomenon associated aging [33,34]. Nonetheless, in agreement with our previous reports [20,21], our participants presented with the sign of sympathetic activation during high salt intervention, as shown by elevated heart rate. Under fasting state, AT blood flow is determined by the balance between sympathetic activity and endothelial derived vasodilatory agent (nitric oxide) [30]. Thus, high salt diet induced endothelial dysfunction [35] and sympathetic activation, are likely to contribute to reduced oxygenation observed in this study.
The third finding, perhaps the most interesting one, is that basal visceral AT oxygenation level (a similar trend, but nonstatitical significance was observed in subcutaneous AT), is negatively associated with obesity indicators (waist circumference, waist-to-hip ratio and BMI; Figure 4). It is generally acknowledged that visceral AT expansion precedes the appearance metabolic alterations, such as insulin resistance, dyslipidemia, and hypertension, which will progress toward associated pathologies such as type 2 diabetes and cardiovascular disease. Moreover, the expansion process is inevitably associated increased formation of capillary density. Because the participants in our study are relatively lean subjects (mean BMI = 24.8 Kg/m2), this finding is not contradictory to the emerging concept that obesity is associated with hypoxia, but rather provides the evidence indicating that during the early stage of obesity development, AT expansion is associated with corresponding expansion of vasculature in AT, as well as the accompanied increase in blood flow [36]. In addition, our data are in agreement with recent report that waist circumference and waist-to-hip ratio are better assessors of metabolic risk than BMI (borderline statistical significance) because they are more directly proportional to total body fat and the amount of metabolically active visceral fat [37].
BOLD-MRI uses deoxyhemoglobin as an endogenous contrast agent, which can be performed without contrast agent or radiation exposure. This technique is based on difference in magnetic susceptibility between oxyhemoglobin and deoxyhemoglobin: deoxyhemoglobin is a paramagnetic substance, and oxyhemoglobin is mildly diagmagnetic, thus deoxyhemoglobin could produce local field gradients between red blood cells and their surrounding tissue. This property of deoxyhemoglobin could lead to magnetic field perturbations in gradient echo T2*-weighted sequences, and causing transverse relaxation time to decrease, therefore the R2* (defined as 1/T2*) is related to the concentration of deoxyhemoglobin. In this study, we also noted that both at baseline and during dietary intervention, the changes of R2* signals of subcutaneous and visceral AT did not present with a unified pattern, but rather small scatters with different R2* intensity (Figure 4). This characteristic of AT oxygenation status raises the concern of potential sampling bias when using techniques focused on small area sampling, and gives BOLD-MRI potential advantage over traditional invasive and subcutaneous AT-based approaches in evaluating human AT hypoxia.
Our work has the following limitations. First, BOLD-MRI determined R2* signal is not a direct measurement of tissue oxygenation, thus future standard calibration studies are needed to transfer the R2* signals into “real” tissue oxygenation status. Second, BOLD-MRI might not be suitable for evaluating subject with low BMI. Two participants with BMI less than 17.0 were excluded in this study because their subcutaneous AT were too thin to provide adequate sampling spots during BOLD image analysis.
In conclusion, we demonstrate the possibility of simultaneous detection of human subcutaneous and visceral AT oxygenation status using BOLD-MRI. Moreover, there is a more close relationship visceral AT oxygenation status and the development of obesity. Future studies on obese subjects, as well as on patients with overt insulin resistance and dyslipidemia are required to verify the usefulness of BOLD-MRI as a novel tool in cardiometabolic risk evaluation.
Acknowledgements
This work was supported by National Natural Science Foundation of China (81070121, 81102088, 81170238 and 81401401), Tianjin Municipal Science and Technology Committee (11JCYBJC12000 and 12JCYBJC16600) and intramural research program from Pingjin Hospital and Tianjin Key Laboratory of Cardiovascular Remodeling and Target Organ Injury (FYZ201405 and TJC1403).
Disclosure of conflict of interest
None.
References
- 1.Chau YY, Bandiera R, Serrels A, Martinez-Estrada OM, Qing W, Lee M, Slight J, Thornburn A, Berry R, McHaffie S, Stimson RH, Walker BR, Chapuli RM, Schedl A, Hastie N. Visceral and subcutaneous fat have different origins and evidence supports a mesothelial source. Nat Cell Biol. 2014;16:367–375. doi: 10.1038/ncb2922. [DOI] [PMC free article] [PubMed] [Google Scholar]
- 2.Tchernof A, Despres JP. Pathophysiology of human visceral obesity: an update. Physiol Rev. 2013;93:359–404. doi: 10.1152/physrev.00033.2011. [DOI] [PubMed] [Google Scholar]
- 3.Han JM, Levings MK. Immune regulation in obesity-associated adipose inflammation. J Immunol. 2013;191:527–532. doi: 10.4049/jimmunol.1301035. [DOI] [PubMed] [Google Scholar]
- 4.Trayhurn P. Hypoxia and adipose tissue function and dysfunction in obesity. Physiol Rev. 2013;93:1–21. doi: 10.1152/physrev.00017.2012. [DOI] [PubMed] [Google Scholar]
- 5.Sell H, Habich C, Eckel J. Adaptive immunity in obesity and insulin resistance. Nat Rev Endocrinol. 2012;8:709–716. doi: 10.1038/nrendo.2012.114. [DOI] [PubMed] [Google Scholar]
- 6.Sun K, Tordjman J, Clement K, Scherer PE. Fibrosis and adipose tissue dysfunction. Cell Metab. 2013;18:470–477. doi: 10.1016/j.cmet.2013.06.016. [DOI] [PMC free article] [PubMed] [Google Scholar]
- 7.Rosenquist KJ, Pedley A, Massaro JM, Therkelsen KE, Murabito JM, Hoffmann U, Fox CS. Visceral and subcutaneous fat quality and cardiometabolic risk. JACC Cardiovasc Imaging. 2013;6:762–771. doi: 10.1016/j.jcmg.2012.11.021. [DOI] [PMC free article] [PubMed] [Google Scholar]
- 8.Farb MG, Ganley-Leal L, Mott M, Liang Y, Ercan B, Widlansky ME, Bigornia SJ, Fiscale AJ, Apovian CM, Carmine B, Hess DT, Vita JA, Gokce N. Arteriolar function in visceral adipose tissue is impaired in human obesity. Arterioscler Thromb Vasc Biol. 2012;32:467–473. doi: 10.1161/ATVBAHA.111.235846. [DOI] [PMC free article] [PubMed] [Google Scholar]
- 9.Hajer GR, van Haeften TW, Visseren FL. Adipose tissue dysfunction in obesity, diabetes, and vascular diseases. Eur Heart J. 2008;29:2959–2971. doi: 10.1093/eurheartj/ehn387. [DOI] [PubMed] [Google Scholar]
- 10.Ye J. Emerging role of adipose tissue hypoxia in obesity and insulin resistance. Int J Obes (Lond) 2009;33:54–66. doi: 10.1038/ijo.2008.229. [DOI] [PMC free article] [PubMed] [Google Scholar]
- 11.Osborn O, Olefsky JM. The cellular and signaling networks linking the immune system and metabolism in disease. Nat Med. 2012;18:363–374. doi: 10.1038/nm.2627. [DOI] [PubMed] [Google Scholar]
- 12.Trayhurn P. Hypoxia and adipocyte physiology: implications for adipose tissue dysfunction in obesity. Annu Rev Nutr. 2014;34:207–236. doi: 10.1146/annurev-nutr-071812-161156. [DOI] [PubMed] [Google Scholar]
- 13.Pasarica M, Sereda OR, Redman LM, Albarado DC, Hymel DT, Roan LE, Rood JC, Burk DH, Smith SR. Reduced adipose tissue oxygenation in human obesity: evidence for rarefaction, macrophage chemotaxis, and inflammation without an angiogenic response. Diabetes. 2009;58:718–725. doi: 10.2337/db08-1098. [DOI] [PMC free article] [PubMed] [Google Scholar]
- 14.Goossens GH, Bizzarri A, Venteclef N, Essers Y, Cleutjens JP, Konings E, Jocken JW, Cajlakovic M, Ribitsch V, Clement K, Blaak EE. Increased adipose tissue oxygen tension in obese compared with lean men is accompanied by insulin resistance, impaired adipose tissue capillarization, and inflammation. Circulation. 2011;124:67–76. doi: 10.1161/CIRCULATIONAHA.111.027813. [DOI] [PubMed] [Google Scholar]
- 15.Hodson L, Humphreys SM, Karpe F, Frayn KN. Metabolic signatures of human adipose tissue hypoxia in obesity. Diabetes. 2013;62:1417–1425. doi: 10.2337/db12-1032. [DOI] [PMC free article] [PubMed] [Google Scholar]
- 16.Prasad PV, Edelman RR, Epstein FH. Noninvasive evaluation of intrarenal oxygenation with BOLD MRI. Circulation. 1996;94:3271–3275. doi: 10.1161/01.cir.94.12.3271. [DOI] [PubMed] [Google Scholar]
- 17.Neugarten J. Renal BOLD-MRI and assessment for renal hypoxia. Kidney Int. 2012;81:613–614. doi: 10.1038/ki.2011.462. [DOI] [PubMed] [Google Scholar]
- 18.Savoy RL. Evolution and current challenges in the teaching of functional MRI and functional brain imaging. Neuroimage. 2012;62:1201–1207. doi: 10.1016/j.neuroimage.2012.02.029. [DOI] [PubMed] [Google Scholar]
- 19.Tsaftaris SA, Zhou X, Tang R, Li D, Dharmakumar R. Detecting myocardial ischemia at rest with cardiac phase-resolved blood oxygen level-dependent cardiovascular magnetic resonance. Circ Cardiovasc Imaging. 2013;6:311–319. doi: 10.1161/CIRCIMAGING.112.976076. [DOI] [PMC free article] [PubMed] [Google Scholar]
- 20.Zhou X, Yuan F, Ji WJ, Guo ZZ, Zhang L, Lu RY, Liu X, Liu HM, Zhang WC, Jiang TM, Zhang Z, Li YM. High-salt intake induced visceral adipose tissue hypoxia and its association with circulating monocyte subsets in humans. Obesity (Silver Spring) 2014;22:1470–1476. doi: 10.1002/oby.20716. [DOI] [PubMed] [Google Scholar]
- 21.Zhou X, Zhang L, Ji WJ, Yuan F, Guo ZZ, Pang B, Luo T, Liu X, Zhang WC, Jiang TM, Zhang Z, Li YM. Variation in dietary salt intake induces coordinated dynamics of monocyte subsets and monocyte-platelet aggregates in humans: implications in end organ inflammation. PLoS One. 2013;8:e60332. doi: 10.1371/journal.pone.0060332. [DOI] [PMC free article] [PubMed] [Google Scholar]
- 22.Gloviczki ML, Glockner JF, Crane JA, McKusick MA, Misra S, Grande JP, Lerman LO, Textor SC. Blood oxygen level-dependent magnetic resonance imaging identifies cortical hypoxia in severe renovascular disease. Hypertension. 2011;58:1066–1072. doi: 10.1161/HYPERTENSIONAHA.111.171405. [DOI] [PMC free article] [PubMed] [Google Scholar]
- 23.Chrysochou C, Mendichovszky IA, Buckley DL, Cheung CM, Jackson A, Kalra PA. BOLD imaging: a potential predictive biomarker of renal functional outcome following revascularization in atheromatous renovascular disease. Nephrol Dial Transplant. 2012;27:1013–1019. doi: 10.1093/ndt/gfr392. [DOI] [PubMed] [Google Scholar]
- 24.Rognant N, Guebre-Egziabher F, Bacchetta J, Janier M, Hiba B, Langlois JB, Gadet R, Laville M, Juillard L. Evolution of renal oxygen content measured by BOLD MRI downstream a chronic renal artery stenosis. Nephrol Dial Transplant. 2011;26:1205–1210. doi: 10.1093/ndt/gfq538. [DOI] [PubMed] [Google Scholar]
- 25.Kraunsoe R, Boushel R, Hansen CN, Schjerling P, Qvortrup K, Stockel M, Mikines KJ, Dela F. Mitochondrial respiration in subcutaneous and visceral adipose tissue from patients with morbid obesity. J Physiol. 2010;588:2023–2032. doi: 10.1113/jphysiol.2009.184754. [DOI] [PMC free article] [PubMed] [Google Scholar]
- 26.Chandra A, Neeland IJ, Berry JD, Ayers CR, Rohatgi A, Das SR, Khera A, McGuire DK, de Lemos JA, Turer AT. The relationship of body mass and fat distribution with incident hypertension: observations from the Dallas Heart Study. J Am Coll Cardiol. 2014;64:997–1002. doi: 10.1016/j.jacc.2014.05.057. [DOI] [PubMed] [Google Scholar]
- 27.Kim H, Kim HJ, Shin N, Han M, Park H, Kim M, Kwon H, Choi SY, Heo NJ. Visceral obesity is associated with microalbuminuria in nondiabetic Asians. Hypertens Res. 2014;37:679–684. doi: 10.1038/hr.2014.47. [DOI] [PubMed] [Google Scholar]
- 28.Fox CS, Massaro JM, Hoffmann U, Pou KM, Maurovich-Horvat P, Liu CY, Vasan RS, Murabito JM, Meigs JB, Cupples LA, D’Agostino RB Sr, O’Donnell CJ. Abdominal visceral and subcutaneous adipose tissue compartments: association with metabolic risk factors in the Framingham Heart Study. Circulation. 2007;116:39–48. doi: 10.1161/CIRCULATIONAHA.106.675355. [DOI] [PubMed] [Google Scholar]
- 29.Morange PE, Alessi MC. Thrombosis in central obesity and metabolic syndrome: mechanisms and epidemiology. Thromb Haemost. 2013;110:669–680. doi: 10.1160/TH13-01-0075. [DOI] [PubMed] [Google Scholar]
- 30.Sotornik R, Brassard P, Martin E, Yale P, Carpentier AC, Ardilouze JL. Update on adipose tissue blood flow regulation. Am J Physiol Endocrinol Metab. 2012;302:E1157–1170. doi: 10.1152/ajpendo.00351.2011. [DOI] [PubMed] [Google Scholar]
- 31.Khanna A, Branca RT. Detecting brown adipose tissue activity with BOLD MRI in mice. Magn Reson Med. 2012;68:1285–1290. doi: 10.1002/mrm.24118. [DOI] [PMC free article] [PubMed] [Google Scholar]
- 32.Viljanen AP, Lautamaki R, Jarvisalo M, Parkkola R, Huupponen R, Lehtimaki T, Ronnemaa T, Raitakari OT, Iozzo P, Nuutila P. Effects of weight loss on visceral and abdominal subcutaneous adipose tissue blood-flow and insulin-mediated glucose uptake in healthy obese subjects. Ann Med. 2009;41:152–160. doi: 10.1080/07853890802446754. [DOI] [PubMed] [Google Scholar]
- 33.Paar M, Pavenstadt H, Kusche-Vihrog K, Druppel V, Oberleithner H, Kliche K. Endothelial sodium channels trigger endothelial salt sensitivity with aging. Hypertension. 2014;64:391–396. doi: 10.1161/HYPERTENSIONAHA.114.03348. [DOI] [PubMed] [Google Scholar]
- 34.Chen J, Gu D, Huang J, Rao DC, Jaquish CE, Hixson JE, Chen CS, Lu F, Hu D, Rice T, Kelly TN, Hamm LL, Whelton PK, He J. Metabolic syndrome and salt sensitivity of blood pressure in non-diabetic people in China: a dietary intervention study. Lancet. 2009;373:829–835. doi: 10.1016/S0140-6736(09)60144-6. [DOI] [PMC free article] [PubMed] [Google Scholar]
- 35.Dickinson KM, Clifton PM, Keogh JB. Endothelial function is impaired after a high-salt meal in healthy subjects. Am J Clin Nutr. 2011;93:500–505. doi: 10.3945/ajcn.110.006155. [DOI] [PubMed] [Google Scholar]
- 36.Corvera S, Gealekman O. Adipose tissue angiogenesis: impact on obesity and type-2 diabetes. Biochim Biophys Acta. 2014;1842:463–472. doi: 10.1016/j.bbadis.2013.06.003. [DOI] [PMC free article] [PubMed] [Google Scholar]
- 37.McClean KM, Kee F, Young IS, Elborn JS. Obesity and the lung: 1. Epidemiology. Thorax. 2008;63:649–654. doi: 10.1136/thx.2007.086801. [DOI] [PubMed] [Google Scholar]