

Abstract
Quantitative trait loci (QTLs) are being used to study genetic networks, protein functions, and systems properties that underlie phenotypic variation and disease risk in humans, model organisms, agricultural species, and natural populations. The challenges are many, beginning with the seemingly simple tasks of mapping QTLs and identifying their underlying genetic determinants. Various specialized resources have been developed to study complex traits in many model organisms. In the mouse, remarkably different pictures of genetic architectures are emerging. Chromosome Substitution Strains (CSSs) reveal many QTLs, large phenotypic effects, pervasive epistasis, and readily identified genetic variants. In contrast, other resources as well as genome-wide association studies (GWAS) in humans and other species reveal genetic architectures dominated with a relatively modest number of QTLs that have small individual and combined phenotypic effects. These contrasting architectures are the result of intrinsic differences in the study designs underlying different resources. The CSSs examine context-dependent phenotypic effects independently among individual genotypes, whereas with GWAS and other mouse resources, the average effect of each QTL is assessed among many individuals with heterogeneous genetic backgrounds. We argue that variation of genetic architectures among individuals is as important as population averages. Each of these important resources has particular merits and specific applications for these individual and population perspectives. Collectively, these resources together with high-throughput genotyping, sequencing and genetic engineering technologies, and information repositories highlight the power of the mouse for genetic, functional, and systems studies of complex traits and disease models.
Genetics of complex traits and disease
Mutations have been identified in more than 5000 genes that lead to monogenic disease in humans (Chen et al. 2013). These discoveries have revolutionized the diagnosis of single-gene disorders and in certain instances have led to new treatments, including those for hemophilia and leukemia (Ginsburg 2011). However, identifying the underlying genetic variants for polygenic conditions, which are the predominant source of phenotypic variation and disease, has not kept pace with their simpler counterparts (Manolio et al. 2009; Lu et al. 2014). It is hoped that identifying the genes that underlie these common conditions will lead to improvements in diagnostic and treatment capabilities similar to those already achieved for single-gene traits.
Both large- and small-scale studies have sought to discover the genetic variants responsible for susceptibility to complex diseases such as diabetes, Alzheimer's disease, and multiple sclerosis as well as variants that regulate normal trait variation. These ongoing studies have focused on genome and exome sequencing as well as on genome-wide association, linkage, and candidate gene approaches. Although progress has been made with thousands of genetic variants now associated with complex phenotypes, the majority of the heritable risk remains unexplained because the combined action of reported variants generally accounts for a modest portion of the estimated hereditary component of phenotypic variation (Manolio et al. 2009). In addition, a causal role has not been proven for most of the candidate variants (Chakravarti et al. 2013).
Several explanations for “missing heritability” have been proposed, including allelic heterogeneity, locus heterogeneity, rare variants, small effect sizes, epistasis, epigenetics, poor tagging of causal variants, and overestimates of heritability (Eichler et al. 2010; McClellan and King 2010; Zuk et al. 2012). The relative contribution of each putative explanation to missing heritability may be trait specific. This is illustrated by the impact of locus heterogeneity, which reflects the number of different genes that influence a trait or disease, on GWAS for height and age-related macular degeneration. A GWAS of 2172 individuals to detect susceptibility loci for age-related macular degeneration identified five QTLs that together accounted for 50% of trait heritability (Maller et al. 2006; Manolio et al. 2009). In contrast, initial GWAS studies totaling 63,000 individuals for height identified 40 QTLs that together only accounted for 5% of trait heritability (Visscher 2008; Manolio et al. 2009). A meta-analysis of 253,288 individuals was needed to identify 697 QTLs that collectively accounted for heritability levels approaching the macular degeneration study that was based on 100-fold fewer individuals (Wood et al. 2014). The limited locus heterogeneity coupled with larger effect sizes are likely the primary reasons that the risk factors for macular degeneration were among the first risk alleles identified with GWAS (Maller et al. 2006). Conversely, the greater locus heterogeneity coupled with smaller effect sizes for height led to high estimates of missing heritability from the initial GWAS (Visscher 2008). Whether the genetics of other traits will prove more similar to height or to macular degeneration remains to be seen because few other traits have sample sizes as large. In addition, despite the large-scale studies of height, approximately half the heritability continues to elude discovery. Factors complicating the efforts to further explore the missing heritability include the many challenges associated with human studies, including environmental effects, cost and logistics, phenotypic measurements, multigenerational genetic data, replication, data access, and privacy concerns.
Studies of genetic architecture involve identifying not only each susceptibility allele and variant gene, but also characterizing allele frequencies, trait variance, dominance effects, expressivity, environmental influences, gene–gene and gene–environment interactions, inheritance patterns, and spontaneous mutation rates (Mackay 2001). A deeper understanding of genetic architecture should lead to improved diagnostics and therapeutic targets based on gene sequences, functional networks, and systems properties (Nadeau and Dudley 2011; Manolio 2013). Given both the importance of understanding the genetic basis of complex disease and the substantial challenges with conducting these studies in humans, considerable investments are being made in model organisms, ranging from studies with single-cell organisms and plants to invertebrates and vertebrates (Singer et al. 2004; Aylor et al. 2011; Ingvarsson and Street 2011; Huang et al. 2012; Bloom et al. 2013; Alonso-Blanco and Méndez-Vigo 2014). This review focuses on studies conducted with mouse models and discusses the contrasting evidence that has yielded distinct pictures of genetic architectures for similar traits and disease models when studied with different genetic resources.
Model organisms
Model organisms have many advantages for studying complex traits, including control over variables such as genetic background, diet, stress, bacterial and viral load, and chemical and toxin exposures. Standardized diets enable comparisons among studies conducted in different laboratories at different times. Monitoring for specific pathogens limits the confounding effects of commensal organisms and acute infection. Inbreeding provides a level of genetic control not possible in humans. Planned crosses and pedigree information can be used to investigate parental and inherited epigenetic effects. Detailed phenotyping can be undertaken in time-course studies. Cells, tissues, and organs can be accessed that are not available in humans. Results of these studies can then be used to guide corresponding investigations in humans (Schughart et al. 2013).
Insights from mouse models
Initially, investigators relied on existing genetic and phenotypic diversity among the many inbred strains of mice. Thousands and perhaps millions of DNA sequence variants that differ among these strains contribute individually and collectively to phenotypic variation and disease risk (Keane et al. 2011; Grubb et al. 2014). These naturally occurring variants are thought to more appropriately model the kinds of genetic variants found in humans as opposed to engineered or induced loss-of-function mutations in single genes that are currently being systematically produced and that are essential for functional, mechanistic, and systems studies (Bradley et al. 2012; Brown and Moore 2012; Koscielny et al. 2014). The phenotypic consequences of these naturally occurring variants are expected to involve subtle regulatory or functional changes, rather than the often severe loss-of-function variants that result from genetic engineering.
More than 100 years of developing and studying laboratory mice has led to a wealth of information about the broad range of phenotypes among these strains (Beck et al. 2000). For example, C57BL/6J, which is the most commonly used inbred strain in biomedical research, develops diet-induced obesity, has a high preference for ethanol, and demonstrates late-onset hearing loss (McClearn and Rodgers 1961; Surwit et al. 1988; Zheng et al. 1999). These susceptibilities are in contrast to other inbred strains that are resistant to diet-induced obesity (A/J), have a low preference for ethanol (DBA/2J), or do not develop hearing loss (CBA/CaJ) (Belknap et al. 1993; Black et al. 1998; Zheng et al. 1999). Other examples of phenotypic variation among inbred strains include M. tuberculosis infection (susceptible: CBA, DBA/2, C3H, 129/X1; resistant: BALB/c, C57BL/6J) and atherosclerosis (susceptible: DBA/2, C57BL/6J; resistant: BALB/c, C3H) among many others (http://www.jax.org/phenome) (Paigen et al. 1985; Medina and North 2001; Grubb et al. 2014).
Despite great promise, early attempts at identifying susceptibility genes for complex traits using inbred strains met with limited success (Glazier et al. 2002). These studies were largely conducted within individual laboratories and were based primarily on intercrosses or backcrosses between pairs of inbred strains that showed contrasting phenotypes. Many QTLs for a wide range of traits were mapped using this approach. However, few of the causal genetic variants were identified (Nadeau 2003; Flint et al. 2005). In fact, estimates of the success rate of gene identification from a mapped QTL were as low as 1% (Drinkwater and Gould 2012). Nonetheless, identification of these genetic variants established the principles and practices that would guide the development of more sophisticated genetic resources.
Many of these pioneering studies in model organisms also showed that variants in several genes could act together in a nonadditive manner to yield dramatic phenotypic differences (MacPhee et al. 1995; Mohlke et al. 1999; Ikeda et al. 2002; Buchner et al. 2003; Floyd et al. 2003; Nadeau 2003). Subsequent studies in humans reported similar evidence. For example, Bardet-Biedl syndrome is characterized by obesity, developmental delay, polydactyly, and retinal dystrophy. This syndrome is typically inherited as an autosomal recessive disorder resulting from mutations in any of at least 16 different genes (Forsythe and Beales 2013). Interestingly, several cases show that a mutation in a second Bardet-Biedl syndrome gene is required to develop the condition or to modify the severity of the phenotype (Katsanis et al. 2001, 2002; Badano 2003; Beales et al. 2003; Badano et al. 2006). Hirschsprung's disease is another classic example of an oligogenic disease. Affected individuals lack enteric neurons along the gastrointestinal tract, leading to constipation or intestinal obstruction. The penetrance and severity of Hirschsprung's disease is often determined by interactions between genes within the GDNF/RET and EDNRB pathways, including an interaction between RET and NRG1 (Gabriel et al. 2002; Garcia-Barcelo et al. 2009; Wallace and Anderson 2011; Alves et al. 2013). The key to success for these genetic studies lies in the important but limited genetic heterogeneity of each disorder. Multiple pedigrees with mutations in the same gene allowed for standard linkage and gene identification techniques to be applied, as has been done for conditions that show Mendelian inheritance (Attié et al. 1995; Katsanis et al. 2000). Despite these and other examples, even the simplest gene interactions have been notoriously difficult to study, and evidence beyond pairwise gene interactions is rare (Mackay 2013; Mackay and Moore 2014).
Although many disorders, including Bardet-Biedl and Hirschsprung's, are largely determined by mutations in a small number of genes, most traits in humans, mice, and other species do not share this genetic simplicity. Large-scale international efforts are underway to dissect the genetics of these common conditions (Cornelis et al. 2010; Sullivan 2010; Ehret et al. 2011; Rivas et al. 2011; Yang et al. 2012). However, of the thousands of significant associations between genetic variants and complex traits or disease, most account for only a modest portion of overall trait variability (Visscher et al. 2012; Robinson et al. 2014). This has rendered it impossible to accurately characterize the genetic architecture of most complex traits (Agarwala et al. 2013). Progress has been slow because the methods that worked so well for studying monogenic and oligogenic traits are poorly suited for multigenic conditions. As human genetics strives to resolve these fundamental issues, we can turn to mouse models to gain insight into the genetic architecture of complex traits.
Genetic resources for complex traits
New methods and resources were proposed to improve the efficiency of QTL mapping and gene identification. These new resources are beyond the ability of most laboratories to create because of the substantial scale, logistics, and costs of such an endeavor, but once generated, these resources can be shared with interested researchers for their research programs. These resources included the Collaborative Cross (CC), Outbred Stocks (OS), the Hybrid Mouse Diversity Panel (HMDP), and Chromosome Substitution Strains (CSSs) (Nadeau et al. 2000; Churchill et al. 2004; Bennett et al. 2010; Yalcin and Flint 2012). Each is currently available as a community resource (Table 1).
Table 1.
Websites providing details for resources to study complex traits in mice
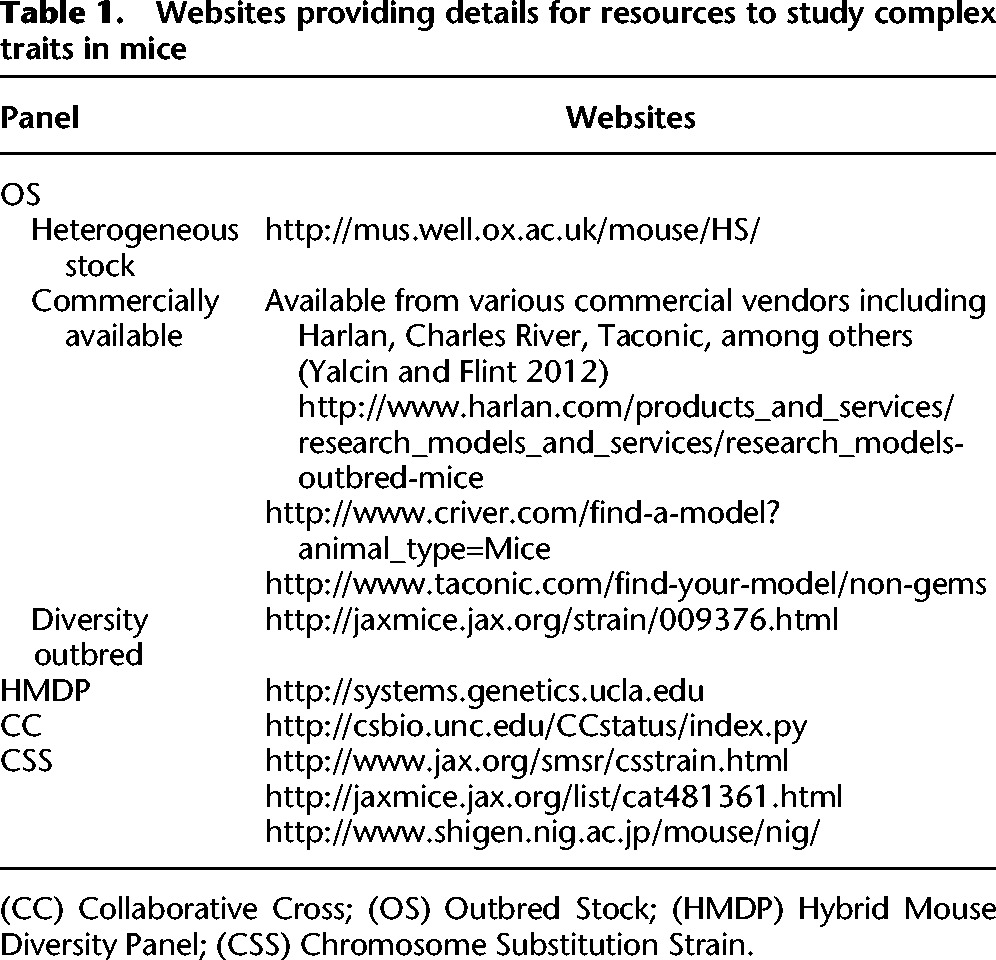
The nature, strengths, and logistics of each resource are important considerations. In addition to the theoretical merits involved in their design, each resource has now been used to study complex traits. As a result, evidence is available about their utility and the nature of discoveries. The CC, OS, and HMDP resources, which share the general feature of testing for common genetic effects across heterogeneous backgrounds, will be discussed first. CSSs, which test a single chromosome independently of the other but always on a uniform and defined genetic background, will be discussed last. These complementary approaches have important consequences not only for QTL mapping and gene identification, but they are also leading to strikingly different pictures of the genetic architecture of complex traits.
Collaborative Cross (CC)
The CC sought to improve QTL mapping efficiency by increasing statistical power, improving mapping resolution, and enhancing genetic diversity relative to previously available paradigms (Fig. 1A). The CC is based on the principle of Recombinant Inbred (RI) strains, which have been used for decades for various genetic studies (Bailey 1971; Justice et al. 1992; Threadgill et al. 2011). Each RI strain has a unique combination of allelic variants and recombinant chromosomes derived from its two inbred progenitor strains. These recombinant chromosomes have been fixed in the homozygous state by serial intercrossing. RI strains that are currently available from The Jackson Laboratory include AXB (n = 16 strains), BXA (n = 14 strains), BXD (n = 89 strains), BXH (n = 13 strains), and CXB (n = 13 strains). These RI panels have been used to map genes for alcohol preference, bone mineral density, and hematopoietic stem cell functions among others (Marshall et al. 1992; Phillips et al. 1994; Klein et al. 1998; Peirce et al. 2004; Bystrykh et al. 2005). The greater relative numbers of BXD strains have contributed toward them becoming the most commonly used RI strain. The BXD strains have been used to map genes that control metabolism, including the regulation of hypophosphatasia by Alpl (Andreux et al. 2012) and the regulation of fasting glucose and diabetes susceptibility by Dhtkd1 (Wu et al. 2014). Analysis of the BXD strains has also been elegantly combined with gene knockdown studies in C. elegans to discover that Mrps5 and other mitochondrial ribosomal proteins regulate longevity (Houtkooper et al. 2013).
Figure 1.

The genetic composition of mouse resources for studying complex traits. The genetic makeup of a typical mouse strain is shown for the Collaborative Cross (A), Chromosome Substitution Strains (B), Outbred Stocks (C), and the Hybrid Mouse Diversity Panel (D). Two sets of chromosomes are shown for the Hybrid Mouse Diversity Panel because it is comprised of both inbred and recombinant inbred strains. Each rectangle represents a chromosome, and each color represents the genetic contribution from a different mouse strain. Mitochondria are not shown.
The CC differs from conventional RI panels because eight, rather than two, strains were used as progenitors, thereby dramatically increasing the genetic and phenotypic diversity of this resource. The progenitor strains were A/J, C57BL/6J, 129S1/SvImJ, NOD/ShiLtJ, NZO/H1LtJ, and the wild-derived strains CAST/EiJ, PWK/PhJ, and WSB/EiJ. The original plans called for generating 1000 new RI lines, with each strain capturing approximately 135 unique recombination events (Threadgill et al. 2002). Across the 1000 CC strains, this exceptional number of recombination events was intended to provide a mapping resolution of ∼200,000 bp (Peters et al. 2007). The large sample size was also sufficient for detecting certain kinds of gene–gene and gene–environment interactions (Churchill et al. 2004; Valdar et al. 2006a; Peters et al. 2007). However, considerable breeding difficulties were encountered (Philip et al. 2011); and as of January 1, 2015, only 69 strains are listed as available on the CC website (Table 1) with a current goal of about 100 strains. Despite these difficulties, investigators have used these 69 completed strains and other incipient lines to study the genetics of infection, body weight, food intake, cancer, albuminuria, and other traits (Aylor et al. 2011; Durrant et al. 2011; Foulds Mathes et al. 2011; Philip et al. 2011; Kelada et al. 2012, 2014; Thaisz et al. 2012; Ferris et al. 2013; Ferguson et al. 2014; Phillippi et al. 2014; Rogala et al. 2014; Rutledge et al. 2014; Vered et al. 2014).
CC mice have also been used by investigators to generate recombinant inbred intercross (RIX) strains to extend the mapping power and utility of the CC. RIX mice are generated from crosses between CC strains so that the offspring are F1 hybrids of the parental CC lines (Zou et al. 2005). These strains have the advantage of generating additional unique genotypes, extending the phenotypic diversity, and supporting studies of epigenetic effects (Threadgill and Churchill 2012). Specialized statistical methods have been developed to analyze this unique population (Gong and Zou 2012). A striking example of the power of CC–RIX strains is illustrated by their markedly different response to infection by a mouse-adapted strain of the Ebola virus, thus providing among the first and best mouse models for studying Ebola infection, and in particular the associated hemorrhagic fever (Rasmussen et al. 2014).
Outbred Stocks (OS)
Outbred Stocks differ from inbred strains in that they are bred to maximize genetic diversity within a closed population (Chia et al. 2005). As opposed to mice derived from an inbred strain, individual mice within an Outbred Stock are not genetically identical. The increased intra-strain genetic diversity is often accompanied with improved health and fertility relative to inbred strains (Linder and Davisson 2004). Of primary importance for mapping complex trait genes is the substantial number of recombination events that occur during the normal course of maintaining Outbred Stocks. The accumulation of recombination events over time markedly decreases linkage disequilibrium relative to inbred strains, which consequently improves mapping resolution (Yalcin and Flint 2012). The downside to nonidentical genotypes within a stock is that each mouse must be genotyped for association studies. However, resources are available to assist with genotyping including the High-Density Mouse Universal Genotyping Array (MegaMUGA) or the upcoming GigaMUGA (Didion et al. 2014). Many Outbred Stocks are available to study complex traits (Yalcin et al. 2010). Among the most commonly used are the Heterogeneous stock (HS) and the Diversity Outbred stock (DO) (Mott et al. 2000; Churchill et al. 2012).
HS mice were derived from an eight-way cross between C57BL, BALB/c, RIII, AKR, DBA/2, I, A, and C3H/2 in the 1980s. The stock has been maintained for more than 60 generations, with an average distance between recombination events <4 Mb (Mott et al. 2000). One of the first demonstrations of the power of OS mice for mapping complex trait genes involved a large study of 1904 HS mice and 298 of their parents (Valdar et al. 2006b). More than 800 QTLs were mapped to an average 95% confidence interval of 2.8 Mb.
The DO mice were derived from random outcrosses among 160 of the completed and incipient CC strains derived from a different eight-way cross (Fig. 1C). These mice are maintained by continued random mating to avoid inbreeding and to retain maximal genetic and phenotypic diversity (Svenson et al. 2012). This mating strategy maintains a high level of heterozygosity, allowing for studies of dominance effects (allele interactions). Generating the DO mice from CC strains further increases the estimated number of recombination events to an average of 390 per mouse (Churchill et al. 2012). DO mice are currently bred at The Jackson Laboratory, and new cohorts of mice are available for shipment approximately three times per year. Analysis of just 200 DO mice is 90% powered to identify a QTL that explains >20% of the phenotypic variance, whereas to obtain 90% power to identify a QTL that explains 5% of the variance would require 1000 mice (Gatti et al. 2014). Mapping a QTL for serum cholesterol levels on mouse Chromosome 3 provides an early example of the utility of the DO panel (Svenson et al. 2012).
Hybrid Mouse Diversity Panel (HMDP)
The HMDP comprises approximately 100 inbred strains, including “classic” inbred strains such as C57BL/6J, SJL/J, NOD/ShiLtJ, and BALB/cJ as well as RI lines from the BXD, CXB, BXA/AXB, and BXH panels (Fig. 1D; Ghazalpour et al. 2012). The number of strains utilized can be selected based on experimental needs with recent studies using 100 strains to investigate behavioral traits (Park et al. 2011), 96 strains to study bone mineral density (Farber et al. 2011), and 114 strains phenotyped for metabolic traits (Ghazalpour et al. 2012). Future plans are to increase the HMDP to 260 total strains to allow for even greater flexibility (Ghazalpour et al. 2012). In contrast to the RI strains developed for the CC and DO resources, wild-derived strains are not included in the panel, thereby reducing somewhat the genetic diversity within the HMDP. However, reduced genetic variation can simplify QTL mapping and gene identification by increasing the relative phenotypic effect of each variant (Ghazalpour et al. 2012). As with the CC and CSSs, but not the OS resources, detailed genotype information is publically available for each strain (Ghazalpour et al. 2012). In addition, all HMDP strains are inbred and therefore represent a renewable resource that is currently available from The Jackson Laboratory. As with the other resources, QTL mapping is based on an association-based approach (Bennett et al. 2010).
The HMDP panel was used as the backbone for an integrative approach combining phenotype and gene expression data to identify Asxl2 as a regulator of bone mineral density and osteoclastogenesis in mice (Farber et al. 2011). Other studies focused on diet-induced obesity, hearing, atherosclerosis, cholesterol, and many other traits (Bennett et al. 2010; Farber et al. 2011; Park et al. 2011; Smolock et al. 2012; Davis et al. 2013; Parks et al. 2013; Ghazalpour et al. 2014; Hartiala et al. 2014; Kang et al. 2014).
Chromosome Substitution Strains (CSSs)
CSSs (also referred to as consomics) carry an entire chromosome from a donor strain on a genetic background that is otherwise completely derived from a host strain (Fig. 1B; Nadeau et al. 2000, 2012). A CSS panel is generated through selective breeding during repeated backcrosses of the donor strain to the host strain while selecting for the desired nonrecombinant chromosome. Because CSS panels are derived from just two inbred strains, they have less allelic diversity relative to the CC, HMDP, and OS. The entire genome is minimally covered with 22 strains, corresponding to 22 statistically independent QTL tests, one for each of the 19 autosomal chromosomes, one each for the X and Y chromosomes, and one for mitochondria. The first completed panel of 22 strains was made for A/J (donor) and C57BL/6J (host) (Singer et al. 2004). A second panel was derived from PWD (donor) and C57BL/6J (host), but consists of 28 strains. Difficulties were encountered with several chromosomes (10, 11, and X) that could not be substituted intact. These chromosomes are included as smaller, subchromosomal segments in several congenic strains (Gregorová et al. 2008). A third panel with 29 strains was derived from MSM (donor) and C57BL/6J (host) that similarly used congenic strains to span Chromosomes 2, 6, 7, 12, 13, and X that were not substituted intact (Takada et al. 2008). Other partial panels are based on the following strain combinations: (donor:host) C57BL/6ByJ:129P3/J, C57BL/6J:129S1/SvImJ, 129P3/J:C57BL/6ByJ, 129S1/SvImJ:C57BL/6J, MOLF/Ei:129S1/SvImJ, C57BL/6J:C3H/HeJ, and NZM2328/NOD among others. These partial panels are available from The Jackson Laboratory as are the complete C57BL/6J.A/J and C57BL/6J.PWD panels (Table 1). The complete C57BL/6J.MSM panel is available from the National Institute of Genetics in Japan (Table 1).
The basis of QTL mapping with CSSs differs greatly from that of the CC, OS, and HDMP resources. For these resources, many loci segregate simultaneously and each genotype–phenotype association is tested for significance across a heterogeneous background. QTL effects may therefore change drastically or disappear altogether depending on the genomic context, impeding their detection while implicitly focusing on QTLs that act in an additive and independent manner, with negligible epistasis. In contrast, CSS analysis focuses on a single chromosome on a defined and uniform genetic background. Thus, QTL effects will tend to remain constant, and therefore easier to detect, within the mapping population. Any phenotypic difference between a CSS and the host strain implicates at least one QTL on the substituted chromosome.
A major limitation of the CSS paradigm is that the number and location of QTLs on the substituted chromosome is uncertain, with further work needed to resolve these issues, sometimes with CSS crosses but more often with CSS-derived congenic strains (Fig. 2; Shao et al. 2010; Yazbek et al. 2011; DeSantis et al. 2013; Kato et al. 2014; Winawer et al. 2014; Zhu and Matin 2014). The CSSs and congenic strains derived from CSSs have been used to map QTLs and identify causal genetic variants for traits such as body weight, glucose homeostasis, anxiety, hearing loss, bone morphology, blood clotting, liver fibrosis, energy expenditure, seizure susceptibility, among others (Singer et al. 2004; Singer 2005; Winawer et al. 2007; Gregorová et al. 2008; Sa et al. 2008; Shao et al. 2008; Boell et al. 2011; DeSantis et al. 2013; Spiezio et al. 2014; Street et al. 2014).
Figure 2.
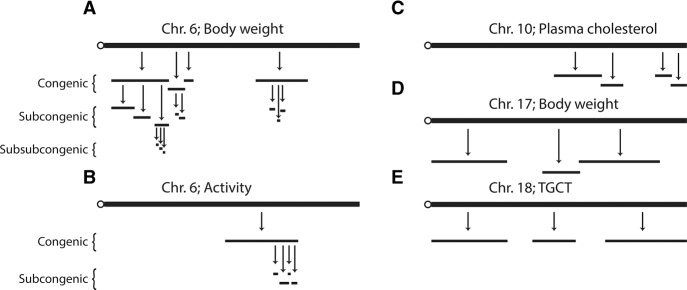
QTL intervals frequently contain multiple sub-QTLs. High-resolution mapping of QTL intervals with CSS, congenic, subcongenic, and subsub-congenic strains identified multiple sub-QTLs within QTLs at each level of genetic resolution. QTLs and sub-QTLs were mapped for body weight (A), activity (B), plasma cholesterol (C), body weight (D), and testicular germ cell tumors (TGCT) (E). QTL intervals are represented by horizontal black lines.
Meta-analysis
To evaluate progress, we reviewed the complete literature for the four resources and found a total of 57 publications, 11 for the CC, 10 for OS, nine for the HMDP, and 27 for CSSs (Table 2; Supplemental Table 1). Each report was evaluated according to the following criteria. First, results were included only for the CC, OS, HMDP, and CSSs, excluding ancillary evidence from backcrosses and intercrosses. Then, all QTLs with statistically significant effects were included, but those with suggestive effects were not, following the authors’ assessment of significance. Expression QTLs (eQTLs) and tests specifically designed to detect epigenetically inherited QTLs were not considered. Finally, each trait was considered independently from all other traits both within and among studies. If a genomic interval showed a significant association with more than one trait, no matter the developmental or physiological relatedness of the traits, each significant association was counted as a single QTL. This final consideration was incorporated because each genomic interval usually carries several genes, leading to ambiguity about genotype–phenotype relations. In addition, objective and standardized rules for consistently consolidating traits into single QTLs are not available.
Table 2.
Summary of QTL mapping studies with OS, HMDP, CC, and CSS
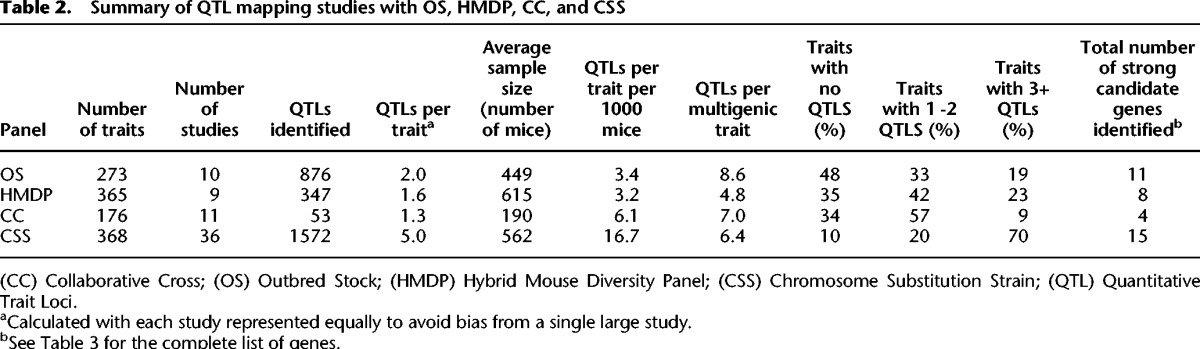
We used several measures to assess the contribution of each resource to complex trait analysis. The first measure counted the number (and percentage) of monomorphic traits (no significant QTLs per trait), monogenic and digenic traits (one or two QTLs per trait), and multigenic traits (three or more QTLs per trait). The second measure was the average number of QTLs per multigenic trait for each of the four resource populations. The third measure was the efficiency of QTL detection as reflected by the number of QTLs mapped relative to the sample size. The third was effect size, although this was not reported in most QTL studies; however, when reported, it was typically measured either as the fraction (%) of the total phenotypic variation (e.g., Durrant et al. 2011; Philip et al. 2011; Kelada et al. 2014) or the fraction (%) of the phenotypic difference between the progenitor strains (e.g., Shao et al. 2008; Spiezio et al. 2012). Finally, we counted the number of QTLs for which compelling evidence is available that the underlying genetic variant has been identified.
Mapped QTLs
Mapping QTLs is usually the first step in complex trait analysis. Because of the unique genetic constitution of CSSs, the same QTL is expected to have substantially higher heritability, and the statistical threshold to claim significant evidence is less stringent relative to other resources (Belknap 2003; Singer et al. 2004). As a result, CSSs can detect weaker and hence more QTLs than other resources given similar sample sizes. A striking example involves results from two recent studies (Logan et al. 2013; Spiezio et al. 2014). One study focused on behavioral traits in DO mice and the other on metabolic traits in CSSs. Similar numbers of traits were analyzed, and comparable sample sizes were used. The Logan et al. study reported a total of seven QTLs across 35 traits (283 mice total), for an average of 0.2 QTLs per trait. In contrast, the Spiezio et al. (2014) study reported 297 QTLs across 35 traits (385 mice total = 191 females + 194 males), for an average of 8.5 QTLs per trait, a value that is similar to other CSS reports (Table 2).
More generally, CSSs consistently revealed the most QTLs (Table 2), with an average of 5.0 QTLs per trait, whereas the CC (1.3 QTLs per trait), OS (2.0 QTLs per trait), and HMDP (1.6 QTLs per trait) reported two- to fourfold fewer. CSSs consistently showed the most multigenic traits (three or more QTLs per trait), with the CC showing 9%, OS 19%, HMDP 23%, and CSSs 70% (Table 2). However, direct comparison is difficult because different sample sizes lead to variable statistical power among the traits and studies (Belknap 1998, 2003; Klein et al. 1998; Singer et al. 2004; Chia et al. 2005; Valdar et al. 2006a; Bennett et al. 2010; Churchill et al. 2012). We therefore normalized the number of QTLs to sample size (number of mice), which also roughly correlates with study cost. Again, CSSs (16.7 QTLs per trait per 1000 mice) detected three- to fivefold more QTLs than other approaches (CC: 6.1; OS: 3.4; HMDP: 3.2 QTLs per trait per 1000 mice).
Although CSSs detect substantially more QTLs than other resources, the size of QTL intervals differs greatly. CSSs map QTLs to an entire chromosome, whereas the other methods provide much higher initial mapping resolution. CSSs should therefore have a great disadvantage for identifying the causal genetic variants. However, this has not been the case, because studies have used CSSs as starting material to quickly make congenic strains that each contain a smaller segment of the substituted chromosome and that can be used to dissect the original QTLs (Youngren et al. 2003; Shao et al. 2010; Babaya et al. 2014; Zhu and Matin 2014). With a CSS, making a congenic strain can take <1 yr and is thus feasible within the training period of a typical graduate student or postdoctoral fellow (Youngren et al. 2003; Hill et al. 2006; Yazbek et al. 2011). This compares favorably with the 2–3 yr to generate congenics or 15–18 mo to generate speed congenics, which also both require more mice and are more costly (Markel et al. 1997).
Phenotyping a panel of congenic strains that together span a QTL interval has consistently revealed additional genetic complexity, with multiple sub-QTLs typically found within the original QTL (Fig. 2). Remarkably, similar numbers of sub-QTLs are identified within QTLs that were entire chromosomes or only several Mb (Youngren et al. 2003; Shao et al. 2008; Millward et al. 2009; Yazbek et al. 2011; Kato et al. 2014; Zhu and Matin 2014). For example, a congenic panel of nine strains for a plasma cholesterol QTL that initially spanned Chromosome 10 found four sub-QTLs (Shao et al. 2008). A congenic panel of seven strains spanning a body weight QTL that spanned Chromosome 17 found three sub-QTLs (Fig. 2C,D; Millward et al. 2009). A panel of 15 congenic strains spanning a body weight QTL spanning Chromosome 6 found four sub-QTLs (Shao et al. 2008). Three of the Chromosome 6 sub-QTLs for body weight were each further dissected with panels totaling 12 subcongenic strains, which collectively identified eight sub-QTLs (Fig. 2A; Yazbek et al. 2011; Buchner et al. 2012). One of these sub-QTLs, which spanned just 3 Mb, was mapped to even higher resolution with a panel of eight subsub-congenic strains, which identified three subsub-QTLs (Yazbek et al. 2011). Thus, the QTLs detected with CSSs as a primary screen are readily augmented with follow-up studies that identify many additional QTLs. The substantial number of QTLs detected with congenic, subcongenic, and subsub-congenic strains suggests that many additional QTLs could be systematically detected by further increasing the number of congenic strains (Shao et al. 2010; Yazbek et al. 2011). Evidence from other species such as yeast, rats, and humans also shows that QTLs harbor multiple tightly linked sub-QTLs and causative genetic variants (Steinmetz et al. 2002; Nejentsev et al. 2007; Lango Allen et al. 2010; Ehret et al. 2012; Flister et al. 2013; Mell et al. 2015).
A strategic and logistical consideration involves the decision to make a few or many congenic strains from a CSS. The answer depends in part on the model of genetic architecture and in part the goals of the study. If the trait model or prior evidence suggests oligogenic control, then a small number of congenic strains may suffice. However, this approach can encounter problems such as lost QTLs (Legare et al. 2000). In addition, the goal may be to simply identify a few genes involved in a particular process, in which case identification of a few QTLs suffices. However, if the control is multigenic or unknown, or if the goal is a full enumeration of the genetic, functional, and systems control, then a large panel of many congenic strains would be a more conservative approach, in which the QTL content of the substituted chromosome can be fully explored, regardless of the underlying genetic complexity (Youngren et al. 2003; Yazbek et al. 2011).
Identified QTLs
Traditional backcrosses or intercrosses can be performed with CSSs for higher resolution mapping, thus allowing for only the segregation of alleles on the substituted chromosome as opposed to throughout the entire genome (Matin et al. 1999; Burrage et al. 2010). This reduces the amount of genetic variation within the cross, allowing for a greater signal from the causal gene(s) on the substituted chromosome. A CSS cross successfully identified an endogenous retrovirus within the SWR/J allele of the noncoding RNA Rubie that causes vestibular malformation in mice (Roberts et al. 2012). However, the Matin et al. and Burrage et al. studies also showed that congenic strains had more power than crosses to locate QTLs, in part because relatively few mice with a recombinant chromosome are detected in these crosses, and boundaries are known with certainty (based on sequence differences) with congenic strains but statistically (95% confidence intervals) with crosses (see also Matin et al. 1999; Youngren et al. 2003). CSSs together with congenic strains have consistently led to successful gene identification, including Cntnap2 in diet-induced obesity and Slc35b4 in gluconeogenesis (Yazbek et al. 2011; Buchner et al. 2012).
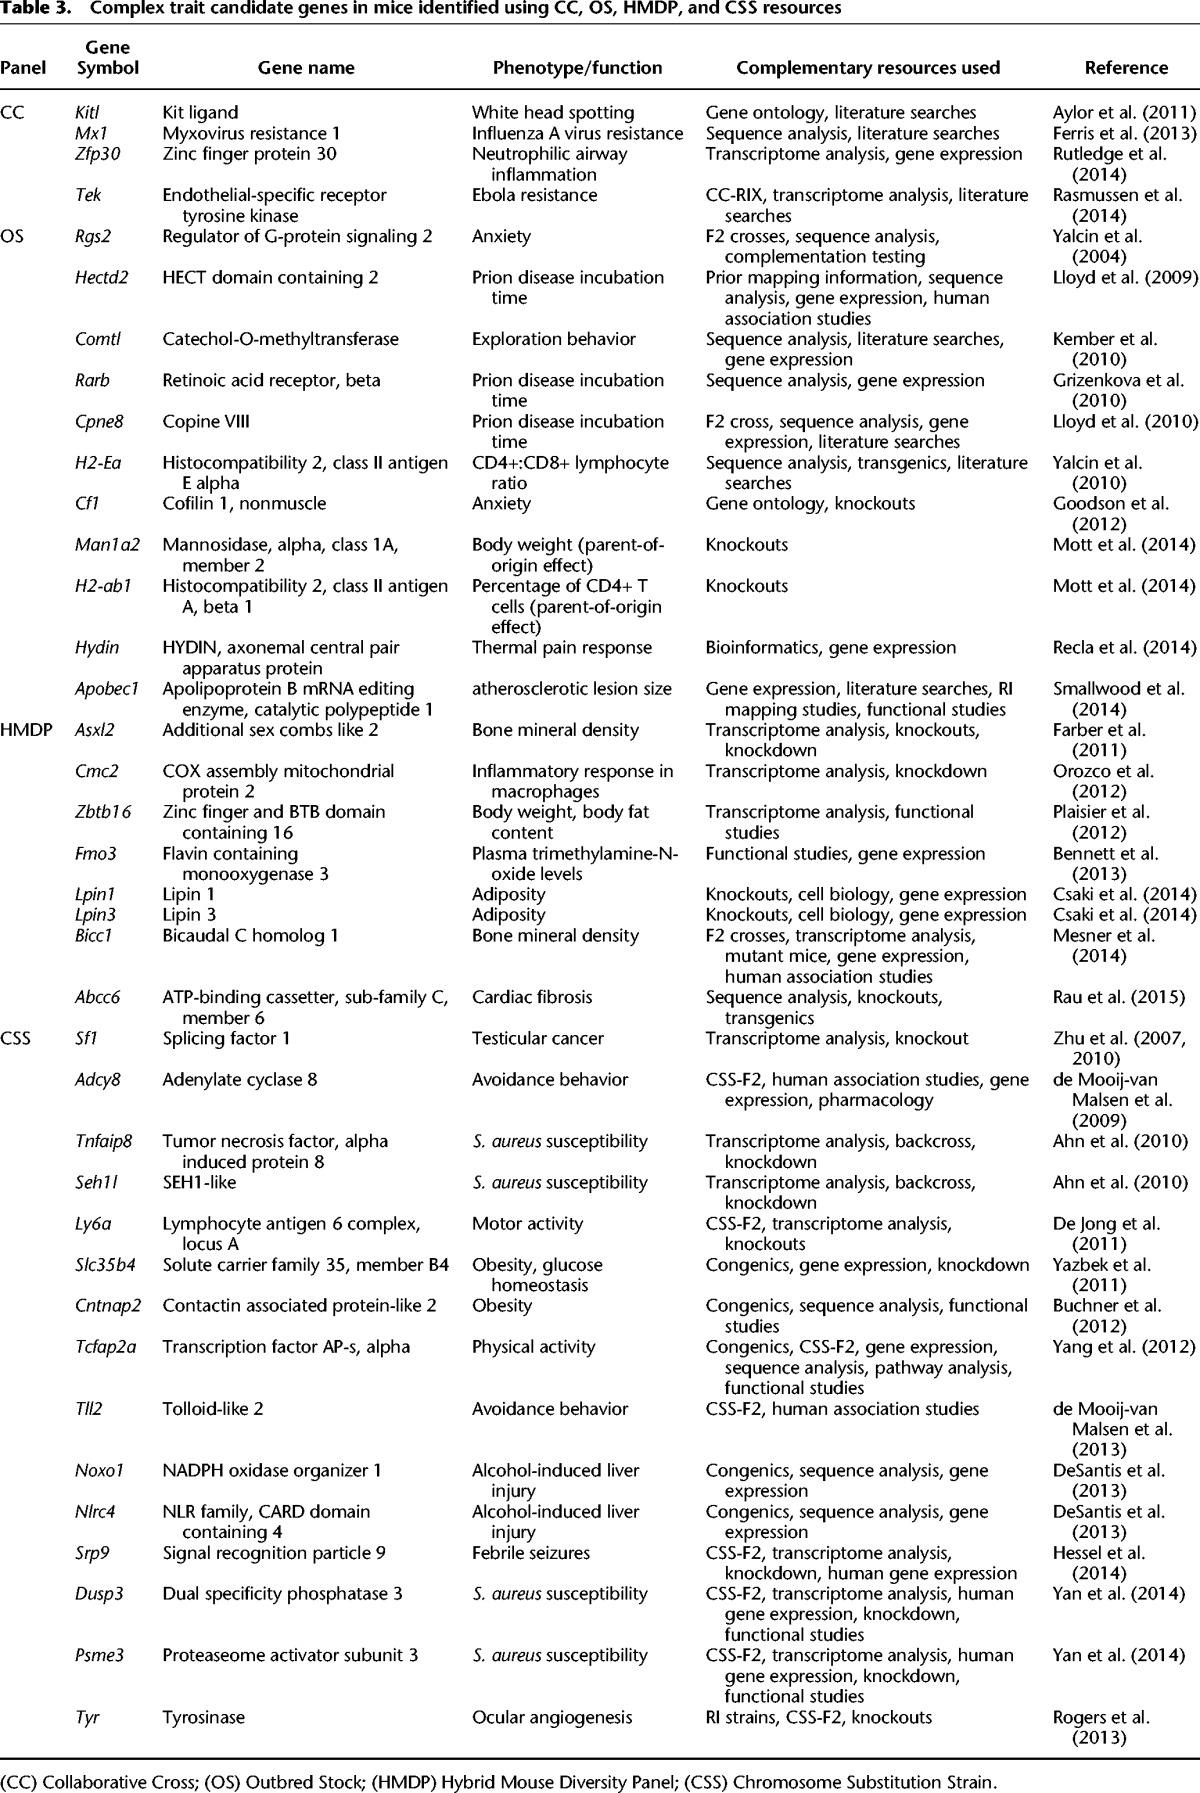
Unlike CSSs, the CC, OS, and HMDP mapping does not isolate the QTL interval of interest on a defined genetic background, and the QTLs are based on confidence intervals rather than known boundaries from congenic strains. However, follow-up studies can be performed that include additional crosses with the phenotypically divergent strains of interest, gene expression profiling, epigenetic surveys, genetic engineering, studies of knockout (KO) mice, and integrative studies. For example, expression profiling in the HMDP was combined with siRNA validation to demonstrate that Cmc2 (2310061C15Rik) regulates the inflammatory response of macrophages (Orozco et al. 2012). Gene expression data generated from the HMDP was similarly combined with expression data from other RI lines and studies of KO mice to identify a role for Bicc1 in determining bone mineral density (Mesner et al. 2014). The CC was used to show that resistance to influenza A virus infection was largely due to variants in Mx1 (Ferris et al. 2013). The CC-RIX mice were used to identify an association between Tek and susceptibility to Ebola infection (Rasmussen et al. 2014). Tek expression was decreased in Ebola susceptible mice relative to Ebola resistant mice and was therefore hypothesized to influence Ebola susceptibility by regulating vascular integrity (Rasmussen et al. 2014). OS mice were used to fine-map a QTL for anxiety that led to the identification that Rgs2 regulates anxiety behavior (Yalcin et al. 2004). Given the difficulty associated with formal proof for a candidate gene, the 38 candidate genes listed in Table 3 represent a partial list of genes associated with complex traits for which there is particularly compelling evidence if not definitive proof.
Table 3.
Complex trait candidate genes in mice identified using CC, OS, HMDP, and CSS resources
In addition to using each of the CSS, CC, OS, and HMDP resources independently, data can be combined for additional power. For example, a meta-analysis combining seven HMDP studies and 10 RI studies identified 26 QTLs for which gene–environment interactions governed HDL cholesterol levels, most of which were not discovered in any of the individual studies (Kang et al. 2014). Additionally, these resources can complement each other when used for follow-up and validation studies, with the important caveat that a failure to validate does not necessarily imply an initial false positive result, but rather may be due to genetic background differences between strains. The C57BL/6J.AJ CSSs were used to validate QTLs for cocaine-induced locomotor activation on mouse Chromosomes 5 and 18 and voluntary alcohol consumption on mouse Chromosomes 2 and 15 that were originally identified in the AXB/BXA RI lines (Boyle and Gill 2008, 2009). Similarly, analysis of 26 RI strains identified a single QTL on mouse Chromosome 10 for a cone photoreceptor number that was then validated in the Chromosome 10 substitution strain derived from C57BL/6J and A/J (Whitney et al. 2011). Kas et al. (2009) used the CSSs to identify a single QTL on mouse Chromosome 1 for motor activity levels. Higher resolution mapping was then performed analyzing F2 offspring from the Chromosome 1 CSS strain as well as integrating existing mapping data from the HS mice. These integrative analyses reduced the QTL interval to a 312 kb interval that contained only one gene, Fam124b (Kas et al. 2009).
Effect sizes
The measures of effect size differ considerably between CSSs and the other resources. In particular, a CSS survey does not provide an estimate of the total phenotypic variation within the study population because each CSS is genetically and phenotypically independent of the other strains in the panel (Belknap 2003; Singer et al. 2004). As a result, variance and effect size can be estimated for each CSS-host strain comparison but not systematically across the panel. In contrast, total phenotypic variation and hence the variance attributable to each QTL is readily measured with conventional methods in other resource populations (Belknap 1998; Valdar et al. 2006b). An alternative measure was therefore developed to assess effect sizes in CSS surveys. Here, the phenotypic difference (in measured units) between the CSS and the host strain is expressed as a fraction (%) of the phenotypic difference between the two CSS progenitor strains (Shao et al. 2008; Spiezio et al. 2012). Although not ideal, this measure provides a reasonable assessment of QTL effects, with the expectation that these effects will usually be small, additive, and elusive.
Effect sizes in CC, OS, and HMDP resources tend to be intermediate between those in humans and in CSSs. GWAS in humans tend to show QTL effects that individually and collectively account for a small fraction of overall phenotypic variation (Lander 2011), with several notable exceptions (Maller et al. 2006; Galarneau et al. 2010; Fritsche et al. 2013). The CC, OS, and HMDP tend to show a somewhat different picture. A QTL study using the DO strains identified seven QTLs that each accounted for 11%–14% of the variance for behavioral tests related to open-field, light-dark box, tail suspension, and a visual cliff (Logan et al. 2013). These effects are considerably larger than those found in humans. However, 85% of the heritability for each trait eluded discovery, a number in line with human studies (Logan et al. 2013). A similar result was found with the CC, including a QTL (Chr 16) for wheel running distance that accounted for 17.0% of the variance, a QTL (Chr 12) for food intake during exercise that accounted for 17.6% of the variance, and a QTL (Chr 4) for body weight that explained 18.6% of the variance (Aylor et al. 2011; Foulds Mathes et al. 2011). Somewhat larger QTL effects, ranging from 10% to 49%, were detected for influenza-associated phenotypes and hematological measures (Kelada et al. 2012; Ferris et al. 2013). The largest effects among these individual QTLs explained 42% of the variance in influenza-associated weight loss and 49% of the variance in mean corpuscular volume (MCV). Each of these QTLs had been previously identified in the CC parental strains as due to mutations in Mx1 (influenza) or Hbb (MCV), respectively (Gilman 1976; Popp et al. 1982; Staeheli et al. 1988). In addition to the effects of Mx1 mutations on weight loss, a phenotypically related QTL was identified that explained 9.7% of the variance, with 49% of the variance not explained by the two QTLs detected. The average effect size reported across studies using the CC (n = 7 studies), the HMDP (n = 1 study), and the OS (n = 3 studies) was 19% (Supplemental Table 1). However, it should be noted that with the exception of the CC, a minority of studies reported effect sizes, and often only the largest effect sizes were reported. Thus, this average value is likely biased upward. Nonetheless, it is clear that QTLs identified for each trait contributed to a larger fraction of the total phenotypic variation compared to most human studies, but collectively these QTL effects did not account for the majority of the phenotypic variation.
The unexplained variation in GWAS and other mouse resources is in striking contrast to results emerging from CSSs and their congenic strains. Perhaps the most unexpected discovery with CSSs is their remarkably large phenotypic effects (Shao et al. 2008; Spiezio et al. 2012). For example, the average QTL effect for plasma sitosterol levels was 79% of the phenotypic difference between the parental strains (n = 12 C57BL/6J.ChrA/J CSSs). The average for each QTL that regulates diet-induced obesity was 75% (n = 16 C57BL/6J.ChrA/J CSSs). Far from being outliers, these two traits were typical of the multigenic traits that have been studied with the C57BL/6J.ChrA/J CSSs that on average each accounted for 76% of the parental effect (Shao et al. 2008). Similar results were found with CSSs whose progenitor strains derived from genetically divergent subspecies, including C57BL/6J.ChrPWD CSSs (153%) and C57BL/6J.ChrMSM CSSs (47%) (Spiezio et al. 2012).
The large effect sizes in CSSs relative to other resources are correlated with larger QTL intervals. Thus, a potential explanation for the larger effects is simply that the CSS QTLs are composites of multiple sub-QTLs with smaller effects. The prediction is that if these sub-QTLs were studied in isolation, their effect sizes would be in line with those observed with other resources. Indeed, as described above, the CSS QTLs do contain multiple sub-QTLs (Table 2). However, a surprising finding was that the effect sizes of the sub-QTLs remained on average larger than those detected with the OS, HMDP, and CC (Yazbek et al. 2011). For example, eight sub-QTLs for body weight within the Obrq1, Obrq2a, and Obrq3 loci on Chromosome 6 averaged 1.9 ± 0.4 Mb in size and accounted for 43 ± 4% of the parental effect (Yazbek et al. 2011; Buchner et al. 2012). For comparison, a body weight QTL on Chromosome 4 identified with the CC, Bwq14, was 7 Mb in size and accounted for 18.6% of the trait variance (Aylor et al. 2011). Eighteen QTLs for body weight were mapped using OS mice; the average QTL interval was 2.3 ± 0.3 Mb and explained 2.0 ± 0.1% of the variance (Valdar et al. 2006b). Therefore, the QTL intervals identified with CSS-derived congenic strains are similar in size to those discovered with OS and CC mice and yet their effect sizes on average are larger.
Collectively, these mouse resources typically did not detect QTLs that explained <1% of trait variation as is typically found in humans. However, the small sample sizes mean that most of the published mouse studies were not adequately powered to detect such small effects. The lone exception was the QTL study involving more than 2000 OS mice that identified many QTLs with effect sizes near 1% (Valdar et al. 2006b). Additionally, a highly nonrandom distribution of trait values was found among the CSSs where no statistically significant QTL was detected (Shao et al. 2008; Spiezio et al. 2012). These studies suggest that QTLs with small, currently nonsignificant effects could be detected with increased sample sizes.
Epistasis
We next reviewed the evidence for epistasis. Combining several substituted chromosomes together in a single CSS has been used to test whether QTLs act in a nonadditive manner. For example, a double CSS, which combined substituted Chromosomes 2 and 6, synergistically increased airway hyperresponsiveness (Ackerman et al. 2005). Another example involves noise-induced hearing loss in CSSs and congenic strains derived from 129S6/SvEvTac and CBA/CaJ (Street et al. 2014). Although QTLs were mapped to Chromosomes 4 and 17 with CSSs, subsequent studies with congenic strains and CSS crosses revealed both inter- and intrachromosomal epistatic interactions that regulated hearing loss.
A particularly instructive example involves a QTL (Obrq3b) that regulates body weight due to variants in the Cntnap2 gene on Chromosome 6 (Buchner et al. 2012). The A/J-derived allele of Obrq3b causes a 15% body weight reduction in mice fed a high-fat diet when on a C57BL/6J background, but it causes a 15% body weight increase when the A/J-derived allele of a second QTL (Obrq2) is also present in the same genetic background. Thus, the action of Obrq3b has opposing effects on body weight as determined by an interaction with a second QTL (Obrq2). In fact, a CSS intercross with the Chromosome 6 substitution strain failed to detect Obrq2 because of its close linkage to Obrq3b, even though Obrq2 showed the strongest QTL effect on Chromosome 6 in congenic strains (Shao et al. 2008; Burrage et al. 2010). This again highlights the inherent difficulty in identifying QTL effects when influenced by unlinked segregating loci as found in the CC, HMDP, and OS, or in CSS crosses. A genetic marker near Cntnap2 would be associated with profoundly different effects on body weight in a segregating cross and would therefore appear to have no consistent effect. For this reason, it is striking that a GWAS study for obesity-related traits in humans identified a SNP (rs4549702) in CNTNAP2 that was associated with increased body weight in an African-American population but decreased body weight in a Hispanic population (Velez Edwards et al. 2012). Had the populations not been stratified, the effect of this SNP may have been overlooked.
A similar example of intrachromosomal interactions involves susceptibility to spontaneous testicular germ cell tumors (TGCTs) in panels of congenic strains derived from 129.ChrMOLF19, the first autosomal CSS made in mice (Matin et al. 1999; Youngren et al. 2003; Zhu and Matin 2014). Multiple QTLs on the substituted chromosome affect TGCT susceptibility, but these act in an additive or epistatic manner, with enhancer or suppressor activity, depending on the combination of host and donor strain alleles on the substituted chromosome. As with the Obrq2-Obrq3 example, QTL effects were highly context-dependent.
Detecting epistasis is limited by the greatly reduced statistical power in systematically testing the multiway interactions between combinations of genetic markers and phenotypes across the genome (Van Steen 2012). Shao et al. (2008) and Spiezio et al. (2012) used a unique method by taking advantage of the limited number of independent CSS tests that are needed for a genome scan. If QTLs act in an additive manner, the sum of their signed phenotypic effects should not exceed 100%, whereas a sum significantly >100% is strong evidence for epistasis. This method of detecting epistasis avoids restricting analyses to pairwise interactions, is independent of the number of interacting QTLs, and avoids the limited statistical power related to testing multiple hypotheses (Balding 2006). In fact, the QTLs detected for 41 multigenic traits surveyed in the C57BL/6J.ChrA/J CSS panel accounted for significantly >100%, with only a single exception (Shao et al. 2008). The average cumulative effect was >800% of the phenotypic difference between the parental strains. For example, nine different CSSs each explained nearly 100% of the parental difference between C57BL/6J and A/J in cholesterol levels. A/J mice have all nine of these chromosomes, yet its cholesterol level is not different from strains with just one of these A/J-derived chromosomes (Shao et al. 2008). Together, these studies suggest that epistasis is both pervasive and strong.
The pervasive nature of epistasis in complex traits is reminiscent of the frequent occurrence of genetic modifiers of Mendelian traits in humans, mice, and many other species (Nadeau 2001, 2003; Kearney 2011; Lehner 2013). However, despite these examples in mice and evidence for oligogenic traits, such as Bardet-Beidel and Hirschprung in humans, finding evidence of epistasis in complex traits and human disease remains challenging (Mackay and Moore 2014). Recent studies of the much simpler phenotype of gene expression levels are now beginning to identify regulatory epistatic interactions in humans (Brown et al. 2014; Hemani et al. 2014). The ubiquitous nature of genetic modifiers is additional evidence that epistasis may be common in humans (Nadeau 2001, 2003).
Epigenetic inheritance
Epigenetic inheritance occurs when phenotypic variation is transmitted across generations in the absence of cosegregating DNA sequence differences. Distinguishing inherited epigenetic changes from conventional genetic variants and environmental factors is usually a substantial challenge. However, three studies utilizing CSSs, congenic strains, or OS mice illustrate the ways that mouse resources discussed can be used for pioneering discoveries about epigenetic inheritance.
CSSs offer control of genetic background and the ability to arrange simple crosses with tests and controls for epigenetic inheritance. An experiment involving CSSs tested whether QTLs on the Y chromosome induced epigenetic inheritance among daughters who do not inherit their father's Y chromosome. The test compared inbred strains and the related CSS-Y, so that the two paternal strains were identical except for the Y chromosome. Their daughters were genetically identical and differed only in the identity of the paternal Y chromosome, which they did not inherit. An extensive panel of traits ranging from plasma triglycerides to bone mineral density and anxiety was examined (Nelson et al. 2010). Of the 63 traits tested, 17 (27%) exhibited transgenerational inheritance. A second experiment involved an obesity-resistant congenic strain derived from C57BL/6J.Chr6A/J that was chosen at random to test whether the QTL effect was mediated by epigenetic changes (Yazbek et al. 2010). Through a series of simple crosses, the QTL was found to exhibit transgenerational epigenetic inheritance for at least three generations, specifically through the paternal germ line (Yazbek et al. 2010). Analysis of 97 traits in the HS mice found evidence for parental effects in 93% of traits surveyed (Mott et al. 2014). Among the 837 previously mapped autosomal QTLs for these traits (Valdar et al. 2006b), 304 showed evidence of parent-of-origin effects at a false discovery rate of 25% (Mott et al. 2014).
In all cases, heritable epigenetic effects were as strong as QTLs with conventional inheritance patterns, suggesting that the contribution of epigenetic effects to human quantitative traits may be greatly underestimated (Nelson et al. 2010; Yazbek et al. 2010; Mott et al. 2014). Thus, a growing body of evidence supports an important role for epigenetics in phenotypic variation and disease (Kilpinen and Dermitzakis 2012; Grossniklaus et al. 2013; Duncan et al. 2014; Heard and Martienssen 2014; Somer and Thummel 2014).
Emerging models of genetic architecture
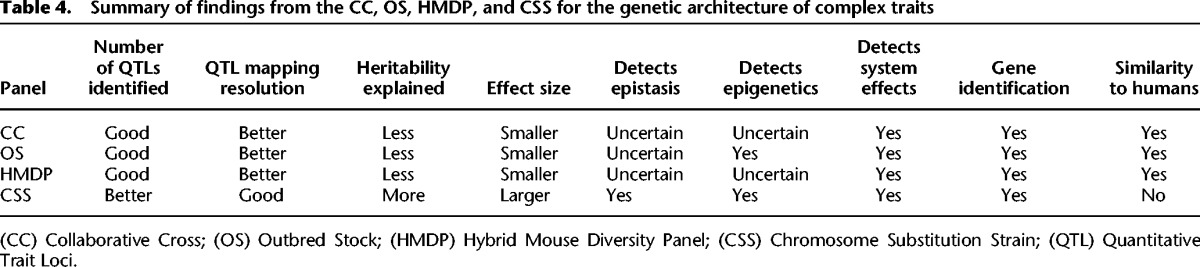
Genetic studies of these mouse resources present contrasting pictures of the genetic architecture of complex traits (Table 4). The CC, OS, and HMDP typically find many genes with small effects that collectively explain only a fraction of the total heritability. This is similar to what most studies of complex traits have found in humans (Visscher et al. 2012). In contrast, CSSs find many more genes, larger effects size, and pervasive epistasis. Collectively, these findings mean that rather than having “missing heritability,” CSS genetics show “excess heritability.” Therefore, key questions are, “Why does the apparent genetic architecture of complex traits depend on the method of study?” and “Can the differences in apparent genetic architecture in different mouse genetic reference populations provide insight into the genetic architecture of common human phenotypes such as height and intelligence, and diseases such as diabetes and Alzheimer's?” We speculate about the biological reasons underpinning the differences between these two models and what the implications are for human genetics. Clearly, more similarities are found between the human GWAS data and the data generated from studies with the CC, DO, and HMDP resources relative to the CSS data as these approaches are left with missing heritability. Perhaps this should not be surprising, because the genetic structure of those mouse populations are considerably more similar to humans than the genetic structure of the CSS panel. Both human and the CC, DO, and HMDP strains have relatively higher levels of genetic diversity with heterogeneous genetic backgrounds. Therefore, QTL effects are estimated across a heterogeneous genetic background with context-dependent effects lost in the average. This is in contrast to the CSSs and congenic strains, which have a relatively limited amount of genetic diversity that is localized to a single genomic locus. CSSs therefore measure QTL effects on a fixed genetic background, generally independent of other QTL effects. For this reason, although the CC, DO, and HMDP appear to better reflect the genetic architecture in genetically heterogeneous human populations, one could argue that this is simply because these resources suffer from the same experimental difficulties that are found in human populations. These difficulties include what is perhaps the most limiting factor for identifying QTLs in a genetically heterogeneous population, namely, the lack of statistical power for detecting epistasis (Zuk et al. 2012). In contrast, the CSSs and congenic strains focus on a single locus at a time, in the context of a single fixed genetic background and independently of other chromosomes from the donor strain. This greatly reduces the enormous number of genetic combinations that are present when thousands of alleles are segregating throughout the genome. Additionally, because the effects of each QTL are independent, their cumulative effects can be summed, and multilocus interactions can be assessed within the combined effects for all variants on a substituted chromosome.
Table 4.
Summary of findings from the CC, OS, HMDP, and CSS for the genetic architecture of complex traits
A similar approach of reducing the genetic variation in human studies by focusing on isolated populations has facilitated the identification of disease genes for complex traits, including a nonsense mutation in TBC1D4 with an allele frequency of 17% in the Greenlandic population that increased the risk of diabetes by tenfold (Moltke et al. 2014). Studies of 132 immune-related traits in a Sardinian population identified 35 traits for which >50% of the variance was explained and four traits for which >80% of the variance was explained. Three SNPs individually accounted for >15% of the variance, with a single SNP within the intron of ENTPD1 (rs11517041) accounting for 61% of the variance in the levels of CD39+ activated CD4+ Tregs (Orrù et al. 2013). These studies suggest that reducing the complexity of the genetic background can facilitate identification of genes with large effects and perhaps epistasis. Whether this is due to reducing the total trait variance or decreasing the number of potentially confounding epistatic interactions remains unclear. Regardless, the amount of heritability detected is increased and the genetic architecture is more closely approximated by the CSSs.
A genetic architecture composed of genes with large phenotypic effects could be encouraging from a therapeutic perspective because it suggests that targeting a single gene identified by GWAS may have a larger effect on phenotype than would be indicated by the human genetics data. The potential benefits from a personalized therapeutic intervention could be masked because effect sizes are measured as population averages, then effects are extrapolated from populations to individuals. However, it is not clear that we know how to accurately extrapolate from a population to the individual that is ultimately the unit of diagnosis and treatment. For example, the SNP rs11591147 encodes an R46L missense mutation in PCSK9 and accounts for 1.2% of the variance in LDL cholesterol levels (Sanna et al. 2011). The PCSK9 variant explained the second highest amount of variance for LDL levels, after only variants in APOE (3.3% of variance). Previous studies of the effect of the R46L allele on LDL cholesterol have shown an 11%–21% reduction in carriers of the 46L allele relative to noncarriers (Kotowski et al. 2006; Benn et al. 2010). When clinical trials were completed with a monoclonal antibody blocking the function of PCSK9, LDL cholesterol levels were consistently decreased by 50%–60% across a variety of populations with elevated LDL cholesterol levels (Dadu and Ballantyne 2014). Whether the remarkably strong effect of the antibody therapy was due to better functional reduction by the antibody or whether the impact of the R46L mutation on LDL levels is underestimated by the variance estimates remains unclear.
Implications of genetic architecture on the validity of mouse models
If the genetic architecture found with CSSs is a general property of complex traits and disease, it would have broad implications for the use of mice in biomedical research. The architecture observed with CSSs resembles that of a fractal, which is a self-similar pattern that repeats itself independently of scale. Fractals are often found in nature including in coastlines, mountains, clouds, and plants (Barnsley et al. 1988). In regard to the fractal nature of the genetic architecture discovered with CSSs, multiple sub- and subsub-QTLs are found within parental QTLs at each level of genetic resolution, with effect sizes that do not scale proportionally to their size or QTL number (Fig. 2). This surprising finding that strong QTLs are found with high frequency but a context-dependent manner throughout the genome has several practical implications for conducting research using mouse models. Phenotypic differences attributed to a specific gene could instead be due to genetic background effects if the background is not rigorously controlled. These types of experimental vagaries differ from the recent calls to improve upon experimental reproducibility in science as the discrepancy is not due to small numbers, experimenter bias, careless phenotyping, statistical fluctuations, or fraud (Macleod 2011; Prinz et al. 2011; Collins and Tabak 2014). Rather, the improper control of genetic background is a fundamental problem in the experimental design that will result in an incorrect interpretation of the data.
Studies of both transgenic and KO mice carry similar risks for misinterpreting data due to such phenotypic artifacts. The most likely possibility is that the host cell (either fertilized egg or ES cell) does not match the genetic background of the mice that will be used to maintain the mouse line by backcrossing. For example, KO mice have historically been made using 129-derived ES cells because of their high success rate for gene targeting and germline transmission (Ledermann 2000). However, the most popular choice of strain for backcrossing has remained C57BL/6J. This has led to the generation of many KO mice that are effectively C57BL/6J in every region of the genome, except for the congenic interval surrounding the targeted mutation, where they carry 129-derived sequence. Depending on the number of backcross generations, the size of this congenic interval is expected to range from 40 Mb (20 cM) after 10 backcross generations to 8 Mb (4 cM) after 50 backcross generations, unless mice carrying closely flanking recombination events are selected during breeding (Silver 1995). This represents a considerable interval that may harbor multiple genetic variants from the 129-derived host cell that strongly influence the respective phenotype of study. Fortunately, recent improvements in genome engineering with zinc finger nucleases, TALENs, and the CRISPR/Cas system have simplified using a single inbred strain for both genetic manipulation and the maintenance of the modified allele in live mice (Gaj et al. 2013). It will be of interest to see how many newly generated mouse models of disease have divergent, and presumably more accurate, phenotypes from previously generated models that suffered from poor control of closely linked genetic background.
Practical considerations for choosing an experimental resource
The typical process for identifying the genetic variants involved in complex traits and diseases involves mapping a QTL(s), followed by candidate gene evaluation. Under certain circumstances, the mapping studies may involve multiple rounds of sequentially higher resolution mapping to reduce the size of the QTL interval to a point at which it becomes practical to evaluate candidate genes. There are a number of considerations for deciding which reference mouse population will best meet the desired study goals. As all resources are currently public resources, it is important to consider these options prior to undertaking a new study (Table 1). Among the most important criteria may be the desired scale and time frame of the project, whether one seeks to identify a few or many QTLs, and whether one is interested in studying interactions among QTLs.
Mapping complex trait genes with CSSs requires the least amount of upfront effort and cost. The entire genome can be tested with CSSs by phenotyping just 22 CSS strains and one control strain. In contrast, the CC and HMDP typically require phenotyping of 50–150 strains, and the OS typically requires hundreds or thousands of mice. The smaller effort associated with using CSSs nonetheless results in the identification of substantially more QTLs (Table 2).
At this point, the amount of effort and cost required for each approach is typically reversed. Initial mapping studies using the CC, HMDP, and OS typically result in a QTL mapping resolution of just a few Mb, whereas a CSS survey results in a mapping resolution of an entire chromosome. Mapping a QTL to within a few Mb may allow researchers to immediately begin evaluating specific candidate genes, in part depending on the number of genes within the QTL interval and whether biologically plausible candidate genes are identified. Mapping a QTL to a chromosome will likely require higher resolution mapping to reach the point at which candidate gene analysis is feasible, either with additional crosses or by generating congenic and subcongenic panels. Analysis of subcongenic panels are most likely to lead to gene identification when the interval they span is just a few Mb (Shao et al. 2008; Millward et al. 2009; Bhatnagar et al. 2011; Yazbek et al. 2011; Buchner et al. 2012). Generating and phenotyping subcongenic panels at this level of resolution requires approximately 1500 mice per panel (Yazbek et al. 2011; Buchner et al. 2012). However, the additional time and expense of studying congenic strains typically reveals additional QTLs beyond those identified in the original screen. The newly developed congenic strains, together with the appropriate controls, also leave the investigator with genetically defined and reproducible resources for subsequent functional studies (Shao et al. 2010; Yazbek et al. 2011). Thus, on average, the CSSs and congenic strains require more time, effort, and cost, but are likely to provide a more complete picture of the genes contributing to a complex trait relative to the CC, HMDP, and OS, including the identification of context-dependent QTLs. However, if an individual laboratory is not prepared to follow up multiple QTL intervals, then candidate genes can be more readily identified with considerably less investment using the CC, HMDP, and OS (Fig. 3).
Figure 3.
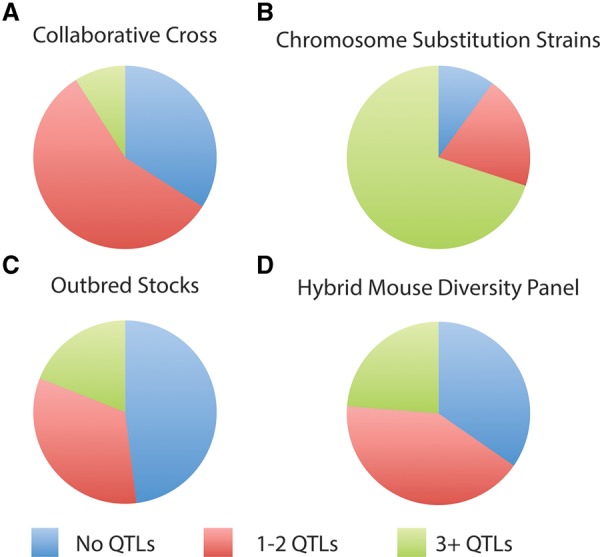
Frequency of monomorphic, monogenic or digenic, and multigenic traits identified with CC (A), CSS (B), OS (C), and the HMDP (D).
The future of large-scale community mouse resources for studying complex traits
The development of disruptive technologies and resources is often a driving factor in research breakthroughs, but these discoveries usually generate many more questions than answers. The same has been true in genetics, as new innovations in genotyping and DNA sequencing have allowed for unprecedented definition of the human genome and its genetic variation. However, much remains to be learned about the architecture of complex traits. Mouse models provide an exceptional opportunity for acquiring such knowledge. The CC, OS, HMDP, and CSS resources have collectively identified new genes and pathways that regulate phenotypic variation and shed light onto the framework genetic architecture of such traits, but we are just beginning to discover what these resources can teach us. A generally neglected aspect of many of these resources is characterizing systems properties, namely, the ways that mRNAs, proteins, and phenotypes covary in networks of functional interactions. By using genetic variants as causal perturbations, inferring functional relationships, network features, and systems properties should be possible to identify with both surveys and experiments in these resources (Nadeau et al. 2003; Civelek and Lusis 2014). Additionally, the molecular changes at each QTL that account for gene–gene interactions, gene–environment interactions, incomplete penetrance, and epigenetic inheritance remain largely mysterious. These resources will continue to be pivotal in exploring the genetic architecture of complex traits with additional studies involving new phenotypic assays, newly derived strains, systems approaches combining physiological and genomic data, and the integration of these data to guide studies in human genetics.
Supplementary Material
Acknowledgments
This work was supported by National Institutes of Health grants DK084079 (D.A.B.), DK099533 (D.A.B.), DP1HD075624 (J.H.N.), CA75056 (J.H.N.), RR12305 (J.H.N.), DA033646 (J. Blendy, M. Bartolomei, and J.H.N.), and AR044927 (K. Jepson and J.H.N.). We thank Li Wang for assistance with generating the figures.
Footnotes
[Supplemental material is available for this article.]
Article published online before print. Article, supplemental material, and publication date are at http://www.genome.org/cgi/doi/10.1101/gr.187450.114.
References
- Ackerman KG, Huang H, Grasemann H, Puma C, Singer JB, Hill AE, Lander E, Nadeau JH, Churchill GA, Drazen JM, et al. 2005. Interacting genetic loci cause airway hyperresponsiveness. Physiol Genomics 21: 105–111. [DOI] [PubMed] [Google Scholar]
- Agarwala V, Flannick J, Sunyaev S, Altshuler D. 2013. Evaluating empirical bounds on complex disease genetic architecture. Nat Genet 45: 1418–1427. [DOI] [PMC free article] [PubMed] [Google Scholar]
- Ahn SH, Deshmukh H, Johnson N, Cowell LG, Rude TH, Scott WK, Nelson CL, Zaas AK, Marchuk DA, Keum S, et al. 2010. Two genes on A/J chromosome 18 are associated with susceptibility to Staphylococcus aureus infection by combined microarray and QTL analyses. PLoS Pathog 6: e1001088. [DOI] [PMC free article] [PubMed] [Google Scholar]
- Alonso-Blanco C, Méndez-Vigo B. 2014. Genetic architecture of naturally occurring quantitative traits in plants: an updated synthesis. Curr Opin Plant Biol 18: 37–43. [DOI] [PubMed] [Google Scholar]
- Alves MM, Sribudiani Y, Brouwer RWW, Amiel J, Antiñolo G, Borrego S, Ceccherini I, Chakravarti A, Fernández RM, Garcia-Barcelo MM, et al. 2013. Contribution of rare and common variants determine complex diseases—Hirschsprung disease as a model. Dev Biol 382: 320–329. [DOI] [PubMed] [Google Scholar]
- Andreux PA, Williams EG, Koutnikova H, Houtkooper RH, Champy MF, Henry H, Schoonjans K, Williams RW, Auwerx J. 2012. Systems genetics of metabolism: the use of the BXD murine reference panel for multiscalar integration of traits. Cell 150: 1287–1299. [DOI] [PMC free article] [PubMed] [Google Scholar]
- Attié T, Pelet A, Edery P, Eng C, Mulligan LM, Amiel J, Boutrand L, Beldjord C, Nihoul-Fékété C, Munnich A, et al. 1995. Diversity of RET proto-oncogene mutations in familial and sporadic Hirschsprung disease. Hum Mol Genet 4: 1381–1386. [DOI] [PubMed] [Google Scholar]
- Aylor DL, Valdar W, Foulds-Mathes W, Buus RJ, Verdugo RA, Baric RS, Ferris MT, Frelinger JA, Heise M, Frieman MB, et al. 2011. Genetic analysis of complex traits in the emerging Collaborative Cross. Genome Res 21: 1213–1222. [DOI] [PMC free article] [PubMed] [Google Scholar]
- Babaya N, Ueda H, Noso S, Hiromine Y, Itoi-Babaya M, Kobayashi M, Fujisawa T, Ikegami H. 2014. Genetic dissection of susceptibility genes for diabetes and related phenotypes on mouse chromosome 14 by means of congenic strains. BMC Genet 15: 93. [DOI] [PMC free article] [PubMed] [Google Scholar]
- Badano JL. 2003. Heterozygous mutations in BBS1, BBS2 and BBS6 have a potential epistatic effect on Bardet-Biedl patients with two mutations at a second BBS locus. Hum Mol Genet 12: 1651–1659. [DOI] [PubMed] [Google Scholar]
- Badano JL, Leitch CC, Ansley SJ, May-Simera H, Lawson S, Lewis RA, Beales PL, Dietz HC, Fisher S, Katsanis N. 2006. Dissection of epistasis in oligogenic Bardet-Biedl syndrome. Nature 439: 326–330. [DOI] [PubMed] [Google Scholar]
- Bailey DW. 1971. Recombinant-inbred strains. An aid to finding identity, linkage, and function of histocompatibility and other genes. Transplantation 11: 325–327. [DOI] [PubMed] [Google Scholar]
- Balding DJ. 2006. A tutorial on statistical methods for population association studies. Nat Rev Genet 7: 781–791. [DOI] [PubMed] [Google Scholar]
- Barnsley MF, Devaney RL, Mandelbrot BB, Peitgen HO, Saupe D, Voss RF. 1988. The science of fractal images. Springer, New York. [Google Scholar]
- Beales PL, Badano JL, Ross AJ, Ansley SJ, Hoskins BE, Kirsten B, Mein CA, Froguel P, Scambler PJ, Lewis RA, et al. 2003. Genetic interaction of BBS1 mutations with alleles at other BBS loci can result in non-Mendelian Bardet-Biedl syndrome. Am J Hum Genet 72: 1187–1199. [DOI] [PMC free article] [PubMed] [Google Scholar]
- Beck JA, Lloyd S, Hafezparast M, Lennon-Pierce M, Eppig JT, Festing MF, Fisher EM. 2000. Genealogies of mouse inbred strains. Nat Genet 24: 23–25. [DOI] [PubMed] [Google Scholar]
- Belknap JK. 1998. Effect of within-strain sample size on QTL detection and mapping using recombinant inbred mouse strains. Behav Genet 28: 29–38. [DOI] [PubMed] [Google Scholar]
- Belknap JK. 2003. Chromosome substitution strains: some quantitative considerations for genome scans and fine mapping. Mamm Genome 14: 723–732. [DOI] [PubMed] [Google Scholar]
- Belknap JK, Crabbe JC, Young ER. 1993. Voluntary consumption of ethanol in 15 inbred mouse strains. Psychopharmacology 112: 503–510. [DOI] [PubMed] [Google Scholar]
- Benn M, Nordestgaard BG, Grande P, Schnohr P, Tybjærg-Hansen A. 2010. PCSK9 R46L, low-density lipoprotein cholesterol levels, and risk of ischemic heart disease. J Am Coll Cardiol 55: 2833–2842. [DOI] [PubMed] [Google Scholar]
- Bennett BJ, Farber CR, Orozco L, Min Kang H, Ghazalpour A, Siemers N, Neubauer M, Neuhaus I, Yordanova R, Guan B, et al. 2010. A high-resolution association mapping panel for the dissection of complex traits in mice. Genome Res 20: 281–290. [DOI] [PMC free article] [PubMed] [Google Scholar]
- Bennett BJ, de Aguiar Vallim TQ, Wang Z, Shih DM, Meng Y, Gregory J, Allayee H, Lee R, Graham M, Crooke R, et al. 2013. Trimethylamine-N-oxide, a metabolite associated with atherosclerosis, exhibits complex genetic and dietary regulation. Cell Metab 17: 49–60. [DOI] [PMC free article] [PubMed] [Google Scholar]
- Bhatnagar S, Oler AT, Rabaglia ME, Stapleton DS, Schueler KL, Truchan NA, Worzella SL, Stoehr JP, Clee SM, Yandell BS, et al. 2011. Positional cloning of a type 2 diabetes quantitative trait locus; tomosyn-2, a negative regulator of insulin secretion. PLoS Genet 7: e1002323. [DOI] [PMC free article] [PubMed] [Google Scholar]
- Black BL, Croom J, Eisen EJ, Petro AE, Edwards CL, Surwit RS. 1998. Differential effects of fat and sucrose on body composition in A/J and C57BL/6 mice. Metabolism 47: 1354–1359. [DOI] [PubMed] [Google Scholar]
- Bloom JS, Ehrenreich IM, Loo WT, Lite TL, Kruglyak L. 2013. Finding the sources of missing heritability in a yeast cross. Nature 494: 234–237. [DOI] [PMC free article] [PubMed] [Google Scholar]
- Boell L, Gregorova S, Forejt J, Tautz D. 2011. A comparative assessment of mandible shape in a consomic strain panel of the house mouse (Mus musculus)—implications for epistasis and evolvability of quantitative traits. BMC Evol Biol 11: 309. [DOI] [PMC free article] [PubMed] [Google Scholar]
- Boyle AE, Gill KJ. 2008. Confirmation of provisional quantitative trait loci for voluntary alcohol consumption: genetic analysis in chromosome substitution strains and F2 crosses derived from A/J and C57BL/6J progenitors. Pharmacogenet Genomics 18: 1071–1082. [DOI] [PubMed] [Google Scholar]
- Boyle AE, Gill KJ. 2009. Genetic analysis of the psychostimulant effects of nicotine in chromosome substitution strains and F2 crosses derived from A/J and C57BL/6J progenitors. Mamm Genome 20: 34–42. [DOI] [PubMed] [Google Scholar]
- Bradley A, Anastassiadis K, Ayadi A, Battey JF, Bell C, Birling MC, Bottomley J, Brown SD, Bürger A, Bult CJ, et al. 2012. The mammalian gene function resource: the International Knockout Mouse Consortium. Mamm Genome 23: 580–586. [DOI] [PMC free article] [PubMed] [Google Scholar]
- Brown SDM, Moore MW. 2012. The International Mouse Phenotyping Consortium: past and future perspectives on mouse phenotyping. Mamm Genome 23: 632–640. [DOI] [PMC free article] [PubMed] [Google Scholar]
- Brown AA, Buil A, Viñuela A, Lappalainen T, Zheng HF, Richards JB, Small KS, Spector TD, Dermitzakis ET, Durbin R. 2014. Genetic interactions affecting human gene expression identified by variance association mapping. Elife 3: e01381. [DOI] [PMC free article] [PubMed] [Google Scholar]
- Buchner DA, Trudeau M, Meisler MH. 2003. SCNM1, a putative RNA splicing factor that modifies disease severity in mice. Science 301: 967–969. [DOI] [PubMed] [Google Scholar]
- Buchner DA, Geisinger JM, Glazebrook PA, Morgan MG, Spiezio SH, Kaiyala KJ, Schwartz MW, Sakurai T, Furley AJ, Kunze DL, et al. 2012. The juxtaparanodal proteins CNTNAP2 and TAG1 regulate diet-induced obesity. Mamm Genome 23: 431–442. [DOI] [PMC free article] [PubMed] [Google Scholar]
- Burrage L, Baskin-Hill A, Sinasac D, Singer J, Croniger C, Kirby A, Kulbokas E, Daly M, Lander E, Broman K, et al. 2010. Genetic resistance to diet-induced obesity in chromosome substitution strains of mice. Mamm Genome 21: 115–129. [DOI] [PMC free article] [PubMed] [Google Scholar]
- Bystrykh L, Weersing E, Dontje B, Sutton S, Pletcher MT, Wiltshire T, Su AI, Vellenga E, Wang J, Manly KF, et al. 2005. Uncovering regulatory pathways that affect hematopoietic stem cell function using ‘genetical genomics.’ Nat Genet 37: 225–232. [DOI] [PubMed] [Google Scholar]
- Chakravarti A, Clark AG, Mootha VK. 2013. Distilling pathophysiology from complex disease genetics. Cell 155: 21–26. [DOI] [PMC free article] [PubMed] [Google Scholar]
- Chen WH, Zhao XM, van Noort V, Bork P. 2013. Human monogenic disease genes have frequently functionally redundant paralogs. PLoS Comput Biol 9: e1003073. [DOI] [PMC free article] [PubMed] [Google Scholar]
- Chia R, Achilli F, Festing MFW, Fisher EMC. 2005. The origins and uses of mouse outbred stocks. Nat Genet 37: 1181–1186. [DOI] [PubMed] [Google Scholar]
- Churchill GA, Airey DC, Allayee H, Angel JM, Attie AD, Beatty J, Beavis WD, Belknap JK, Bennett B, Berrettini W, et al. 2004. The Collaborative Cross, a community resource for the genetic analysis of complex traits. Nat Genet 36: 1133–1137. [DOI] [PubMed] [Google Scholar]
- Churchill GA, Gatti DM, Munger SC, Svenson KL. 2012. The diversity outbred mouse population. Mamm Genome 23: 713–718. [DOI] [PMC free article] [PubMed] [Google Scholar]
- Civelek M, Lusis AJ. 2014. Systems genetics approaches to understand complex traits. Nat Rev Genet 15: 34–48. [DOI] [PMC free article] [PubMed] [Google Scholar]
- Collins FS, Tabak LA. 2014. Policy: NIH plans to enhance reproducibility. Nature 505: 612–613. [DOI] [PMC free article] [PubMed] [Google Scholar]
- Cornelis MC, Agrawal A, Cole JW, Hansel NN, Barnes KC, Beaty TH, Bennett SN, Bierut LJ, Boerwinkle E, Doheny KF, et al. 2010. The Gene, Environment Association Studies consortium (GENEVA): maximizing the knowledge obtained from GWAS by collaboration across studies of multiple conditions. Genet Epidemiol 34: 364–372. [DOI] [PMC free article] [PubMed] [Google Scholar]
- Csaki LS, Dwyer JR, Li X, Nguyen MHK, Dewald J, Brindley DN, Lusis AJ, Yoshinaga Y, de Jong P, Fong L, et al. 2014. Lipin-1 and lipin-3 together determine adiposity in vivo. Mol Metab 3: 145–154. [DOI] [PMC free article] [PubMed] [Google Scholar]
- Dadu RT, Ballantyne CM. 2014. Lipid lowering with PCSK9 inhibitors. Nat Rev Cardiol 11: 563–575. [DOI] [PubMed] [Google Scholar]
- Davis RC, Nas A, Bennett B, Orozco L, Pan C, Rau CD, Eskin E, Lusis AJ. 2013. Genome-wide association mapping of blood cell traits in mice. Mamm Genome 24: 105–118. [DOI] [PMC free article] [PubMed] [Google Scholar]
- De Jong S, Kas MJH, Kiernan J, de Mooij-van Malsen AG, Oppelaar H, Janson E, Vukobradovic I, Farber CR, Stanford WL, Ophoff RA. 2011. Hippocampal gene expression analysis highlights Ly6a/Sca-1 as candidate gene for previously mapped novelty induced behaviors in mice. PLoS One 6: e20716. [DOI] [PMC free article] [PubMed] [Google Scholar]
- De Mooij-van Malsen AJ, van Lith HA, Oppelaar H, Hendriks J, de Wit M, Kostrzewa E, Breen G, Collier DA, Olivier B, Kas MJ. 2009. Interspecies trait genetics reveals association of Adcy8 with mouse avoidance behavior and a human mood disorder. Biol Psychiatry 66: 1123–1130. [DOI] [PubMed] [Google Scholar]
- De Mooij-van Malsen JG, van Lith HA, Laarakker MC, Brandys MK, Oppelaar H, Collier DA, Olivier B, Breen G, Kas MJ. 2013. Cross-species genetics converge to TLL2 for mouse avoidance behavior and human bipolar disorder: additional mouse avoidance QTL linked to bipolar disorder. Genes Brain Behav 12: 653–657. [DOI] [PubMed] [Google Scholar]
- DeSantis DA, Lee P, Doerner SK, Ko CW, Kawasoe JH, Hill-Baskin AE, Ernest SR, Bhargava P, Hur KY, Cresci GA, et al. 2013. Genetic resistance to liver fibrosis on A/J mouse chromosome 17. Alcohol Clin Exp Res 37: 1668–1679. [DOI] [PMC free article] [PubMed] [Google Scholar]
- Didion JP, Buus RJ, Naghashfar Z, Threadgill DW, Morse HC III, de Villena FP. 2014. SNP array profiling of mouse cell lines identifies their strains of origin and reveals cross-contamination and widespread aneuploidy. BMC Genomics 15: 847. [DOI] [PMC free article] [PubMed] [Google Scholar]
- Drinkwater NR, Gould MN. 2012. The long path from QTL to gene. PLoS Genet 8: e1002975. [DOI] [PMC free article] [PubMed] [Google Scholar]
- Duncan EJ, Gluckman PD, Dearden PK. 2014. Epigenetics, plasticity, and evolution: how do we link epigenetic change to phenotype? J Exp Zool B Mol Dev Evol 322: 208–220. [DOI] [PubMed] [Google Scholar]
- Durrant C, Tayem H, Yalcin B, Cleak J, Goodstadt L, de Villena FP, Mott R, Iraqi FA. 2011. Collaborative Cross mice and their power to map host susceptibility to Aspergillus fumigatus infection. Genome Res 21: 1239–1248. [DOI] [PMC free article] [PubMed] [Google Scholar]
- Ehret GB, Munroe PB, Rice KM, Bochud M, Johnson AD, Chasman DI, Smith AV, Tobin MD, Verwoert GC, Hwang SJ, et al. 2011. Genetic variants in novel pathways influence blood pressure and cardiovascular disease risk. Nature 478: 103–109. [DOI] [PMC free article] [PubMed] [Google Scholar]
- Ehret GB, Lamparter D, Hoggart CJ, Genetic Investigation of Anthropometric Traits Consortium, Whittaker JC, Beckmann JS, Kutalik Z. 2012. A multi-SNP locus-association method reveals a substantial fraction of the missing heritability. Am J Hum Genet 91: 863–871. [DOI] [PMC free article] [PubMed] [Google Scholar]
- Eichler EE, Flint J, Gibson G, Kong A, Leal SM, Moore JH, Nadeau JH. 2010. Missing heritability and strategies for finding the underlying causes of complex disease. Nat Rev Genet 11: 446–450. [DOI] [PMC free article] [PubMed] [Google Scholar]
- Farber CR, Bennett BJ, Orozco L, Zou W, Lira A, Kostem E, Kang HM, Furlotte N, Berberyan A, Ghazalpour A, et al. 2011. Mouse genome-wide association and systems genetics identify Asxl2 as a regulator of bone mineral density and osteoclastogenesis. PLoS Genet 7: e1002038. [DOI] [PMC free article] [PubMed] [Google Scholar]
- Ferguson B, Ram R, Handoko HY, Mukhopadhyay P, Muller HK, Soyer HP, Morahan G, Walker GJ. 2014. Melanoma susceptibility as a complex trait: genetic variation controls all stages of tumor progression. Oncogene 10.1038/onc.2014.227. [DOI] [PubMed] [Google Scholar]
- Ferris MT, Aylor DL, Bottomly D, Whitmore AC, Aicher LD, Bell TA, Bradel-Tretheway B, Bryan JT, Buus RJ, Gralinski LE, et al. 2013. Modeling host genetic regulation of influenza pathogenesis in the collaborative cross. PLoS Pathog 9: e1003196. [DOI] [PMC free article] [PubMed] [Google Scholar]
- Flint J, Valdar W, Shifman S, Mott R. 2005. Strategies for mapping and cloning quantitative trait genes in rodents. Nat Rev Genet 6: 271–286. [DOI] [PubMed] [Google Scholar]
- Flister MJ, Tsaih SW, O'Meara CC, Endres B, Hoffman MJ, Geurts AM, Dwinell MR, Lazar J, Jacob HJ, Moreno C. 2013. Identifying multiple causative genes at a single GWAS locus. Genome Res 23: 1996–2002. [DOI] [PMC free article] [PubMed] [Google Scholar]
- Floyd JA, Gold DA, Concepcion D, Poon TH, Wang X, Keithley E, Chen D, Ward EJ, Chinn SB, Friedman RA, et al. 2003. A natural allele of Nxf1 suppresses retrovirus insertional mutations. Nat Genet 35: 221–228. [DOI] [PMC free article] [PubMed] [Google Scholar]
- Forsythe E, Beales PL. 2013. Bardet-Biedl syndrome. Eur J Hum Genet 21: 8–13. [DOI] [PMC free article] [PubMed] [Google Scholar]
- Foulds Mathes W, Aylor DL, Miller DR, Churchill GA, Chesler EJ, de Villena FP, Threadgill DW, Pomp D. 2011. Architecture of energy balance traits in emerging lines of the Collaborative Cross. Am J Physiol Endocrinol Metab 300: E1124–E1134. [DOI] [PMC free article] [PubMed] [Google Scholar]
- Fritsche LG, Chen W, Schu M, Yaspan BL, Yu Y, Thorleifsson G, Zack DJ, Arakawa S, Cipriani V, Ripke S, et al. 2013. Seven new loci associated with age-related macular degeneration. Nat Genet 45: 433–439. [DOI] [PMC free article] [PubMed] [Google Scholar]
- Gabriel SB, Salomon R, Pelet A, Angrist M, Amiel J, Fornage M, Attié-Bitach T, Olson JM, Hofstra R, Buys C, et al. 2002. Segregation at three loci explains familial and population risk in Hirschsprung disease. Nat Genet 31: 89–93. [DOI] [PubMed] [Google Scholar]
- Gaj T, Gersbach CA, Barbas CF III. 2013. ZFN, TALEN, and CRISPR/Cas-based methods for genome engineering. Trends Biotechnol 31: 397–405. [DOI] [PMC free article] [PubMed] [Google Scholar]
- Galarneau G, Palmer CD, Sankaran VG, Orkin SH, Hirschhorn JN, Lettre G. 2010. Fine-mapping at three loci known to affect fetal hemoglobin levels explains additional genetic variation. Nat Genet 42: 1049–1051. [DOI] [PMC free article] [PubMed] [Google Scholar]
- Garcia-Barcelo MM, Tang CS, Ngan ES, Lui VC, Chen Y, So MT, Leon TYY, Miao XP, Shum CK, Liu FQ, et al. 2009. Genome-wide association study identifies NRG1 as a susceptibility locus for Hirschsprung's disease. Proc Natl Acad Sci 106: 2694–2699. [DOI] [PMC free article] [PubMed] [Google Scholar]
- Gatti DM, Svenson KL, Shabalin A, Wu LY, Valdar W, Simecek P, Goodwin N, Cheng R, Pomp D, Palmer A, et al. 2014. Quantitative trait locus mapping methods for diversity outbred mice. G3 (Bethesda) 4: 1623–1633. [DOI] [PMC free article] [PubMed] [Google Scholar]
- Ghazalpour A, Rau CD, Farber CR, Bennett BJ, Orozco LD, Nas A, Pan C, Allayee H, Beaven SW, Civelek M, et al. 2012. Hybrid mouse diversity panel: a panel of inbred mouse strains suitable for analysis of complex genetic traits. Mamm Genome 23: 680–692. [DOI] [PMC free article] [PubMed] [Google Scholar]
- Ghazalpour A, Bennett BJ, Shih D, Che N, Orozco L, Pan C, Hagopian R, He A, Kayne P, Yang WP, et al. 2014. Genetic regulation of mouse liver metabolite levels. Mol Syst Biol 10: 730–730. [DOI] [PMC free article] [PubMed] [Google Scholar]
- Gilman JG. 1976. Mouse haemoglobin β chains. Comparative sequence data on adult major and minor β chains from two species, Mus musculus and Mus cervicolor. Biochem J 159: 43–53. [DOI] [PMC free article] [PubMed] [Google Scholar]
- Ginsburg D. 2011. Genetics and genomics to the clinic: a long road ahead. Cell 147: 17–19. [DOI] [PubMed] [Google Scholar]
- Glazier AM, Nadeau JH, Aitman TJ. 2002. Finding genes that underlie complex traits. Science 298: 2345–2349. [DOI] [PubMed] [Google Scholar]
- Gong Y, Zou F. 2012. Varying coefficient models for mapping quantitative trait loci using recombinant inbred intercrosses. Genetics 190: 475–486. [DOI] [PMC free article] [PubMed] [Google Scholar]
- Goodson M, Rust MB, Witke W, Bannerman D, Mott R, Ponting CP, Flint J. 2012. Cofilin-1: a modulator of anxiety in mice. PLoS Genet 8: e1002970. [DOI] [PMC free article] [PubMed] [Google Scholar]
- Gregorová S, Divina P, Storchova R, Trachtulec Z, Fotopulosova V, Svenson KL, Donahue LR, Paigen B, Forejt J. 2008. Mouse consomic strains: exploiting genetic divergence between Mus m. musculus and Mus m. domesticus subspecies. Genome Res 18: 509–515. [DOI] [PMC free article] [PubMed] [Google Scholar]
- Grizenkova J, Akhtar S, Collinge J, Lloyd SE. 2010. The retinoic acid receptor β (Rarb) region of Mmu14 is associated with prion disease incubation time in mouse. PLoS One 5: e15019. [DOI] [PMC free article] [PubMed] [Google Scholar]
- Grossniklaus U, Kelly B, Ferguson-Smith AC, Pembrey M, Lindquist S. 2013. Transgenerational epigenetic inheritance: how important is it? Nat Rev Genet 14: 228–235. [DOI] [PMC free article] [PubMed] [Google Scholar]
- Grubb SC, Bult CJ, Bogue MA. 2014. Mouse phenome database. Nucleic Acids Res 42: D825–D834. [DOI] [PMC free article] [PubMed] [Google Scholar]
- Hartiala J, Bennett BJ, Tang WH, Wang Z, Stewart AFR, Roberts R, McPherson R, Lusis AJ, Hazen SL; CARDIoGRAM Consortium, et al. 2014. Comparative genome-wide association studies in mice and humans for trimethylamine N-oxide, a proatherogenic metabolite of choline and L-carnitine. Arterioscler Thromb Vasc Biol 34: 1307–1313. [DOI] [PMC free article] [PubMed] [Google Scholar]
- Heard E, Martienssen RA. 2014. Transgenerational epigenetic inheritance: myths and mechanisms. Cell 157: 95–109. [DOI] [PMC free article] [PubMed] [Google Scholar]
- Hemani G, Shakhbazov K, Westra HJ, Esko T, Henders AK, McRae AF, Yang J, Gibson G, Martin NG, Metspalu A, et al. 2014. Detection and replication of epistasis influencing transcription in humans. Nature 508: 249–253. [DOI] [PMC free article] [PubMed] [Google Scholar] [Retracted]
- Hessel EVS, de Wit M, Wolterink-Donselaar IG, Karst H, de Graaff E, van Lith HA, de Bruijn E, de Sonnaville S, Verbeek NE, Lindhout D, et al. 2014. Identification of Srp9 as a febrile seizure susceptibility gene. Ann Clin Transl Neurol 1: 239–250. [DOI] [PMC free article] [PubMed] [Google Scholar]
- Hill AE, Lander ES, Nadeau JH. 2006. Chromosome substitution strains: a new way to study genetically complex traits. Methods Mol Med 128: 153–172. [DOI] [PubMed] [Google Scholar]
- Houtkooper RH, Mouchiroud L, Ryu D, Moullan N, Katsyuba E, Knott G, Williams RW, Auwerx J. 2013. Mitonuclear protein imbalance as a conserved longevity mechanism. Nature 497: 451–457. [DOI] [PMC free article] [PubMed] [Google Scholar]
- Huang W, Richards S, Carbone MA, Zhu D, Anholt RRH, Ayroles JF, Duncan L, Jordan KW, Lawrence F, Magwire MM, et al. 2012. Epistasis dominates the genetic architecture of Drosophila quantitative traits. Proc Natl Acad Sci 109: 15553–15559. [DOI] [PMC free article] [PubMed] [Google Scholar]
- Ikeda A, Zheng QY, Zuberi AR, Johnson KR, Naggert JK, Nishina PM. 2002. Microtubule-associated protein 1A is a modifier of tubby hearing (moth1). Nat Genet 30: 401–405. [DOI] [PMC free article] [PubMed] [Google Scholar]
- Ingvarsson PK, Street NR. 2011. Association genetics of complex traits in plants. New Phytol 189: 909–922. [DOI] [PubMed] [Google Scholar]
- Justice MJ, Jenkins NA, Copeland NG. 1992. Recombinant inbred mouse strains: models for disease study. Trends Biotechnol 10: 120–126. [DOI] [PubMed] [Google Scholar]
- Kang EY, Han B, Furlotte N, Joo JW, Shih D, Davis RC, Lusis AJ, Eskin E. 2014. Meta-analysis identifies gene-by-environment interactions as demonstrated in a study of 4,965 mice. PLoS Genet 10: e1004022. [DOI] [PMC free article] [PubMed] [Google Scholar]
- Kas MJ, de Mooij-van Malsen JG, de Krom M, van Gassen KL, van Lith HA, Olivier B, Oppelaar H, Hendriks J, de Wit M, Groot Koerkamp MJ, et al. 2009. High-resolution genetic mapping of mammalian motor activity levels in mice. Genes Brain Behav 8: 13–22. [DOI] [PubMed] [Google Scholar]
- Kato S, Ishii A, Nishi A, Kuriki S, Koide T. 2014. Segregation of a QTL cluster for home-cage activity using a new mapping method based on regression analysis of congenic mouse strains. Heredity 113: 416–423. [DOI] [PMC free article] [PubMed] [Google Scholar]
- Katsanis N, Beales PL, Woods MO, Lewis RA, Green JS, Parfrey PS, Ansley SJ, Davidson WS, Lupski JR. 2000. Mutations in MKKS cause obesity, retinal dystrophy and renal malformations associated with Bardet-Biedl syndrome. Nat Genet 26: 67–70. [DOI] [PubMed] [Google Scholar]
- Katsanis N, Ansley SJ, Badano JL, Eichers ER, Lewis RA, Hoskins BE, Scambler PJ, Davidson WS, Beales PL, Lupski JR. 2001. Triallelic inheritance in Bardet-Biedl syndrome, a Mendelian recessive disorder. Science 293: 2256–2259. [DOI] [PubMed] [Google Scholar]
- Katsanis N, Eichers ER, Ansley SJ, Lewis RA, Kayserili H, Hoskins BE, Scambler PJ, Beales PL, Lupski JR. 2002. BBS4 is a minor contributor to Bardet-Biedl syndrome and may also participate in triallelic inheritance. Am J Hum Genet 71: 22–29. [DOI] [PMC free article] [PubMed] [Google Scholar]
- Keane TM, Goodstadt L, Danecek P, White MA, Wong K, Yalcin B, Heger A, Agam A, Slater G, Goodson M, et al. 2011. Mouse genomic variation and its effect on phenotypes and gene regulation. Nature 477: 289–294. [DOI] [PMC free article] [PubMed] [Google Scholar]
- Kearney JA. 2011. Genetic modifiers of neurological disease. Curr Opin Genet Dev 21: 349–353. [DOI] [PMC free article] [PubMed] [Google Scholar]
- Kelada SN, Aylor DL, Peck BC, Ryan JF, Tavarez U, Buus RJ, Miller DR, Chesler EJ, Threadgill DW, Churchill GA, et al. 2012. Genetic analysis of hematological parameters in incipient lines of the collaborative cross. G3 (Bethesda) 2: 157–165. [DOI] [PMC free article] [PubMed] [Google Scholar]
- Kelada SN, Carpenter DE, Aylor DL, Chines P, Rutledge H, Chesler EJ, Churchill GA, Pardo-Manuel de Villena F, Schwartz DA, Collins FS. 2014. Integrative genetic analysis of allergic inflammation in the murine lung. Am J Respir Cell Mol Biol 51: 436–445. [DOI] [PMC free article] [PubMed] [Google Scholar]
- Kember RL, Fernandes C, Tunbridge EM, Liu L, Payá-Cano JL, Parsons MJ, Schalkwyk LC. 2010. A B2 SINE insertion in the Comt1 gene (Comt1B2i) results in an overexpressing, behavior modifying allele present in classical inbred mouse strains. Genes Brain Behav 9: 925–932. [DOI] [PMC free article] [PubMed] [Google Scholar]
- Kilpinen H, Dermitzakis ET. 2012. Genetic and epigenetic contribution to complex traits. Hum Mol Genet 21: R24–R28. [DOI] [PubMed] [Google Scholar]
- Klein RF, Mitchell SR, Phillips TJ, Belknap JK, Orwoll ES. 1998. Quantitative trait loci affecting peak bone mineral density in mice. J Bone Miner Res 13: 1648–1656. [DOI] [PubMed] [Google Scholar]
- Koscielny G, Yaikhom G, Iyer V, Meehan TF, Morgan H, Atienza-Herrero J, Blake A, Chen CK, Easty R, Di Fenza A, et al. 2014. The International Mouse Phenotyping Consortium Web Portal, a unified point of access for knockout mice and related phenotyping data. Nucleic Acids Res 42: D802–D809. [DOI] [PMC free article] [PubMed] [Google Scholar]
- Kotowski IK, Pertsemlidis A, Luke A, Cooper RS, Vega GL, Cohen JC, Hobbs HH. 2006. A spectrum of PCSK9 alleles contributes to plasma levels of low-density lipoprotein cholesterol. Am J Hum Genet 78: 410–422. [DOI] [PMC free article] [PubMed] [Google Scholar]
- Lander ES. 2011. Initial impact of the sequencing of the human genome. Nature 470: 187–197. [DOI] [PubMed] [Google Scholar]
- Lango Allen H, Estrada K, Lettre G, Berndt SI, Weedon MN, Rivadeneira F, Willer CJ, Jackson AU, Vedantam S, Raychaudhuri S, et al. 2010. Hundreds of variants clustered in genomic loci and biological pathways affect human height. Nature 467: 832–838. [DOI] [PMC free article] [PubMed] [Google Scholar]
- Ledermann B. 2000. Embryonic stem cells and gene targeting. Exp Physiol 85: 603–613. [PubMed] [Google Scholar]
- Legare ME, Bartlett FS II, Frankel WN. 2000. A major effect QTL determined by multiple genes in epileptic EL mice. Genome Res 10: 42–48. [PMC free article] [PubMed] [Google Scholar]
- Lehner B. 2013. Genotype to phenotype: lessons from model organisms for human genetics. Nat Rev Genet 14: 168–178. [DOI] [PubMed] [Google Scholar]
- Linder CC, Davisson MT. 2004. Strains, stocks, and mutant mice. In The laboratory mouse, pp. 25–46. Elsevier Academic Press, London. [Google Scholar]
- Lloyd SE, Maytham EG, Pota H, Grizenkova J, Molou E, Uphill J, Hummerich H, Whitfield J, Alpers MP, Mead S, et al. 2009. HECTD2 is associated with susceptibility to mouse and human prion disease. PLoS Genet 5: e1000383. [DOI] [PMC free article] [PubMed] [Google Scholar]
- Lloyd SE, Maytham EG, Grizenkova J, Hummerich H, Collinge J. 2010. A Copine family member, Cpne8, is a candidate quantitative trait gene for prion disease incubation time in mouse. Neurogenetics 11: 185–191. [DOI] [PMC free article] [PubMed] [Google Scholar]
- Logan RW, Robledo RF, Recla JM, Philip VM, Bubier JA, Jay JJ, Harwood C, Wilcox T, Gatti DM, Bult CJ, et al. 2013. High-precision genetic mapping of behavioral traits in the diversity outbred mouse population: genetic mapping of behavioral traits in the outbred mouse. Genes Brain Behav 12: 424–437. [DOI] [PMC free article] [PubMed] [Google Scholar]
- Lu JT, Campeau PM, Lee BH. 2014. Genotype–phenotype correlation—promiscuity in the era of next-generation sequencing. N Engl J Med 371: 593–596. [DOI] [PubMed] [Google Scholar]
- Mackay TF. 2001. The genetic architecture of quantitative traits. Annu Rev Genet 35: 303–339. [DOI] [PubMed] [Google Scholar]
- Mackay TF. 2013. Epistasis and quantitative traits: using model organisms to study gene–gene interactions. Nat Rev Genet 15: 22–33. [DOI] [PMC free article] [PubMed] [Google Scholar]
- Mackay TF, Moore JH. 2014. Why epistasis is important for tackling complex human disease genetics. Genome Med 6: 42. [DOI] [PMC free article] [PubMed] [Google Scholar]
- Macleod M. 2011. Why animal research needs to improve. Nature 477: 511–511. [DOI] [PubMed] [Google Scholar]
- MacPhee M, Chepenik KP, Liddell RA, Nelson KK, Siracusa LD, Buchberg AM. 1995. The secretory phospholipase A2 gene is a candidate for the Mom1 locus, a major modifier of ApcMin-induced intestinal neoplasia. Cell 81: 957–966. [DOI] [PubMed] [Google Scholar]
- Maller J, George S, Purcell S, Fagerness J, Altshuler D, Daly MJ, Seddon JM. 2006. Common variation in three genes, including a noncoding variant in CFH, strongly influences risk of age-related macular degeneration. Nat Genet 38: 1055–1059. [DOI] [PubMed] [Google Scholar]
- Manolio TA. 2013. Bringing genome-wide association findings into clinical use. Nat Rev Genet 14: 549–558. [DOI] [PubMed] [Google Scholar]
- Manolio TA, Collins FS, Cox NJ, Goldstein DB, Hindorff LA, Hunter DJ, McCarthy MI, Ramos EM, Cardon LR, Chakravarti A, et al. 2009. Finding the missing heritability of complex diseases. Nature 461: 747–753. [DOI] [PMC free article] [PubMed] [Google Scholar]
- Markel P, Shu P, Ebeling C, Carlson GA, Nagle DL, Smutko JS, Moore KJ. 1997. Theoretical and empirical issues for marker-assisted breeding of congenic mouse strains. Nat Genet 17: 280–284. [DOI] [PubMed] [Google Scholar]
- Marshall JD, Mu JL, Cheah YC, Nesbitt MN, Frankel WN, Paigen B. 1992. The AXB and BXA set of recombinant inbred mouse strains. Mamm Genome 3: 669–680. [DOI] [PubMed] [Google Scholar]
- Matin A, Collin GB, Asada Y, Varnum D, Nadeau JH. 1999. Susceptibility to testicular germ-cell tumours in a 129.MOLF-Chr 19 chromosome substitution strain. Nat Genet 23: 237–240. [DOI] [PubMed] [Google Scholar]
- McClearn GE, Rodgers DA. 1961. Genetic factors in alcohol preference of laboratory mice. J Comp Physiol Psychol 54: 116–119. [Google Scholar]
- McClellan J, King MC. 2010. Genetic heterogeneity in human disease. Cell 141: 210–217. [DOI] [PubMed] [Google Scholar]
- Medina E, North RJ. 2001. Resistance ranking of some common inbred mouse strains to Mycobacterium tuberculosis and relationship to major histocompatibility complex haplotype and Nramp1 genotype: resistance ranking of inbred mouse strains. Immunology 93: 270–274. [DOI] [PMC free article] [PubMed] [Google Scholar]
- Mell B, Abdul-Majeed S, Kumarasamy S, Waghulde H, Pillai R, Nie Y, Joe B. 2015. Multiple blood pressure loci with opposing blood pressure effects on rat chromosome 1 in a homologous region linked to hypertension on human chromosome 15. Hypertens Res 38: 61–67. [DOI] [PubMed] [Google Scholar]
- Mesner LD, Ray B, Hsu YH, Manichaikul A, Lum E, Bryda EC, Rich SS, Rosen CJ, Criqui MH, Allison M, et al. 2014. Bicc1 is a genetic determinant of osteoblastogenesis and bone mineral density. J Clin Invest 124: 2736–2749. [DOI] [PMC free article] [PubMed] [Google Scholar]
- Millward CA, Burrage LC, Shao H, Sinasac DS, Kawasoe JH, Hill-Baskin AE, Ernest SR, Gornicka A, Hsieh CW, Pisano S, et al. 2009. Genetic factors for resistance to diet-induced obesity and associated metabolic traits on mouse chromosome 17. Mamm Genome 20: 71–82. [DOI] [PMC free article] [PubMed] [Google Scholar]
- Mohlke KL, Purkayastha AA, Westrick RJ, Smith PL, Petryniak B, Lowe JB, Ginsburg D. 1999. Mvwf, a dominant modifier of murine von Willebrand factor, results from altered lineage-specific expression of a glycosyltransferase. Cell 96: 111–120. [DOI] [PubMed] [Google Scholar]
- Moltke I, Grarup N, Jørgensen ME, Bjerregaard P, Treebak JT, Fumagalli M, Korneliussen TS, Andersen MA, Nielsen TS, Krarup NT, et al. 2014. A common Greenlandic TBC1D4 variant confers muscle insulin resistance and type 2 diabetes. Nature 512: 190–193. [DOI] [PubMed] [Google Scholar]
- Mott R, Talbot CJ, Turri MG, Collins AC, Flint J. 2000. A method for fine mapping quantitative trait loci in outbred animal stocks. Proc Natl Acad Sci 97: 12649–12654. [DOI] [PMC free article] [PubMed] [Google Scholar]
- Mott R, Yuan W, Kaisaki P, Gan X, Cleak J, Edwards A, Baud A, Flint J. 2014. The architecture of parent-of-origin effects in mice. Cell 156: 332–342. [DOI] [PMC free article] [PubMed] [Google Scholar]
- Nadeau JH. 2001. Modifier genes in mice and humans. Nat Rev Genet 2: 165–174. [DOI] [PubMed] [Google Scholar]
- Nadeau JH. 2003. Modifier genes and protective alleles in humans and mice. Curr Opin Genet Dev 13: 290–295. [DOI] [PubMed] [Google Scholar]
- Nadeau JH, Dudley AM. 2011. Systems genetics. Science 331: 1015–1016. [DOI] [PMC free article] [PubMed] [Google Scholar]
- Nadeau JH, Singer JB, Matin A, Lander ES. 2000. Analysing complex genetic traits with chromosome substitution strains. Nat Genet 24: 221–225. [DOI] [PubMed] [Google Scholar]
- Nadeau JH, Burrage LC, Restivo J, Pao YH, Churchill G, Hoit BH. 2003. Pleiotropy, homeostasis, and functional networks based on assays of cardiovascular traits in genetically randomized populations. Genome Res 13: 2082–2091. [DOI] [PMC free article] [PubMed] [Google Scholar]
- Nadeau JH, Forejt J, Takada T, Shiroishi T. 2012. Chromosome substitution strains: gene discovery, functional analysis, and systems studies. Mamm Genome 23: 693–705. [DOI] [PMC free article] [PubMed] [Google Scholar]
- Nejentsev S, Howson JMM, Walker NM, Szeszko J, Field SF, Stevens HE, Reynolds P, Hardy M, King E, Masters J, et al. 2007. Localization of type 1 diabetes susceptibility to the MHC class I genes HLA-B and HLA-A. Nature 450: 887–892. [DOI] [PMC free article] [PubMed] [Google Scholar]
- Nelson VR, Spiezio SH, Nadeau JH. 2010. Transgenerational genetic effects of the paternal Y chromosome on daughters’ phenotypes. Epigenomics 2: 513–521. [DOI] [PMC free article] [PubMed] [Google Scholar]
- Orozco LD, Bennett BJ, Farber CR, Ghazalpour A, Pan C, Che N, Wen P, Qi HX, Mutukulu A, Siemers N, et al. 2012. Unraveling inflammatory responses using systems genetics and gene-environment interactions in macrophages. Cell 151: 658–670. [DOI] [PMC free article] [PubMed] [Google Scholar]
- Orrù V, Steri M, Sole G, Sidore C, Virdis F, Dei M, Lai S, Zoledziewska M, Busonero F, Mulas A, et al. 2013. Genetic variants regulating immune cell levels in health and disease. Cell 155: 242–256. [DOI] [PMC free article] [PubMed] [Google Scholar]
- Paigen B, Morrow A, Brandon C, Mitchell D, Holmes P. 1985. Variation in susceptibility to atherosclerosis among inbred strains of mice. Atherosclerosis 57: 65–73. [DOI] [PubMed] [Google Scholar]
- Park CC, Gale GD, de Jong S, Ghazalpour A, Bennett BJ, Farber CR, Langfelder P, Lin A, Khan AH, Eskin E, et al. 2011. Gene networks associated with conditional fear in mice identified using a systems genetics approach. BMC Syst Biol 5: 43. [DOI] [PMC free article] [PubMed] [Google Scholar]
- Parks BW, Nam E, Org E, Kostem E, Norheim F, Hui ST, Pan C, Civelek M, Rau CD, Bennett BJ, et al. 2013. Genetic control of obesity and gut microbiota composition in response to high-fat, high-sucrose diet in mice. Cell Metab 17: 141–152. [DOI] [PMC free article] [PubMed] [Google Scholar]
- Peirce JL, Lu L, Gu J, Silver LM, Williams RW. 2004. A new set of BXD recombinant inbred lines from advanced intercross populations in mice. BMC Genet 5: 7. [DOI] [PMC free article] [PubMed] [Google Scholar]
- Peters LL, Robledo RF, Bult CJ, Churchill GA, Paigen BJ, Svenson KL. 2007. The mouse as a model for human biology: a resource guide for complex trait analysis. Nat Rev Genet 8: 58–69. [DOI] [PubMed] [Google Scholar]
- Philip VM, Sokoloff G, Ackert-Bicknell CL, Striz M, Branstetter L, Beckmann MA, Spence JS, Jackson BL, Galloway LD, Barker P, et al. 2011. Genetic analysis in the Collaborative Cross breeding population. Genome Res 21: 1223–1238. [DOI] [PMC free article] [PubMed] [Google Scholar]
- Phillippi J, Xie Y, Miller DR, Bell TA, Zhang Z, Lenarcic AB, Aylor DL, Krovi SH, Threadgill DW, Pardo-Manuel de Villena F, et al. 2014. Using the emerging Collaborative Cross to probe the immune system. Genes Immun 15: 38–46. [DOI] [PMC free article] [PubMed] [Google Scholar]
- Phillips TJ, Crabbe JC, Metten P, Belknap JK. 1994. Localization of genes affecting alcohol drinking in mice. Alcohol Clin Exp Res 18: 931–941. [DOI] [PubMed] [Google Scholar]
- Plaisier CL, Bennett BJ, He A, Guan B, Lusis AJ, Reue K, Vergnes L. 2012. Zbtb16 has a role in brown adipocyte bioenergetics. Nutr Diabetes 2: e46. [DOI] [PMC free article] [PubMed] [Google Scholar]
- Popp RA, Bailiff EG, Skow LC, Whitney JB. 1982. The primary structure of genetic variants of mouse hemoglobin. Biochem Genet 20: 199–208. [DOI] [PubMed] [Google Scholar]
- Prinz F, Schlange T, Asadullah K. 2011. Believe it or not: how much can we rely on published data on potential drug targets? Nat Rev Drug Discov 10: 712. [DOI] [PubMed] [Google Scholar]
- Rasmussen AL, Okumura A, Ferris MT, Green R, Feldmann F, Kelly SM, Scott DP, Safronetz D, Haddock E, LaCasse R, et al. 2014. Host genetic diversity enables Ebola hemorrhagic fever pathogenesis and resistance. Science 346: 987–991. [DOI] [PMC free article] [PubMed] [Google Scholar]
- Rau CD, Wang J, Avetisyan R, Romay M, Martin L, Ren S, Wang Y, Lusis AJ. 2015. Mapping genetic contributions to cardiac pathology induced by β-adrenergic stimulation in mice. Circ Cardiovasc Genet 8: 40–49. [DOI] [PMC free article] [PubMed] [Google Scholar]
- Recla JM, Robledo RF, Gatti DM, Bult CJ, Churchill GA, Chesler EJ. 2014. Precise genetic mapping and integrative bioinformatics in Diversity Outbred mice reveals Hydin as a novel pain gene. Mamm Genome 25: 211–222. [DOI] [PMC free article] [PubMed] [Google Scholar]
- Rivas MA, Beaudoin M, Gardet A, Stevens C, Sharma Y, Zhang CK, Boucher G, Ripke S, Ellinghaus D, Burtt N, et al. 2011. Deep resequencing of GWAS loci identifies independent rare variants associated with inflammatory bowel disease. Nat Genet 43: 1066–1073. [DOI] [PMC free article] [PubMed] [Google Scholar]
- Roberts KA, Abraira VE, Tucker AF, Goodrich LV, Andrews NC. 2012. Mutation of Rubie, a novel long non-coding RNA located upstream of Bmp4, causes vestibular malformation in mice. PLoS One 7: e29495. [DOI] [PMC free article] [PubMed] [Google Scholar]
- Robinson MR, Wray NR, Visscher PM. 2014. Explaining additional genetic variation in complex traits. Trends Genet 30: 124–132. [DOI] [PMC free article] [PubMed] [Google Scholar]
- Rogala AR, Morgan AP, Christensen AM, Gooch TJ, Bell TA, Miller DR, Godfrey VL, de Villena FP. 2014. The Collaborative Cross as a resource for modeling human disease: CC011/Unc, a new mouse model for spontaneous colitis. Mamm Genome 25: 95–108. [DOI] [PMC free article] [PubMed] [Google Scholar]
- Rogers MS, Adini I, McBride AF, Birsner AE, D'Amato RJ. 2013. The albino mutation of tyrosinase alters ocular angiogenic responsiveness. Angiogenesis 16: 639–646. [DOI] [PMC free article] [PubMed] [Google Scholar]
- Rutledge H, Aylor DL, Carpenter DE, Peck BC, Chines P, Ostrowski LE, Chesler EJ, Churchill GA, de Villena FP, Kelada SN. 2014. Genetic regulation of Zfp30, CXCL1, and neutrophilic inflammation in mouse lung. Genetics 198: 735–745. [DOI] [PMC free article] [PubMed] [Google Scholar]
- Sa Q, Hart E, Hill AE, Nadeau JH, Hoover-Plow JL. 2008. Quantitative trait locus analysis for hemostasis and thrombosis. Mamm Genome 19: 406–412. [DOI] [PMC free article] [PubMed] [Google Scholar]
- Sanna S, Li B, Mulas A, Sidore C, Kang HM, Jackson AU, Piras MG, Usala G, Maninchedda G, Sassu A, et al. 2011. Fine mapping of five loci associated with low-density lipoprotein cholesterol detects variants that double the explained heritability. PLoS Genet 7: e1002198. [DOI] [PMC free article] [PubMed] [Google Scholar]
- Schughart K, Libert C, Kas MJ. 2013. Controlling complexity: the clinical relevance of mouse complex genetics. Eur J Hum Genet 21: 1191–1196. [DOI] [PMC free article] [PubMed] [Google Scholar]
- Shao H, Burrage LC, Sinasac DS, Hill AE, Ernest SR, O'Brien W, Courtland HW, Jepsen KJ, Kirby A, Kulbokas EJ, et al. 2008. Genetic architecture of complex traits: large phenotypic effects and pervasive epistasis. Proc Natl Acad Sci 105: 19910–19914. [DOI] [PMC free article] [PubMed] [Google Scholar]
- Shao H, Sinasac D, Burrage L, Hodges C, Supelak P, Palmert M, Moreno C, Cowley A, Jacob H, Nadeau J. 2010. Analyzing complex traits with congenic strains. Mamm Genome 21: 276–286. [DOI] [PMC free article] [PubMed] [Google Scholar]
- Silver LM. 1995. Mouse genetics: concepts and applications. Oxford University Press, Oxford, UK. [Google Scholar]
- Singer JB. 2005. Mapping quantitative trait loci for anxiety in chromosome substitution strains of mice. Genetics 169: 855–862. [DOI] [PMC free article] [PubMed] [Google Scholar]
- Singer JB, Hill AE, Burrage LC, Olszens KR, Song J, Justice M, O'Brien WE, Conti DV, Witte JS, Lander ES, et al. 2004. Genetic dissection of complex traits with chromosome substitution strains of mice. Science 304: 445–448. [DOI] [PubMed] [Google Scholar]
- Smallwood TL, Gatti DM, Quizon P, Weinstock GM, Jung KC, Zhao L, Hua K, Pomp D, Bennett BJ. 2014. High-resolution genetic mapping in the diversity outbred mouse population identifies Apobec1 as a candidate gene for atherosclerosis. G3 (Bethesda) 4: 2353–2363. [DOI] [PMC free article] [PubMed] [Google Scholar]
- Smolock EM, Ilyushkina IA, Ghazalpour A, Gerloff J, Murashev AN, Lusis AJ, Korshunov VA. 2012. Genetic locus on mouse chromosome 7 controls elevated heart rate. Physiol Genomics 44: 689–698. [DOI] [PMC free article] [PubMed] [Google Scholar]
- Somer RA, Thummel CS. 2014. Epigenetic inheritance of metabolic state. Curr Opin Genet Dev 27: 43–47. [DOI] [PMC free article] [PubMed] [Google Scholar]
- Spiezio SH, Takada T, Shiroishi T, Nadeau JH. 2012. Genetic divergence and the genetic architecture of complex traits in chromosome substitution strains of mice. BMC Genet 13: 38. [DOI] [PMC free article] [PubMed] [Google Scholar]
- Spiezio SH, Amon LM, McMillen TS, Vick CM, Houston BA, Caldwell M, Ogimoto K, Morton GJ, Kirk EA, Schwartz MW, et al. 2014. Genetic determinants of atherosclerosis, obesity, and energy balance in consomic mice. Mamm Genome 25: 549–563. [DOI] [PMC free article] [PubMed] [Google Scholar]
- Staeheli P, Grob R, Meier E, Sutcliffe JG, Haller O. 1988. Influenza virus-susceptible mice carry Mx genes with a large deletion or a nonsense mutation. Mol Cell Biol 8: 4518–4523. [DOI] [PMC free article] [PubMed] [Google Scholar]
- Steinmetz LM, Sinha H, Richards DR, Spiegelman JI, Oefner PJ, McCusker JH, Davis RW. 2002. Dissecting the architecture of a quantitative trait locus in yeast. Nature 416: 326–330. [DOI] [PubMed] [Google Scholar]
- Street VA, Kujawa SG, Manichaikul A, Broman KW, Kallman JC, Shilling DJ, Iwata AJ, Robinson LC, Robbins CA, Li J, et al. 2014. Resistance to noise-induced hearing loss in 129S6 and MOLF mice: identification of independent, overlapping, and interacting chromosomal regions. J Assoc Res Otolaryngol 15: 721–738. [DOI] [PMC free article] [PubMed] [Google Scholar]
- Sullivan PF. 2010. The psychiatric GWAS consortium: big science comes to psychiatry. Neuron 68: 182–186. [DOI] [PMC free article] [PubMed] [Google Scholar]
- Surwit RS, Kuhn CM, Cochrane C, McCubbin JA, Feinglos MN. 1988. Diet-induced type II diabetes in C57BL/6J mice. Diabetes 37: 1163–1167. [DOI] [PubMed] [Google Scholar]
- Svenson KL, Gatti DM, Valdar W, Welsh CE, Cheng R, Chesler EJ, Palmer AA, McMillan L, Churchill GA. 2012. High-resolution genetic mapping using the Mouse Diversity outbred population. Genetics 190: 437–447. [DOI] [PMC free article] [PubMed] [Google Scholar]
- Takada T, Mita A, Maeno A, Sakai T, Shitara H, Kikkawa Y, Moriwaki K, Yonekawa H, Shiroishi T. 2008. Mouse inter-subspecific consomic strains for genetic dissection of quantitative complex traits. Genome Res 18: 500–508. [DOI] [PMC free article] [PubMed] [Google Scholar]
- Thaisz J, Tsaih SW, Feng M, Philip VM, Zhang Y, Yanas L, Sheehan S, Xu L, Miller DR, Paigen B, et al. 2012. Genetic analysis of albuminuria in collaborative cross and multiple mouse intercross populations. Am J Physiol Renal Physiol 303: F972–F981. [DOI] [PMC free article] [PubMed] [Google Scholar]
- Threadgill DW, Churchill GA. 2012. Ten years of the Collaborative Cross. G3 (Bethesda) 2: 153–156. [DOI] [PMC free article] [PubMed] [Google Scholar]
- Threadgill DW, Hunter KW, Williams RW. 2002. Genetic dissection of complex and quantitative traits: from fantasy to reality via a community effort. Mamm Genome 13: 175–178. [DOI] [PubMed] [Google Scholar]
- Threadgill DW, Miller DR, Churchill GA, de Villena FP. 2011. The collaborative cross: a recombinant inbred mouse population for the systems genetic era. ILAR J 52: 24–31. [DOI] [PubMed] [Google Scholar]
- Valdar W, Flint J, Mott R. 2006a. Simulating the collaborative cross: power of quantitative trait loci detection and mapping resolution in large sets of recombinant inbred strains of mice. Genetics 172: 1783–1797. [DOI] [PMC free article] [PubMed] [Google Scholar]
- Valdar W, Solberg LC, Gauguier D, Burnett S, Klenerman P, Cookson WO, Taylor MS, Rawlins JNP, Mott R, Flint J. 2006b. Genome-wide genetic association of complex traits in heterogeneous stock mice. Nat Genet 38: 879–887. [DOI] [PubMed] [Google Scholar]
- Van Steen K. 2012. Travelling the world of gene-gene interactions. Brief Bioinform 13: 1–19. [DOI] [PubMed] [Google Scholar]
- Velez Edwards DR, Naj AC, Monda K, North KE, Neuhouser M, Magvanjav O, Kusimo I, Vitolins MZ, Manson JE, O'Sullivan MJ, et al. 2012. Gene-environment interactions and obesity traits among postmenopausal African-American and Hispanic women in the Women's Health Initiative SHARe Study. Hum Genet 132: 323–336. [DOI] [PMC free article] [PubMed] [Google Scholar]
- Vered K, Durrant C, Mott R, Iraqi FA. 2014. Susceptibility to klebsiella pneumonaie infection in collaborative cross mice is a complex trait controlled by at least three loci acting at different time points. BMC Genomics 15: 865. [DOI] [PMC free article] [PubMed] [Google Scholar]
- Visscher PM. 2008. Sizing up human height variation. Nat Genet 40: 489–490. [DOI] [PubMed] [Google Scholar]
- Visscher PM, Brown MA, McCarthy MI, Yang J. 2012. Five years of GWAS discovery. Am J Hum Genet 90: 7–24. [DOI] [PMC free article] [PubMed] [Google Scholar]
- Wallace AS, Anderson RB. 2011. Genetic interactions and modifier genes in Hirschsprung's disease. World J Gastroenterol 17: 4937. [DOI] [PMC free article] [PubMed] [Google Scholar]
- Whitney IE, Raven MA, Lu L, Williams RW, Reese BE. 2011. A QTL on chromosome 10 modulates cone photoreceptor number in the mouse retina. Invest Ophthalmol Vis Sci 52: 3228–3236. [DOI] [PMC free article] [PubMed] [Google Scholar]
- Winawer MR, Kuperman R, Niethammer M, Sherman S, Rabinowitz D, Guell IP, Ponder CA, Palmer AA. 2007. Use of chromosome substitution strains to identify seizure susceptibility loci in mice. Mamm Genome 18: 23–31. [DOI] [PMC free article] [PubMed] [Google Scholar]
- Winawer MR, Klassen TL, Teed S, Shipman M, Leung EH, Palmer AA. 2014. A locus on mouse Ch10 influences susceptibility to limbic seizure severity: fine mapping and in silico candidate gene analysis: identification of candidate genes for mouse limbic seizure susceptibility. Genes Brain Behav 13: 341–349. [DOI] [PMC free article] [PubMed] [Google Scholar]
- Wood AR, Esko T, Yang J, Vedantam S, Pers TH, Gustafsson S, Chu AY, Estrada K, Luan J, Kutalik Z, et al. 2014. Defining the role of common variation in the genomic and biological architecture of adult human height. Nat Genet 46: 1173–1186. [DOI] [PMC free article] [PubMed] [Google Scholar]
- Wu Y, Williams EG, Dubuis S, Mottis A, Jovaisaite V, Houten SM, Argmann CA, Faridi P, Wolski W, Kutalik Z, et al. 2014. Multilayered genetic and omics dissection of mitochondrial activity in a mouse reference population. Cell 158: 1415–1430. [DOI] [PMC free article] [PubMed] [Google Scholar]
- Yalcin B, Flint J. 2012. Association studies in outbred mice in a new era of full-genome sequencing. Mamm Genome 23: 719–726. [DOI] [PMC free article] [PubMed] [Google Scholar]
- Yalcin B, Willis-Owen SA, Fullerton J, Meesaq A, Deacon RM, Rawlins JNP, Copley RR, Morris AP, Flint J, Mott R. 2004. Genetic dissection of a behavioral quantitative trait locus shows that Rgs2 modulates anxiety in mice. Nat Genet 36: 1197–1202. [DOI] [PubMed] [Google Scholar]
- Yalcin B, Nicod J, Bhomra A, Davidson S, Cleak J, Farinelli L, Østerås M, Whitley A, Yuan W, Gan X, et al. 2010. Commercially available outbred mice for genome-wide association studies. PLoS Genet 6: e1001085. [DOI] [PMC free article] [PubMed] [Google Scholar]
- Yan Q, Sharma-Kuinkel BK, Deshmukh H, Tsalik EL, Cyr DD, Lucas J, Woods CW, Scott WK, Sempowski GD, Thaden J, et al. 2014. Dusp3 and Psme3 are associated with murine susceptibility to Staphylococcus aureus infection and human sepsis. PLoS Pathog 10: e1004149. [DOI] [PMC free article] [PubMed] [Google Scholar]
- Yang J, Ferreira T, Morris AP, Medland SE, Genetic Investigation of ANthropometric Traits (GIANT) Consortium; DIAbetes Genetics Replication And Meta-analysis (DIAGRAM) Consortium, Madden PAF, Heath AC, Martin NG, Montgomery GW, et al. 2012. Conditional and joint multiple-SNP analysis of GWAS summary statistics identifies additional variants influencing complex traits. Nat Genet 44: 369–375. [DOI] [PMC free article] [PubMed] [Google Scholar]
- Yazbek SN, Spiezio SH, Nadeau JH, Buchner DA. 2010. Ancestral paternal genotype controls body weight and food intake for multiple generations. Hum Mol Genet 19: 4134–4144. [DOI] [PMC free article] [PubMed] [Google Scholar]
- Yazbek SN, Buchner DA, Geisinger JM, Burrage LC, Spiezio SH, Zentner GE, Hsieh CW, Scacheri PC, Croniger CM, Nadeau JH. 2011. Deep congenic analysis identifies many strong, context-dependent QTLs, one of which, Slc35b4, regulates obesity and glucose homeostasis. Genome Res 21: 1065–1073. [DOI] [PMC free article] [PubMed] [Google Scholar]
- Youngren KK, Nadeau JH, Matin A. 2003. Testicular cancer susceptibility in the 129.MOLF-Chr19 mouse strain: additive effects, gene interactions and epigenetic modifications. Hum Mol Genet 12: 389–398. [DOI] [PubMed] [Google Scholar]
- Zheng QY, Johnson KR, Erway LC. 1999. Assessment of hearing in 80 inbred strains of mice by ABR threshold analyses. Hear Res 130: 94–107. [DOI] [PMC free article] [PubMed] [Google Scholar]
- Zhu R, Matin A. 2014. Tumor loci and their interactions on mouse chromosome 19 that contribute to testicular germ cell tumors. BMC Genet 15: 65. [DOI] [PMC free article] [PubMed] [Google Scholar]
- Zhu R, Ji Y, Xiao L, Matin A. 2007. Testicular germ cell tumor susceptibility genes from the consomic 129.MOLF-Chr19 mouse strain. Mamm Genome 18: 584–595. [DOI] [PMC free article] [PubMed] [Google Scholar]
- Zhu R, Heaney J, Nadeau JH, Ali S, Matin A. 2010. Deficiency of splicing factor 1 suppresses the occurrence of testicular germ cell tumors. Cancer Res 70: 7264–7272. [DOI] [PMC free article] [PubMed] [Google Scholar]
- Zou F, Gelfond JA, Airey DC, Lu L, Manly KF, Williams RW, Threadgill DW. 2005. Quantitative trait locus analysis using recombinant inbred intercrosses: theoretical and empirical considerations. Genetics 170: 1299–1311. [DOI] [PMC free article] [PubMed] [Google Scholar]
- Zuk O, Hechter E, Sunyaev SR, Lander ES. 2012. The mystery of missing heritability: genetic interactions create phantom heritability. Proc Natl Acad Sci 109: 1193–1198. [DOI] [PMC free article] [PubMed] [Google Scholar]
Associated Data
This section collects any data citations, data availability statements, or supplementary materials included in this article.