

Abstract
Small insertions and deletions (indels) and large structural variations (SVs) are major contributors to human genetic diversity and disease. However, mutation rates and characteristics of de novo indels and SVs in the general population have remained largely unexplored. We report 332 validated de novo structural changes identified in whole genomes of 250 families, including complex indels, retrotransposon insertions, and interchromosomal events. These data indicate a mutation rate of 2.94 indels (1–20 bp) and 0.16 SVs (>20 bp) per generation. De novo structural changes affect on average 4.1 kbp of genomic sequence and 29 coding bases per generation, which is 91 and 52 times more nucleotides than de novo substitutions, respectively. This contrasts with the equal genomic footprint of inherited SVs and substitutions. An excess of structural changes originated on paternal haplotypes. Additionally, we observed a nonuniform distribution of de novo SVs across offspring. These results reveal the importance of different mutational mechanisms to changes in human genome structure across generations.
Genomic mutations drive human evolution and phenotypic diversity. Comparative genomics studies highlighted important small base-level and large-scale differences between human and chimpanzee genomes and noted a larger impact of segmental duplications compared to single nucleotide variations (SNVs) (Cheng et al. 2005). Whereas interspecies comparisons provide us with insight into long-range processes such as genetic drift and selection, the information derived from direct measurements of the de novo mutation spectrum and rates across generations is crucial for understanding mechanisms of mutation formation and inter-individual differences (Scally and Durbin 2012). While several projects have started to investigate the rates and characteristics of de novo SNVs (Kong et al. 2012; Michaelson et al. 2012; Francioli et al. 2014; Besenbacher et al. 2015), those of de novo short insertions and deletions (indels) and large structural variants (SVs) have been much less studied (Campbell and Eichler 2013).
Copy number variations (CNVs) and SVs contribute substantially to human genetic variation (Iafrate et al. 2004; Sebat et al. 2004; Tuzun et al. 2005; Korbel et al. 2007), and the phenotypic impact of CNVs may be larger than that of SNVs (Redon et al. 2006; Stranger et al. 2007; Conrad et al. 2010). The impact of novel changes in genome structure is further illustrated by their role in human genetic disease (Stankiewicz and Lupski 2010; Cooper et al. 2011). Copy number variations are widely studied and have been implicated in a variety of neurological disorders, such as autism (Sebat et al. 2007), schizophrenia (Walsh et al. 2008), and intellectual disability (Cooper et al. 2011). Recent large-scale exome sequencing studies have uncovered de novo SNVs and short indels causing various disease phenotypes, ranging from complex neurological disease to rare Mendelian disorders (Veltman and Brunner 2012).
Given the significant contribution of de novo mutations to human disease and evolution, studying genome-wide mutation rates and patterns is important for understanding mutation origins, locating hotspots, estimating disease risk, and interpreting novel disease-associated mutations. Here, we surveyed the entire spectrum of de novo indels (1–20 bp) and SVs (>20 bp) in the human population at nucleotide-resolution using whole-genome sequencing data of 250 families from the Genome of the Netherlands (GoNL) Project (Boomsma et al. 2014; Francioli et al. 2014).
Results
Study design and variant detection
The Genome of the Netherlands Project includes 231 parent-offspring trios, 11 quartets with monozygotic (MZ) twins, and eight quartets with dizygotic (DZ) twins, for a total of 258 genetically distinct children. DNA material was obtained from peripheral blood mononuclear cells to avoid problems with accumulated somatic mutations routinely observed in DNA isolated from cell lines (Londin et al. 2011). The medium coverage (14.5× median sequence depth; 38.4× median physical depth) of paired-end sequencing data combined with a family-based design enabled the construction of a high-quality data set of genomic variation (Francioli et al. 2014).
Indels (1–20 bp) were called using three different tools using information from gapped reads and split-reads (Fig. 1; Methods). We focused exclusively on variants that were detected only in a single child by at least one tool with high confidence (Supplemental Table 1). We performed experimental validation assays for all 1169 candidate de novo indels in 110 children from 92 families (11 quartets with MZ twin pairs, seven quartets with DZ twin pairs, 74 trios). We successfully resequenced 968 candidates in these families, of which 291 indels (203 deletions, 74 insertions, and 14 complex indels) were confirmed as de novo events. All 31 de novo indels validated in MZ twin pairs were concordant between the two twins, showing that most of the mutations we report are germline mutations. After validation, we randomly excluded one of the twins from each MZ twin pair, leaving 99 children for de novo indel analysis. We only focused on regions where we had sufficient indel calling power by requiring at least four reads in the child and 10 reads in each parent. Using these thresholds, a median of 77% of the genome was covered with a sensitivity of 93.2% based on comparison of singletons in 11 twin pairs and 83.3% based on comparison of singletons in deep-coverage whole-exomes of 24 parents. This revealed a lower sensitivity for insertions (92.6% based on twin comparison, 75.1% based on whole-exome comparison) than for deletions (93.5% based on twin comparison, 87.4% based on whole-exome comparison).
Figure 1.
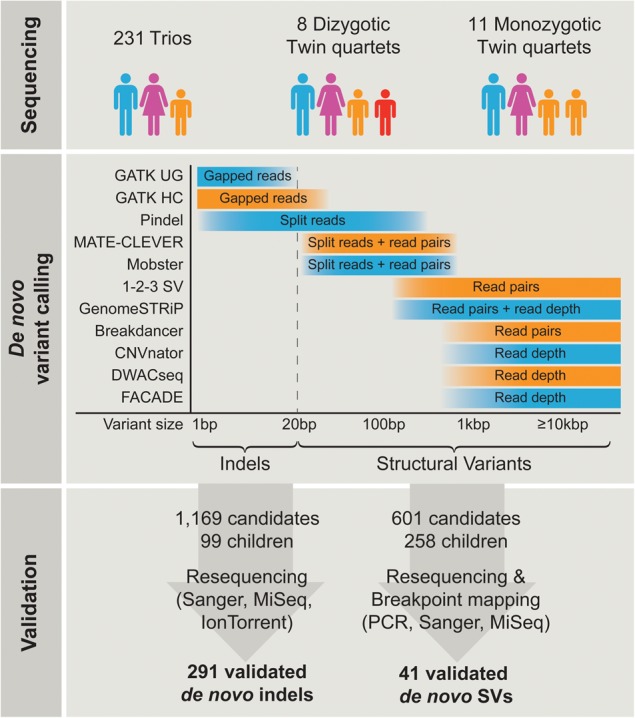
Overview of study design. A total of 250 parent-offspring families were sequenced at 14.5× coverage. De novo indel and structural variant (SV) calling was performed using 11 algorithms combining gapped reads, split reads, discordant read-pairs, and read depth approaches to cover the entire mutation size spectrum. All candidate indels (1169 in 99 children) and SVs (601 in 258 children) were subjected to experimental validation, leading to 291 validated de novo indels and 41 de novo SVs.
Structural variants (>20 bp) were predicted by a selection of 11 tools that together use information from gapped reads, split-reads, discordant read-pairs, and read depth to capture the full spectrum of SV sizes and types (Fig. 1; Methods). We identified a total of 601 de novo SV candidates in the 258 GoNL offspring based on permissive call settings and visual inspection using the Integrated Genome Viewer (IGV) (Supplemental Table 1; Robinson et al. 2011). All candidates were subjected to experimental validation, resulting in a final set of 41 confirmed de novo SVs ranging in size from 20 bp to 327 kbp (Supplemental Figs. 1, 2). The de novo SV set includes 27 deletions, eight tandem duplications, five retrotransposon insertions, and one complex interchromosomal event (that also involves a retrotransposon segment). We estimate the sensitivity of our calling for SVs sized 20–99 bp and SVs larger than 100 bp to be 69.4% and 85.8% that of deep coverage data, respectively. Further, nearly the complete genome (an average of 98.8% of the haploid genome excluding assembly gaps) was covered by four or more read-pairs, a minimum threshold for calling SVs in our data (Methods). The sensitivity for detection of retrotransposon insertions was tested based on a previously published set of validated variants and found to be 77.6% for heterozygous retrotransposon insertions (Stewart et al. 2011). To empirically estimate the sensitivity for calling large SVs (>100 kbp), we analyzed Illumina high-density SNP array data that were generated for 57 families (Supplemental Table 2). We detected a single de novo deletion (113 kbp) in these data, which was already identified by whole-genome sequencing.
In total, we confirmed 332 de novo structural changes (291 indels of size 1–20 bp and 41 SVs larger than 20 bp), which were used for downstream analyses (Fig. 2A; Supplemental Table 2). All 332 de novo variations are uniquely present in a single individual in the GoNL cohort. We also examined the overlap with public databases and found that three large SVs (>80% reciprocal overlap; Database of Genomic Variants; 1000 Genomes Phase 1) and eight rare indels (exact match; dbSNP build 142; allele frequency < 1.5%) are overlapping, suggesting that these events might be recurring in the population (Supplemental Table 2).
Figure 2.
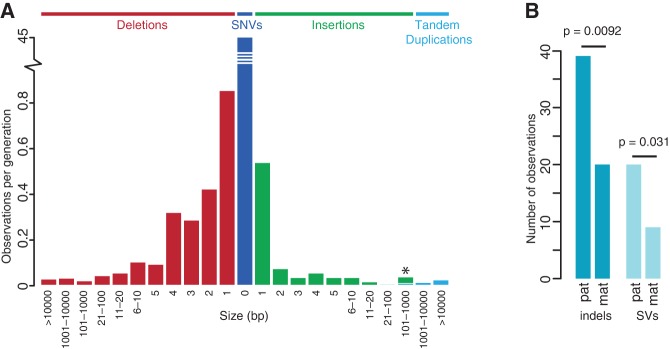
Frequency of de novo indels and SVs. (A) Size-frequency distribution of 332 validated de novo indels and SVs identified in this study. In addition, the frequency of de novo SNVs is shown (Francioli et al. 2014). The asterisk denotes a size bin containing one de novo tandem duplication and six de novo retrotransposon insertions. (B) Bar plot indicating the numbers of de novo indels and SVs on paternal and maternal haplotypes.
Indel and SV mutation rates
Previous estimates of the human indel mutation rate range from 0.53 to 1.5 × 10⁻⁹ per base per generation (Kondrashov 2003; Lynch 2010; Campbell and Eichler 2013; Ramu et al. 2013; Besenbacher et al. 2015). The mutation rate for copy number variants was estimated to be 0.03 for CNVs larger than 500 bp (Conrad et al. 2010) and 0.012 for CNVs larger than 100 kbp (Itsara et al. 2010) per haploid genome. Our data indicate a mutation rate of 0.68 × 10⁻⁹ indel (1–20 bp) per base per generation and 0.08 SVs (>20 bp) per haploid genome (or 0.16 SVs per generation). The higher SV rates reported here in comparison to previous array CGH studies result from greater power to interrogate the full size range and spectrum of structural changes (Fig. 2A). For example, when considering only CNVs larger than 500 bp or larger than 100 kbp, our data provide a rate of 0.041 and 0.0077 per haploid genome, respectively. In addition, a substantial proportion (15%) of the de novo SVs were retrotransposition events, allowing us to empirically estimate the rate of retrotransposition in the population to 0.023 (1/43) per generation. This is in line with estimates based on diseased subjects and on comparative genomics studies (Belancio et al. 2008; Burns and Boeke 2012).
Although the above de novo SV rate implies that only one in seven children bears such a mutation, we found six offspring with two and one with three de novo SVs (Supplemental Table 2). Such co-occurrence of multiple SVs is unexpected under a uniform distribution of the 41 de novo SVs across the 258 children (P = 0.0074). One individual carries two de novo deletions (327 and 1.5 kbp) on maternal Chromosome 18 within a distance of 202 kbp of each other. This close placement of two de novo SVs is unlikely to be random (P = 1.35 × 10⁻⁴). Together, these data suggest possible differences in the effects of environmental factors or the vulnerability for acquiring de novo SVs per family (Conrad et al. 2011). We did not find evidence for a nonuniform distribution of the de novo indels across offspring (P = 0.061).
Elevated paternal mutation rates
Large-scale genome sequencing of families with disorders has shown that most de novo SNVs have a paternal origin, with a significant increase of de novo mutation burden with paternal age (Conrad et al. 2011; Kong et al. 2012; Michaelson et al. 2012; Jiang et al. 2013; Francioli et al. 2014). In addition, the majority of sporadic de novo CNVs and cytogenetically balanced genomic rearrangements in patients with congenital disorders are paternal in origin (Batista et al. 1994; Hehir-Kwa et al. 2011). However, it is unclear whether this bias is also present for de novo SVs and indels occurring in the general population. Using reads spanning neighboring phase-informative polymorphisms, we assigned a parental haplotype to 20% of the indels (39 paternal, 20 maternal) and 71% of the SVs (20 paternal, nine maternal). We observed a significantly larger fraction (66.1%) of indels and SVs arising on paternal chromosomes than on maternal chromosomes (Pindel = 0.0092, PSV = 0.031) (Fig. 2B), further emphasizing the contribution of the paternal germline to human mutations. There was no significant correlation between de novo structural change occurrence and paternal age, possibly due to the limited number of observations.
Indel formation
We found a total of 277 simple indels with a deletion to insertion ratio of 2.74:1.This ratio is consistent with previous reports (Bhangale et al. 2005; Montgomery et al. 2013), although it is possible that this number is influenced by differences in detection power between insertions and deletions. To investigate the mechanisms of formation of these indels, we categorized their sequence content and flanking context (Table 1). Most of the de novo indels in our data (59.9%) were found in repeat regions or resulted in local copy count changes, meaning that the long allele can be obtained by copying part or all of the short allele. More specifically, we found 28 indels in homopolymer runs (HR), 27 in tandem repeats (TR) and 111 indels resulting in a copy count change outside repeat regions (CCC). Copy-count-changing indels show a relatively balanced deletion to insertion ratio of 1.5:1. They likely arose through polymerase slippage, a process by which the leading and lagging strand become mispaired during DNA replication, causing a few bases to be duplicated or deleted. Although we confirm a strong enrichment for indels in homopolymer runs (P < 2.2 × 10⁻¹⁶) and tandem repeats (P < 2.2 × 10⁻¹⁶) (Montgomery et al. 2013), they only represent 19.9% of our observations. This is significantly less than what we observe in polymorphic indels in our data (44.2%) and in previous reports (46.0%) (Montgomery et al. 2013), possibly indicating low selective pressures on these repetitive regions (Fig. 3A).
Table 1.
Indel classes and mechanisms
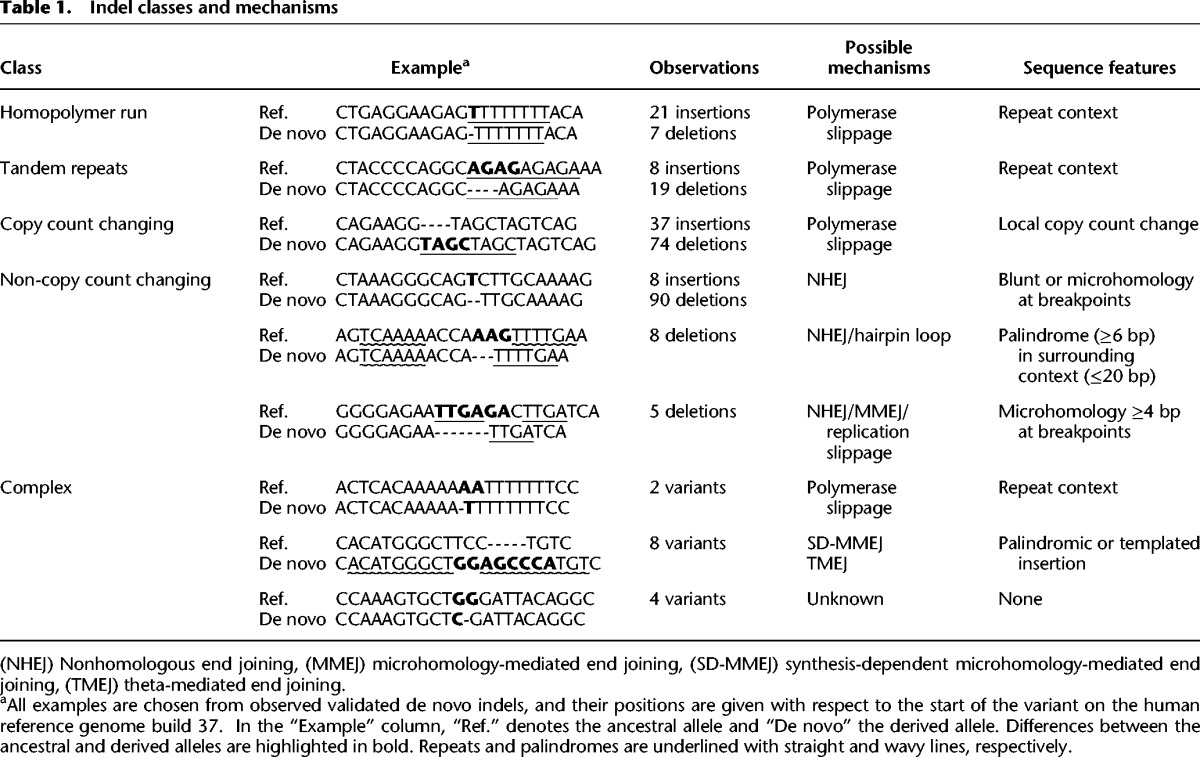
Figure 3.
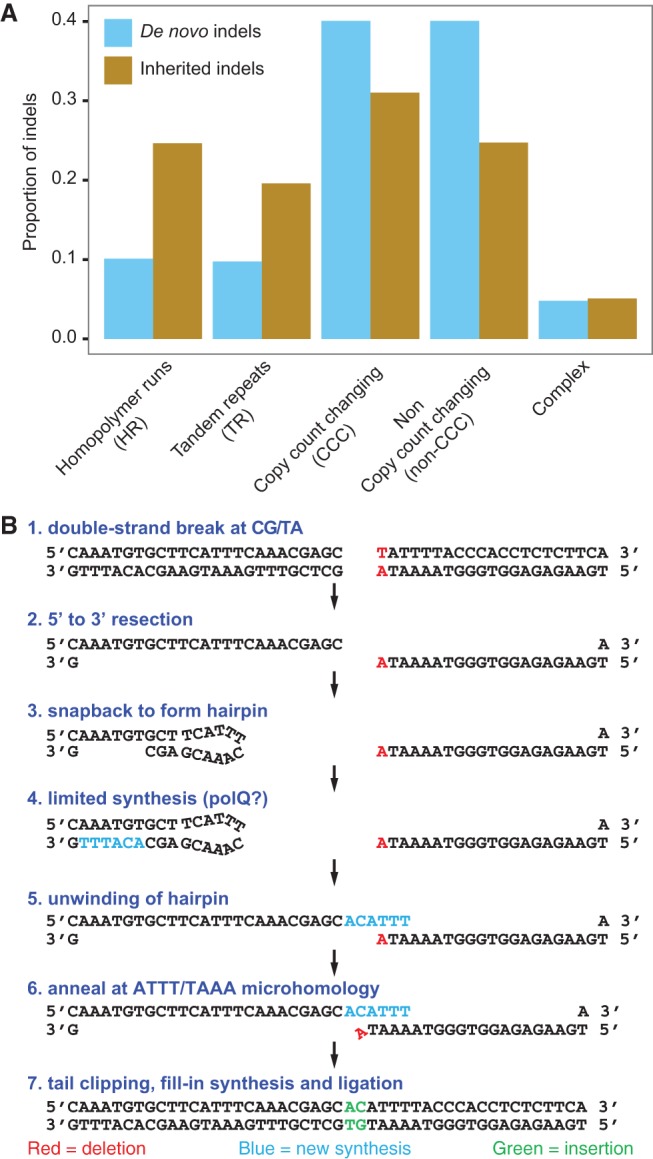
Overview of de novo and inherited indel classes and their formation mechanisms. (A) Proportion of de novo and inherited indels by class. Inherited indels exhibit a 2.3-fold enrichment in indels located in homopolymer runs (HR) and tandem repeats (TR) when compared to de novo indels, suggesting lower selective pressures in these regions. (B) Outline of a plausible seven-step process that could account for the formation of a complex de novo indel by SD-MMEJ.
The remaining 40.1% of the de novo indels occurred in non-repeat regions and did not lead to a copy count change (non-CCC). These likely result from imperfect double-stranded DNA break repairs by nonhomologous end joining (NHEJ) which can create indels at the repair junction. Their very high deletion-to-insertion ratio of 12.9:1 supports their occurrence through NHEJ (Hastings et al. 2009). This provides a mechanistic explanation for the relative depletion of short insertions in the overall size spectrum of de novo variation (Fig. 2A). We found palindromic sequences (≤20 bp away, ≥6 bp long) flanking eight of these deletions, suggesting that a secondary structure such as a hairpin loop played a role in their formation (Hastings et al. 2009; Montgomery et al. 2013). Another five non-CCC indels presented microhomologies of at least 4 bp, possibly indicating emergence through microhomology-mediated end joining (MMEJ) (McVey and Lee 2008).
In addition to the 277 simple indels, we also identified 14 complex indels (Table 1; Fig. 3B; Supplemental Table 3) replacing multiple bases (2–10 bp) by a different sequence (1–11 bp). Although similar types of complex indels have been described previously (Levy et al. 2007), this class of variants has largely been neglected in sequencing studies and is therefore absent from variant repositories. As they represent 4.8% of the de novo indels in our data, we speculate that this type of polymorphism may be relatively common. Indeed, we found that 5.1% of inherited indels in the GoNL samples seem complex. One of the difficulties posed by such variation when studying polymorphisms is that they can be due to a combination of multiple separate indels or SNVs or can occur as a single complex variant. We provide here the first de novo observation of such variations in humans, showing that they indeed arose as part of a single mutational event.
In contrast to simple indels, only two complex indels are located in repetitive regions, indicating that polymerase slippage is unlikely to be a major contributor to their formation. Strikingly, five of them form palindromic repeats (≥6 bp), a proportion significantly elevated when compared to simple insertions (P = 0.0015). The inserted bases for another three variants appeared to have been templated from the neighboring sequence. Such palindromic and templated complex indels have been reported in model organisms around double-stranded break repairs through synthesis-dependent microhomology-mediated end joining (SD-MMEJ) (Yu and McVey 2010) and theta-mediated end joining (TMEJ) (Roerink et al. 2014). The formation of these indels likely follows a multistep process involving resection of break ends, hairpin formation, microhomology-mediated annealing, and DNA synthesis. Figure 3B shows an example of how a de novo complex event we observed could have arisen through SD-MMEJ.
SV formation
To obtain insights into the origin of de novo SVs in the general population, we experimentally fine-mapped their breakpoints at base-pair resolution and assigned a formation mechanism (Fig. 4A; Supplemental Table 2; Lam et al. 2010). The majority (N = 24, 58.5%) of the SVs larger than 20 bp likely arose via nonhomologous repair (NHR) because their breakpoints presented little or no homology (0–6 bp, N = 19) or short inserted sequences (1–18 bp, N = 5). The breakpoints junctions of eight SVs (19.5%) contained long homologous sequences (28 bp to 12 kbp) indicating formation by homology-driven repair, and these are classified as mediated by nonallelic homologous recombination (NAHR) (Supplemental Table 2). Three variants (7.3%) were found within a region with a variable number of tandem repeats (VNTR).
Figure 4.
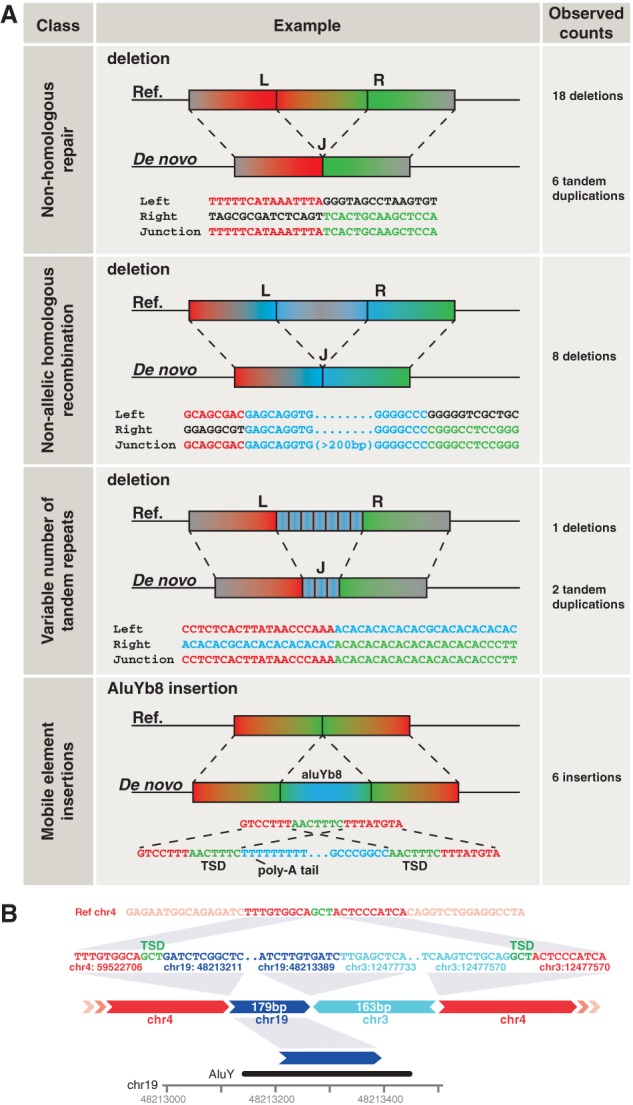
Mechanisms contributing to the formation of de novo SVs. (A) Overview of four SV formation mechanisms, including examples and observed counts for each of these. (L) Left flank, (R) right flank, (J) junction. (B) Schematic structure of a complex de novo interchromosomal SV involving an insertion of DNA from Chromosomes 3 and 19 into Chromosome 4. (TSD) Target site duplication.
We also identified six de novo mobile element insertions (14.6% of SVs), all short interspersed elements (SINE) retrotransposon insertions of the AluY family (Supplemental Fig. 2; Supplemental Table 2). The sequences of the breakpoint junctions of the de novo AluY retrotransposon insertions all indicate the presence of target site duplications (TSD) of 3–16 bp and poly(A) tails (Supplemental Fig. 2), both well-known signatures of retrotransposon integration (Burns and Boeke 2012).
Remarkably, in one instance of interchromosomal integration, we found three breakpoint junctions leading to the joining of two small DNA fragments—one from Chromosome 3 (163 bp) and another from Chromosome 19 (179 bp)—into Chromosome 4 (Fig. 4B). We propose that this complex rearrangement has also occurred through retrotransposition, because the fragment from Chromosome 19 contains part of an AluY element and no DNA is lost at the original genomic positions of the inserted sequences. Furthermore, the breakpoint on Chromosome 4 likely involved a staggered cut with three overhanging nucleotides, which appear as TSDs in the final product. The fragment on Chromosome 3 is close (1.7 kbp) to the 3′ UTR of the PPARG gene. We hypothesize that the fragment could represent a retrocopy of an RNA product from this region, e.g., an elongated version of the PPARG mRNA or another transcript.
We compared the proportion of de novo SVs derived from each of four mechanisms with inherited SVs from the GoNL Project. This revealed a larger proportion of mobile element insertions (MEI, 40.8%, P = 0.029) for inherited SVs and a lower proportion of NHR (30.3%, P = 0.0072), while similar proportions of VNTR (10.5%) and NAHR (18.4%) mediated variants were found. In addition, we compared the proportion of each SV mechanism with those reported previously (Supplemental Table 4; Kidd et al. 2010; Pang et al. 2010, 2013; Mills et al. 2011) and found substantial differences between studies, which probably reflect methodological differences (Pang et al. 2013).
Functional impact of de novo structural changes
Although none of the de novo indels overlapped with protein-coding exons, in total six large de novo SVs (3.7–327 kbp) affect coding regions, resulting in exonic duplications of BANK1 (one exon), PROC, GCNT3, GTF2A2, and BNIP2 (complete genes), and deletions in LYN (one exon), PTPRM (six exons), and UBR5 (eight exons) (Fig. 5; Supplemental Table 2). Four SVs potentially disrupt gene function by changing reading frames, introducing premature stop codons or truncating the protein. Examination of these genes in the exome sequencing database from the Exome Aggregation Consortium (ExAC, http://exac.broadinstitute.org) revealed that all of them contain heterozygous loss-of-function mutations in the population. This indicates that heterozygous changes in these genes possibly have no early developmental consequences. Mutations in two of the affected genes—BANK1 and PROC—are associated with systemic lupus erythematosus (Kozyrev et al. 2008) and thrombophilia (Romeo et al. 1987), respectively. However, PROC and BANK1 duplications—as observed in our study—have not been reported to be associated with a clinical phenotype and the offspring carrying these de novo SVs appeared healthy at the time of sampling (aged 39 and 32).
Figure 5.

Effect of de novo SVs on protein-coding genes. (A) Deletion of six exons of PTPRM, resulting in an in-frame shortened gene. (B) Deletion of one exon of LYN, causing an out-of-frame effect at the transcript level. (C) Deletion of eight exons of UBR5, causing an out-of-frame effect at the transcript level. (D) Duplication of one exon of BANK1, possibly resulting in a premature stop. (E) Duplication of the entire PROC1 gene. (F) Duplication of three entire genes (GCNT3, GTF2A2, BNIP2). Duplications are shown in green and deletions in red. (A) Ancestral allele, (D) derived allele.
Next, we compared the genomic footprints of de novo SVs and indels with SNVs (Supplemental Methods). Consistent with recent studies involving families with disorders (Kong et al. 2012; Michaelson et al. 2012; Jiang et al. 2013; Gilissen et al. 2014), an average of 45 de novo SNVs per child were detected in the GoNL Project (Francioli et al. 2014). While the cumulative burden of de novo indels was only 7.1 bp per child, we found that despite their lower frequency, de novo SVs affected on average 4084 genomic bases (Fig. 6A). This relatively large impact of SVs was also found in coding regions where an average of 28.6 coding bases per generation were affected by de novo SVs, while only 0.55 coding bases per generation were mutated by de novo SNVs (Fig. 6B). The larger number of affected bases for SVs relative to SNVs is largely due to their difference in size. We observed that, per offspring, 18 times more genes are hit by de novo SNVs (0.55) versus SVs (0.03) (Fig. 6C). However, only 5% of de novo SNVs are potentially disruptive (stop gained, stop lost, splice-site change), whereas 50% (4/8) of the de novo SVs possibly have a major impact on gene structure and function (Fig. 5).
Figure 6.

Functional impact of de novo indels and SVs. (A) Average number of genomic bases affected by de novo SNVs, indels, and SVs per child. (B) Average number of coding bases affected by de novo SNVs, indels, and SVs per child. (C) Average number of genes affected by de novo SNVs, indels, and SVs per child. The relative frequencies of the effects of the variations on the gene are indicated. (D) Comparison of the footprint of de novo (blue bars) and inherited (brown bars) large SVs (>20 bp) relative to the footprint of SNVs. The footprint was computed genome-wide, in protein-coding regions and genomic regions marked by H3K4me1, H3K4me3, and H3K27ac based on data from the ENCODE Project (The ENCODE Project Consortium 2007). The y-axis shows the ratio of the average number of affected bases per offspring relative to SNVs.
Finally, we investigated differences in the genomic footprint of de novo and inherited SVs and SNVs identified in the GoNL data. We found that on average large de novo SVs (>20 bp) affect 90.6 times more genomic bases, 52.0 times more coding bases, and 60.1–114.7 times more bases marked by histone modifications than de novo SNVs (Fig. 6D). In contrast, inherited SVs affected on average only 1.6 times more bases when compared to inherited SNVs. Altogether, these data demonstrate the overall impact of de novo SVs on the genome when compared to de novo SNVs and indels.
Discussion
The human genome continuously evolves as a result of mutation and selection. Because of the relatively low rate of SV and indel formation, large numbers of parent-offspring families are required to capture the full spectrum of de novo changes that alter genome structure every generation (Campbell and Eichler 2013). Moreover, the detection and genotyping of these variants remain challenging given their diversity in both size and type (Alkan et al. 2011). Although limited by the short size of reads and the relatively low coverage depth used in this study, we have provided a representative picture of the landscape of de novo SVs and indels in the human genome based on whole-genome sequencing of 250 families by leveraging multiple calling approaches.
Our work demonstrates that both de novo indels and SVs originate primarily in the paternal germline, complementing recent findings on de novo SNVs (Kong et al. 2012; Michaelson et al. 2012; Francioli et al. 2014). We provide empirical estimates for the rate of de novo SVs and indels across the complete size spectrum, including relative frequencies of different variant sizes and types. These rates define a baseline for the general population and will help guide the interpretation of de novo indels and SVs in the diagnosis of individual patients (Stankiewicz and Lupski 2010). Roughly 15% of patients with intellectual disability or congenital abnormalities harbor an apparently causative CNV, most of which occur de novo (Hochstenbach et al. 2011). Estimating the pathogenicity of these CNVs is based on their overlap with known disease CNVs, protein-coding genes, and control databases, but should also consider the background rate of large CNVs as described here. Specifically, we find that changes in gene structure—i.e., deletion or tandem duplication of entire exons—occur at a rate of 1 in 43 offspring in the general population.
In spite of their low frequency, large de novo SVs have a substantial impact on the genome. Due to their larger size, the average genomic footprint of de novo SVs is much greater than that of de novo SNVs, and they are much more likely to hit a coding region. Indeed, 14.6% of the de novo SVs we observed affected exons, whereas only ∼1.3% of the de novo SNVs did. The considerable influence of de novo SVs is, however, primarily driven by a limited number of de novo SVs altering multiple kilobases of genomic sequence in a single generation. These rare but large variants may be quickly removed from the population by purifying selection, particularly when they hit genes or other important genomic elements (Fig. 5; Conrad et al. 2010; Mills et al. 2011). This may explain why inherited SVs and SNVs affect a similar number of bases.
Previous studies have convincingly shown that large and dramatic genome changes introduced by large structural mutations can be associated with a multitude of pathological conditions (Stankiewicz and Lupski 2010). In this study, we demonstrate that a broad range of de novo indels and structural variations is also characteristic for individuals obtained from a general human population.
Methods
Whole-genome sequencing and alignment
Genomic DNA from nucleated blood cells was obtained from 250 Dutch families (231 trios, eight quartets with DZ twins, and 11 quartets with MZ twins), which were selected without phenotypic ascertainment. Library construction and whole-genome sequencing were performed using the Illumina HiSeq 2000 platform (500-bp insert size, 90-bp paired-end reads).
Reads were aligned to the GRCh37/hg19 human genome reference using BWA 0.5.9-r164 (Li and Durbin 2009). We expected that alignment to GRCh38 would not significantly alter our findings, given that de novo variation is dependent on differences between parental and offspring genomes. Aligned data were processed following the Genome Analysis Toolkit (GATK) best practices v2 (DePristo et al. 2011): Duplicate reads were marked using Picard tools (http://picard.sourceforge.net), reads were realigned around indels using GATK IndelRealigner, and base quality scores were recalibrated using GATK BaseRecalibrator. Additional details regarding the study design, sequencing, and alignment can be found in Francioli et al. (2014).
Detection of de novo variants
Indels were called using GATK UnifiedGenotyper (DePristo et al. 2011) and Pindel (Ye et al. 2009), and all calls were further genotyped with GATK HaplotypeCaller (Supplemental Methods). We used GATK PhaseByTransmission (PBT) to call de novo variants from the GATK UnifiedGenotyper and HaplotypeCaller calls using a mutation prior of 10−4 per base per generation. We kept calls with (1) no evidence of the nonreference allele in the parents, (2) no nonreference allele called in any other GoNL sample, (3) at least two reads supporting the nonreference allele in the child, and (4) a PBT posterior of at least Q20. Pindel calls with nonreference reads in the child only, and those with at least two reads supporting the nonreference allele in the child and no significant strand bias were kept as de novo candidates. All putative de novo indels from either method were experimentally validated in 92 of the families (including seven quartets with DZ twin pairs).
De novo SVs were called and filtered independently by 11 algorithms based on the following approaches: gapped/split read mapping (Pindel [Ye et al. 2009], GATK UnifiedGenotyper [DePristo et al. 2011], GATK HaplotypeCaller); analysis of discordant pairs (BreakDancer [Chen et al. 2009], 1-2-3-SV [http://tools.genomes.nl/123sv.html; Kloosterman et al. 2011], Genome STRiP [Handsaker et al. 2011], MATE-CLEVER [Marschall et al. 2013]); and read depth analysis (CNVnator [Abyzov et al. 2011], DWAC-seq [http://tools.genomes.nl/dwac-seq.html], FACADE [Coe et al. 2010]). In addition, Mobster was used to call de novo mobile element insertions (MEIs) (Thung et al. 2014). For each algorithm, variant calls confined to offspring of a single family but not detected in any other GoNL samples were selected and visually evaluated with IGV (Robinson et al. 2011) to discard false positives due to alignment artifacts. We then created a union of all remaining calls by merging variants detected by multiple methods in the same child based on SV type and overlapping coordinates. We retained the most precise breakpoints for each variant based on the calling algorithm (in order: split-read, discordant read-pairs, read-depth). Local de novo assembly (SOAPdenovo [Luo et al. 2012]) was used for breakpoint fine-mapping for SVs > 100 bp. A detailed description of the tools, settings, filtering, and variant calls, including sensitivity analysis, is provided in the Supplemental Methods.
Experimental validation
Oligonucleotide primers for amplification of a genomic segment containing the variant (for mutations smaller than 100 bp) or variant breakpoints (for larger SVs) were designed using Primer3 software (Supplemental Table 2). PCR products were resequenced with Sanger, IonTorrent (Life Technologies), or MiSeq (Illumina, 2 × 250 bp) technologies. Genotyping of the resequenced variants is described in the Supplemental Methods.
Parental origin
We used genotypes from phased haplotypes (Francioli et al. 2014) to interrogate the parental origin of de novo indels and SVs. For indels, we identified read-pairs containing both the de novo allele and a phase-informative SNP allele.
Parental haplotypes for SVs were determined from allele ratios at overlapping SNPs. Assignment to the paternal or maternal haplotype was made if (1) one or more homozygous alleles in the offspring are located inside a de novo deletion and could only be inherited from one parent; (2) one or more polymorphic SNPs in offspring are located inside a de novo duplication and have a 2:1 (or 1:2) ratio with the reference allele and can be assigned unambiguously to either the paternal or maternal haplotype; (3) a SNP in the offspring was located within a discordant read-pair supporting the de novo SV and could be assigned to either the paternal or the maternal genome.
Paternal and familial biases
We tested for enrichment of de novo mutations on the paternal haplotypes using a one-tailed binomial test and found that both indels (P = 0.0092) and SVs (P = 0.031) were indeed enriched. Additionally, we fit a linear model to the number of de novo indels in the 99 independent offspring and the father's age at conception, correcting for coverage, but did not find a significant association (P = 0.24).
We used a multinomial model with equal probability for each child to receive a de novo variant to test for uniform distribution of variants across children (goodness-of-fit P-value obtained using 100,000 Monte Carlo replicates).
In one sample, we observed two SVs occurring on maternal Chromosome 18 at a distance of 201 kbp. We computed the probability of observing two independent deletions so closely located by direct enumeration. Let E1 and E2 be the smaller and larger deletion events, respectively, having respective lengths of L1 and L2 bases. Neglecting edge effects at the ends of chromosomes, the number of ways E1 could be placed in the genome is (G − L2 + 1) – (L1 + L2 − 1), where G is the nominal genome size. The first term represents the possible placements of E1, the second the number of placements that would result in the collapse of both events. If D is the observed distance in bp between the two events, then the number of the total placements that are significant is 2D, since E1 could be on either side of E2, implying a “two-sided” test. The ratio of these two counts represents the tailed P-value. Given G ≈ 3 × 10⁹ and the observed values L1 = 1552, L2 = 326,954, and D = 201,790, we find a P-value of 1.35 × 10⁻⁴.
Computation of mutation rates
To compute the indel rate, we used validated de novo indels in 99 children from 92 families, including 11 quartets with MZ twins, seven quartets with DZ twins, and 74 trios. We only used one child from each of the MZ twin pairs and considered the 14 children from the seven DZ twin pairs as independent for this analysis. Using permutations, we ruled out any correlation between siblings from a DZ pair (P = 0.59). The rate was computed as the sum of de novo indels divided by the sum of accessible bases in the 99 children.
The SV rate was computed over 258 children from all 250 families. Only one child was considered for each of the MZ twin pairs, and siblings from DZ twin pairs were considered as genetically independent with respect to de novo SVs. The rate was calculated by dividing the number of de novo SVs (N = 41) by the 258 children times two transmitted haplotypes. We also report the rate for de novo MEIs (N = 6, including one interchromosomal event which involved an AluY element) computed in a similar fashion.
Indel and SV formation mechanisms
Indels were annotated using the classification proposed by Montgomery et al. (2013), except for predicted hotspots (PR) that we did not use since they were not readily available and complex indels that are new in our data.
Analysis of mutation formation mechanisms of SVs was performed using BreakSeq software v. 1.3 (Lam et al. 2010). See the Supplemental Methods for a full description of indel and SV classification.
Data access
Sequence data have been submitted to the European Genome-phenome Archive (EGA; https://www.ebi.ac.uk/ega/home) under accession number EGAS00001000644.
Genome of the Netherlands Consortium
Cisca Wijmenga,20,21 Morris A. Swertz,20,21,22 P. Eline Slagboom,23 Gert-Jan B. van Ommen,24 Cornelia M. van Duijn,25 Dorret I. Boomsma,26 Jasper A. Bovenberg,27 Anton J.M. de Craen,23 Marian Beekman,23 Albert Hofman,25 Gonneke Willemsen,26 Bruce Wolffenbuttel,28 Mathieu Platteel,20 Yuanping Du,29 Ruoyan Chen,29 Hongzhi Cao,29 Rui Cao,29 Yushen Sun,29 Jeremy Sujie Cao,29 Freerk van Dijk,20,21 Pieter B.T. Neerincx,20,21 Patrick Deelen,20,21 Martijn Dijkstra,20,21 George Byelas,20,21 Alexandros Kanterakis,20,21 Jan Bot,30 Kai Ye,31 Eric-Wubbo Lameijer,23 Martijn Vermaat,22,30,32 Jeroen F.J. Laros,22,30,32 Johan T. den Dunnen,30,32 Peter de Knijff,32 Lennart C. Karssen,25 Elisa M. van Leeuwen,25 Najaf Amin,25 Vyacheslav Koval,33 Fernando Rivadeneira,33 Karol Estrada,33 Jayne Y. Hehir-Kwa,34 Joep de Ligt,34 Abdel Abdellaoui,26 Jouke-Jan Hottenga,26 V. Mathijs Kattenberg,22,26 David van Enckevort,22 Hailiang Mei,22 Mark Santcroos,35 Barbera D.C. van Schaik,35 Robert E. Handsaker,36 Steven A. McCarroll,36,37 Evan E. Eichler,38 Arthur Ko,38 Peter Sudmant,38 Laurent C. Francioli,39 Wigard P. Kloosterman,39 Isaac J. Nijman,39 Victor Guryev,40 Paul I.W. de Bakker,39,41
Supplementary Material
Acknowledgments
We thank Matt Wyczalkowski for help with illustrations and Craig Grove for text editing. The GoNL Project is funded by the Biobanking and Biomolecular Research Infrastructure (BBMRI-NL), which is financed by the Netherlands Organization for Scientific Research (NWO project 184.021.007).
Author contributions: W.P.K., L.C.F., V.G., and K.Y. planned and directed the research. C.W., C.M.D., G.O., P.E.S., D.I.B., and P.I.W.dB. supervised the GoNL data generation. M.S. supervised read mapping. J.Y.H.K., A.S., T.M., F.H., B.P.C., A.A., E.L., D.T.T., M.M., R.E.H., V.G., K.Y., L.C.F., and V.K. performed SV and indel calling. I.R., E.C., P.A., W.P.K., and L.K. performed validation assays and analysis. E.D.S., C.W., A.U., and D.B. provided DNA samples for validation. M.J.R., L.C.F., and V.G. performed phasing of indels and SVs. M.C.W., T.M., and A.S. provided input for statistical testing. M.McV. provided input on indel formation mechanisms. W.P.K., L.C.F., K.Y., and V.G. wrote the manuscript. F.H., C.W., T.M., A.S., J.H.K., E.C., M.C.W., C.M.D., D.B., A.A., E.E., and P.I.W.B. commented on the manuscript.
Footnotes
Department of Genetics, University of Groningen, University Medical Center Groningen, Groningen 9700RB, The Netherlands
Genomics Coordination Center, University of Groningen, University Medical Center Groningen, Groningen 9700RB, The Netherlands
Netherlands Bioinformatics Centre, Nijmegen 6245 GA, The Netherlands
Department of Medical Statistics and Bioinformatics, Leiden University Medical Center, Leiden 2300RC, The Netherlands
Department of Human Genetics, Leiden University Medical Center, Leiden 2300RC, The Netherlands
Department of Epidemiology, Erasmus Medical Center, Rotterdam 3000CA, The Netherlands
Department of Biological Psychology, VU University Amsterdam, Amsterdam 1081BT, The Netherlands
Legal Pathways Institute for Health and Bio Law, Aerdenhout, The Netherlands
University Medical Center Groningen, Groningen 9700RB, The Netherlands
BGI, Shenzhen 518083, China
Leiden University, Leiden 2300RA, The Netherlands
The Genome Institute, Washington University, St. Louis, Missouri 63108, USA
Leiden University Medical Center, Leiden 2300RC, The Netherlands
Department of Internal Medicine, Erasmus Medical Center, Rotterdam 3000CA, The Netherlands
Department of Human Genetics, Radboud University Medical Center, Nijmegen 6525GA, The Netherlands
Amsterdam Medical Center, Amsterdam 1105 AZ, The Netherlands
Department of Genetics, Harvard Medical School, Boston, Massachusetts 02115, USA
Broad Institute of Harvard and MIT, Cambridge, Massachusetts 02142, USA
Department of Genome Sciences, University of Washington, Seattle, Washington 98105, USA
Department of Medical Genetics, Center for Molecular Medicine, University Medical Center Utrecht, Utrecht 3584CG, The Netherlands
European Research Institute for the Biology of Ageing, University of Groningen, University Medical Center Groningen, Groningen 9713AD, The Netherlands
Department of Epidemiology, University Medical Center Utrecht, Utrecht 3584CG, The Netherlands
[Supplemental material is available for this article.]
Article published online before print. Article, supplemental material, and publication date are at http://www.genome.org/cgi/doi/10.1101/gr.185041.114.
References
- Abyzov A, Urban AE, Snyder M, Gerstein M. 2011. CNVnator: an approach to discover, genotype, and characterize typical and atypical CNVs from family and population genome sequencing. Genome Res 21: 974–984. [DOI] [PMC free article] [PubMed] [Google Scholar]
- Alkan C, Coe BP, Eichler EE. 2011. Genome structural variation discovery and genotyping. Nat Rev Genet 12: 363–376. [DOI] [PMC free article] [PubMed] [Google Scholar]
- Batista DAS, Pai GS, Stetten G. 1994. Molecular analysis of a complex chromosomal rearrangement and a review of familial cases. Am J Med Genet 53: 255–263. [DOI] [PubMed] [Google Scholar]
- Belancio VP, Hedges DJ, Deininger P. 2008. Mammalian non-LTR retrotransposons: for better or worse, in sickness and in health. Genome Res 18: 343–358. [DOI] [PubMed] [Google Scholar]
- Besenbacher S, Liu S, Izarzugaza JMG, Grove J, Belling K, Bork-Jensen J, Huang S, Als TD, Li S, Yadav R, et al. 2015. Novel variation and de novo mutation rates in population-wide de novo assembled Danish trios. Nat Commun 6: 59–69. [DOI] [PMC free article] [PubMed] [Google Scholar]
- Bhangale TR, Rieder MJ, Livingston RJ, Nickerson DA. 2005. Comprehensive identification and characterization of diallelic insertion-deletion polymorphisms in 330 human candidate genes. Hum Mol Genet 14: 59–69. [DOI] [PubMed] [Google Scholar]
- Boomsma DI, Wijmenga C, Slagboom EP, Swertz MA, Karssen LC, Abdellaoui A, Ye K, Guryev V, Vermaat M, van Dijk F, et al. 2014. The Genome of the Netherlands: design, and project goals. Eur J Hum Genet 22: 221–227. [DOI] [PMC free article] [PubMed] [Google Scholar]
- Burns KH, Boeke JD. 2012. Human transposon tectonics. Cell 149: 740–752. [DOI] [PMC free article] [PubMed] [Google Scholar]
- Campbell CD, Eichler EE. 2013. Properties and rates of germline mutations in humans. Trends Genet 29: 575–584. [DOI] [PMC free article] [PubMed] [Google Scholar]
- Chen K, Wallis JW, McLellan MD, Larson DE, Kalicki JM, Pohl CS, McGrath SD, Wendl MC, Zhang Q, Locke DP, et al. 2009. BreakDancer: an algorithm for high-resolution mapping of genomic structural variation. Nat Methods 6: 677–681. [DOI] [PMC free article] [PubMed] [Google Scholar]
- Cheng Z, Ventura M, She X, Khaitovich P, Graves T, Osoegawa K, Church D, DeJong P, Wilson RK, Pääbo S, et al. 2005. A genome-wide comparison of recent chimpanzee and human segmental duplications. Nature 437: 88–93. [DOI] [PubMed] [Google Scholar]
- Coe BP, Chari R, MacAulay C, Lam WL. 2010. FACADE: a fast and sensitive algorithm for the segmentation and calling of high resolution array CGH data. Nucleic Acids Res 38: e157. [DOI] [PMC free article] [PubMed] [Google Scholar]
- Conrad DF, Pinto D, Redon R, Feuk L, Gokcumen O, Zhang Y, Aerts J, Andrews TD, Barnes C, Campbell P, et al. 2010. Origins and functional impact of copy number variation in the human genome. Nature 464: 704–712. [DOI] [PMC free article] [PubMed] [Google Scholar]
- Conrad DF, Keebler JEM, DePristo MA, Lindsay SJ, Zhang Y, Casals F, Idaghdour Y, Hartl CL, Torroja C, Garimella KV, et al. 2011. Variation in genome-wide mutation rates within and between human families. Nat Genet 43: 712–714. [DOI] [PMC free article] [PubMed] [Google Scholar]
- Cooper GM, Coe BP, Girirajan S, Rosenfeld JA, Vu TH, Baker C, Williams C, Stalker H, Hamid R, Hannig V, et al. 2011. A copy number variation morbidity map of developmental delay. Nat Genet 43: 838–846. [DOI] [PMC free article] [PubMed] [Google Scholar]
- DePristo MA, Banks E, Poplin R, Garimella KV, Maguire JR, Hartl C, Philippakis AA, del Angel G, Rivas MA, Hanna M, et al. 2011. A framework for variation discovery and genotyping using next-generation DNA sequencing data. Nat Genet 43: 491–498. [DOI] [PMC free article] [PubMed] [Google Scholar]
- The Encode Project Consortium. 2007. Identification and analysis of functional elements in 1% of the human genome by the ENCODE pilot project. Nature 447: 799–816. [DOI] [PMC free article] [PubMed] [Google Scholar]
- Francioli LC, Menelaou A, Pulit SL, van Dijk F, Palamara PF, Elbers CC, Neerincx PBT, Ye K, Guryev V, Kloosterman WP, et al. 2014. Whole-genome sequence variation, population structure and demographic history of the Dutch population. Nat Genet 46: 818–825. [DOI] [PubMed] [Google Scholar]
- Gilissen C, Hehir-Kwa JY, Thung DT, van de Vorst M, van Bon BWM, Willemsen MH, Kwint M, Janssen IM, Hoischen A, Schenck A, et al. 2014. Genome sequencing identifies major causes of severe intellectual disability. Nature 511: 344–347. [DOI] [PubMed] [Google Scholar]
- Handsaker RE, Korn JM, Nemesh J, McCarroll SA. 2011. Discovery and genotyping of genome structural polymorphism by sequencing on a population scale. Nat Genet 43: 269–276. [DOI] [PMC free article] [PubMed] [Google Scholar]
- Hastings PJ, Lupski JR, Rosenberg SM, Ira G. 2009. Mechanisms of change in gene copy number. Nat Rev Genet 10: 551–564. [DOI] [PMC free article] [PubMed] [Google Scholar]
- Hehir-Kwa JY, Rodriguez-Santiago B, Vissers LE, de Leeuw N, Pfundt R, Buitelaar JK, Perez-Jurado LA, Veltman JA. 2011. De novo copy number variants associated with intellectual disability have a paternal origin and age bias. J Med Genet 48: 776–778. [DOI] [PubMed] [Google Scholar]
- Hochstenbach R, Buizer-Voskamp JE, Vorstman JAS, Ophoff RA. 2011. Genome arrays for the detection of copy number variations in idiopathic mental retardation, idiopathic generalized epilepsy and neuropsychiatric disorders: lessons for diagnostic workflow and research. Cytogenet Genome Res 135: 174–202. [DOI] [PubMed] [Google Scholar]
- Iafrate AJ, Feuk L, Rivera MN, Listewnik ML, Donahoe PK, Qi Y, Scherer SW, Lee C. 2004. Detection of large-scale variation in the human genome. Nat Genet 36: 949–951. [DOI] [PubMed] [Google Scholar]
- Itsara A, Wu H, Smith JD, Nickerson DA, Romieu I, London SJ, Eichler EE. 2010. De novo rates and selection of large copy number variation. Genome Res 20: 1469–1481. [DOI] [PMC free article] [PubMed] [Google Scholar]
- Jiang Y, Yuen RKC, Jin X, Wang M, Chen N, Wu X, Ju J, Mei J, Shi Y, He M, et al. 2013. Detection of clinically relevant genetic variants in autism spectrum disorder by whole-genome sequencing. Am J Hum Genet 93: 249–263. [DOI] [PMC free article] [PubMed] [Google Scholar]
- Kidd JM, Graves T, Newman TL, Fulton R, Hayden HS, Malig M, Kallicki J, Kaul R, Wilson RK, Eichler EE. 2010. A human genome structural variation sequencing resource reveals insights into mutational mechanisms. Cell 143: 837–847. [DOI] [PMC free article] [PubMed] [Google Scholar]
- Kloosterman WP, Guryev V, van Roosmalen M, Duran KJ, de Bruijn E, Bakker SCM, Letteboer T, van Nesselrooij B, Hochstenbach R, Poot M, et al. 2011. Chromothripsis as a mechanism driving complex de novo structural rearrangements in the germline. Hum Mol Genet 20: 1916–1924. [DOI] [PubMed] [Google Scholar]
- Kondrashov AS. 2003. Direct estimates of human per nucleotide mutation rates at 20 loci causing Mendelian diseases. Hum Mutat 21: 12–27. [DOI] [PubMed] [Google Scholar]
- Kong A, Frigge ML, Masson G, Besenbacher S, Sulem P, Magnusson G, Gudjonsson SA, Sigurdsson A, Jonasdottir A, Jonasdottir A, et al. 2012. Rate of de novo mutations and the importance of father's age to disease risk. Nature 488: 471–475. [DOI] [PMC free article] [PubMed] [Google Scholar]
- Korbel JO, Urban AE, Affourtit JP, Godwin B, Grubert F, Simons JF, Kim PM, Palejev D, Carriero NJ, Du L, et al. 2007. Paired-end mapping reveals extensive structural variation in the human genome. Science 318: 420–426. [DOI] [PMC free article] [PubMed] [Google Scholar]
- Kozyrev SV, Abelson A-K, Wojcik J, Zaghlool A, Linga Reddy MVP, Sanchez E, Gunnarsson I, Svenungsson E, Sturfelt G, Jönsen A, et al. 2008. Functional variants in the B-cell gene BANK1 are associated with systemic lupus erythematosus. Nat Genet 40: 211–216. [DOI] [PubMed] [Google Scholar]
- Lam HYK, Mu XJ, Stütz AM, Tanzer A, Cayting PD, Snyder M, Kim PM, Korbel JO, Gerstein MB. 2010. Nucleotide-resolution analysis of structural variants using BreakSeq and a breakpoint library. Nat Biotechnol 28: 47–55. [DOI] [PMC free article] [PubMed] [Google Scholar]
- Levy S, Sutton G, Ng PC, Feuk L, Halpern AL, Walenz BP, Axelrod N, Huang J, Kirkness EF, Denisov G, et al. 2007. The diploid genome sequence of an individual human. PLoS Biol 5: 2113–2144. [DOI] [PMC free article] [PubMed] [Google Scholar]
- Li H, Durbin R. 2009. Fast and accurate short read alignment with Burrows-Wheeler transform. Bioinformatics 25: 1754–1760. [DOI] [PMC free article] [PubMed] [Google Scholar]
- Londin ER, Keller MA, D'Andrea MR, Delgrosso K, Ertel A, Surrey S, Fortina P. 2011. Whole-exome sequencing of DNA from peripheral blood mononuclear cells (PBMC) and EBV-transformed lymphocytes from the same donor. BMC Genomics 12: 464. [DOI] [PMC free article] [PubMed] [Google Scholar]
- Luo R, Liu B, Xie Y, Li Z, Huang W, Yuan J, He G, Chen Y, Pan Q, Liu Y, et al. 2012. SOAPdenovo2: an empirically improved memory-efficient short-read de novo assembler. Gigascience 1: 18. [DOI] [PMC free article] [PubMed] [Google Scholar]
- Lynch M. 2010. Rate, molecular spectrum, and consequences of human mutation. Proc Natl Acad Sci 107: 961–968. [DOI] [PMC free article] [PubMed] [Google Scholar]
- Marschall T, Hajirasouliha I, Schönhuth A. 2013. MATE-CLEVER: Mendelian-inheritance-aware discovery and genotyping of midsize and long indels. Bioinformatics 29: 3143–3150. [DOI] [PMC free article] [PubMed] [Google Scholar]
- McVey M, Lee SE. 2008. MMEJ repair of double-strand breaks (director's cut): deleted sequences and alternative endings. Trends Genet 24: 529–538. [DOI] [PMC free article] [PubMed] [Google Scholar]
- Michaelson JJ, Shi Y, Gujral M, Zheng H, Malhotra D, Jin X, Jian M, Liu G, Greer D, Bhandari A, et al. 2012. Whole-genome sequencing in autism identifies hot spots for de novo germline mutation. Cell 151: 1431–1442. [DOI] [PMC free article] [PubMed] [Google Scholar]
- Mills RE, Walter K, Stewart C, Handsaker RE, Chen K, Alkan C, Abyzov A, Yoon SC, Ye K, Cheetham RK, et al. 2011. Mapping copy number variation by population-scale genome sequencing. Nature 470: 59–65. [DOI] [PMC free article] [PubMed] [Google Scholar]
- Montgomery SB, Goode DL, Kvikstad E, Albers CA, Zhang ZD, Mu XJ, Ananda G, Howie B, Karczewski KJ, Smith KS, et al. 2013. The origin, evolution, and functional impact of short insertion-deletion variants identified in 179 human genomes. Genome Res 23: 749–761. [DOI] [PMC free article] [PubMed] [Google Scholar]
- Pang AW, MacDonald JR, Pinto D, Wei J, Rafiq MA, Conrad DF, Park H, Hurles ME, Lee C, Venter JC, et al. 2010. Towards a comprehensive structural variation map of an individual human genome. Genome Biol 11: R52. [DOI] [PMC free article] [PubMed] [Google Scholar]
- Pang AWC, Migita O, Macdonald JR, Feuk L, Scherer SW. 2013. Mechanisms of formation of structural variation in a fully sequenced human genome. Hum Mutat 34: 345–354. [DOI] [PubMed] [Google Scholar]
- Ramu A, Noordam MJ, Schwartz RS, Wuster A, Hurles ME, Cartwright RA, Conrad DF. 2013. DeNovoGear: de novo indel and point mutation discovery and phasing. Nat Methods 10: 985–987. [DOI] [PMC free article] [PubMed] [Google Scholar]
- Redon R, Ishikawa S, Fitch KR, Feuk L, Perry GH, Andrews TD, Fiegler H, Shapero MH, Carson AR, Chen W, et al. 2006. Global variation in copy number in the human genome. Nature 444: 444–454. [DOI] [PMC free article] [PubMed] [Google Scholar]
- Robinson JT, Thorvaldsdóttir H, Winckler W, Guttman M, Lander ES, Getz G, Mesirov JP. 2011. Integrative genomics viewer. Nat Biotechnol 29: 24–26. [DOI] [PMC free article] [PubMed] [Google Scholar]
- Roerink SF, van Schendel R, Tijsterman M. 2014. Polymerase θ-mediated end joining of replication-associated DNA breaks in C. elegans. Genome Res 24: 954–962. [DOI] [PMC free article] [PubMed] [Google Scholar]
- Romeo G, Hassan HJ, Staempfli S, Roncuzzi L, Cianetti L, Leonardi A, Vicente V, Mannucci PM, Bertina R, Peschle C. 1987. Hereditary thrombophilia: identification of nonsense and missense mutations in the protein C gene. Proc Natl Acad Sci 84: 2829–2832. [DOI] [PMC free article] [PubMed] [Google Scholar]
- Scally A, Durbin R. 2012. Revising the human mutation rate: implications for understanding human evolution. Nat Rev Genet 13: 745–753. [DOI] [PubMed] [Google Scholar]
- Sebat J, Lakshmi B, Troge J, Alexander J, Young J, Lundin P, Månér S, Massa H, Walker M, Chi M, et al. 2004. Large-scale copy number polymorphism in the human genome. Science 305: 525–528. [DOI] [PubMed] [Google Scholar]
- Sebat J, Lakshmi B, Malhotra D, Troge J, Lese-Martin C, Walsh T, Yamrom B, Yoon S, Krasnitz A, Kendall J, et al. 2007. Strong association of de novo copy number mutations with autism. Science 316: 445–449. [DOI] [PMC free article] [PubMed] [Google Scholar]
- Stankiewicz P, Lupski JR. 2010. Structural variation in the human genome and its role in disease. Annu Rev Med 61: 437–455. [DOI] [PubMed] [Google Scholar]
- Stewart C, Kural D, Strömberg MP, Walker JA, Konkel MK, Stütz AM, Urban AE, Grubert F, Lam HYK, Lee WP, et al. 2011. A comprehensive map of mobile element insertion polymorphisms in humans. PLoS Genet 7: e1002236. [DOI] [PMC free article] [PubMed] [Google Scholar]
- Stranger BE, Forrest MS, Dunning M, Ingle CE, Beazley C, Thorne N, Redon R, Bird CP, de Grassi A, Lee C, et al. 2007. Relative impact of nucleotide and copy number variation on gene expression phenotypes. Science 315: 848–853. [DOI] [PMC free article] [PubMed] [Google Scholar]
- Thung DT, de Ligt J, Vissers LE, Steehouwer M, Kroon M, de Vries P, Slagboom EP, Ye K, Veltman JA, Hehir-Kwa JY. 2014. Mobster: accurate detection of mobile element insertions in next generation sequencing data. Genome Biol 15: 488. [DOI] [PMC free article] [PubMed] [Google Scholar]
- Tuzun E, Sharp AJ, Bailey JA, Kaul R, Morrison VA, Pertz LM, Haugen E, Hayden H, Albertson D, Pinkel D, et al. 2005. Fine-scale structural variation of the human genome. Nat Genet 37: 727–732. [DOI] [PubMed] [Google Scholar]
- Veltman JA, Brunner HG. 2012. De novo mutations in human genetic disease. Nat Rev Genet 13: 565–575. [DOI] [PubMed] [Google Scholar]
- Walsh T, McClellan JM, McCarthy SE, Addington AM, Pierce SB, Cooper GM, Nord AS, Kusenda M, Malhotra D, Bhandari A, et al. 2008. Rare structural variants disrupt multiple genes in neurodevelopmental pathways in schizophrenia. Science 320: 539–543. [DOI] [PubMed] [Google Scholar]
- Ye K, Schulz MH, Long Q, Apweiler R, Ning Z. 2009. Pindel: a pattern growth approach to detect break points of large deletions and medium sized insertions from paired-end short reads. Bioinformatics 25: 2865–2871. [DOI] [PMC free article] [PubMed] [Google Scholar]
- Yu AM, McVey M. 2010. Synthesis-dependent microhomology-mediated end joining accounts for multiple types of repair junctions. Nucleic Acids Res 38: 5706–5717. [DOI] [PMC free article] [PubMed] [Google Scholar]
Associated Data
This section collects any data citations, data availability statements, or supplementary materials included in this article.