

Abstract
Clusters of functionally related genes can be disrupted by a single copy number variant (CNV). We demonstrate that the simultaneous disruption of multiple functionally related genes is a frequent and significant characteristic of de novo CNVs in patients with developmental disorders (P = 1 × 10⁻³). Using three different functional networks, we identified unexpectedly large numbers of functionally related genes within de novo CNVs from two large independent cohorts of individuals with developmental disorders. The presence of multiple functionally related genes was a significant predictor of a CNV's pathogenicity when compared to CNVs from apparently healthy individuals and a better predictor than the presence of known disease or haploinsufficient genes for larger CNVs. The functionally related genes found in the de novo CNVs belonged to 70% of all clusters of functionally related genes found across the genome. De novo CNVs were more likely to affect functional clusters and affect them to a greater extent than benign CNVs (P = 6 × 10⁻⁴). Furthermore, such clusters of functionally related genes are phenotypically informative: Different patients possessing CNVs that affect the same cluster of functionally related genes exhibit more similar phenotypes than expected (P < 0.05). The spanning of multiple functionally similar genes by single CNVs contributes substantially to how these variants exert their pathogenic effects.
Proteins rarely act in isolation; they participate in large interacting networks. Genes and their protein products can interact in a variety of ways: Proteins physically interact, regulate gene expression, modify the activity of other proteins, or catalyze sequential metabolic reactions. Genes encoding functionally related proteins tend to be located close together in the genomes of human (Caron et al. 2001; Lee and Sonnhammer 2003; Fukuoka et al. 2004; Singer et al. 2005; Sémon and Duret 2006; Makino and McLysaght 2008; Michalak 2008; Al-Shahrour et al. 2010), yeast (Cohen et al. 2000; Pal and Hurst 2003; Poyatos and Hurst 2006), mouse (Li et al. 2005; Singer et al. 2005), fly (Spellman and Rubin 2002; Mezey et al. 2008; Weber and Hurst 2011), worm (Kamath et al. 2003), and zebrafish (Ng et al. 2009). Significant clustering of functionally related genes in the genome (hereafter termed “functional clustering”) has been identified using protein–protein interactions (Poyatos and Hurst 2006; Makino and McLysaght 2009), KEGG pathways (Lee and Sonnhammer 2003), Gene Ontology terms (Al-Shahrour et al. 2010), and phenotypes exhibited from gene knockdowns (Kamath et al. 2003). Clusters of broadly expressed housekeeping genes (Lercher et al. 2002; Singer et al. 2005; Michalak 2008; Weber and Hurst 2011), and clusters of coexpressed or tissue-specific genes (Cohen et al. 2000; Caron et al. 2001; Fukuoka et al. 2004; Li et al. 2005; Mezey et al. 2008; Ng et al. 2009; Weber and Hurst 2011) have previously been reported in humans and other eukaryotes. However, the extent of functional clustering in the genome varies according to the methodology used (Lercher et al. 2002; Michalak 2008; Weber and Hurst 2011). All previous studies of functional clustering have been limited by their dependence on a single source of functional information with which to identify functional clusters. Each source of functional information, however, captures only a subset of possible functional relationships and thus will be incomplete. By combining multiple sources of information, functional predictions are improved (Troyanskaya et al. 2003; Deng et al. 2004; Lee et al. 2004), but this technique has yet to be applied when examining functional clustering within the genome.
The importance of functional clustering in human disease has not yet been demonstrated. Mutations that affect multiple genes close together in the genome may incur compounding deleterious effects if the affected genes participate in the same biological process. Recent studies of copy number variants (CNVs; deletions or duplications >1 kb in size) have revealed instances in which multiple functionally related candidate genes are affected by a single variant (Boulding and Webber 2012; Golzio et al. 2012; Doelken et al. 2013). Boulding and Webber (2012) and Doelken et al. (2013) each found multiple genes within single CNVs that when individually knocked out in model organisms cause phenotypes similar to those observed in the respective patient (Boulding and Webber 2012; Doelken et al. 2013). Golzio et al. (2012) found that KCTD13, MVP, and MAPK3, which are present within the 16p11.2 CNV locus, interact to produce microcephaly or macrocephaly when their orthologs were concurrently overexpressed or underexpressed, respectively, in zebrafish (Golzio et al. 2012).
In light of the existence of functional clusters, we examine how the simultaneous copy change of multiple functionally related genes contributes to the pathogenic effects of CNVs. We investigated the prevalence and extent of functional clustering within de novo CNVs in individuals with developmental disorders and identify similar clusters present throughout the genome. In addition, we examined the functional clusters for the presence of known disease genes and tested their ability to distinguish pathogenic CNVs from those found in control individuals. Finally, we considered whether patients with CNVs affecting the same functional cluster exhibit similar phenotypes.
Results
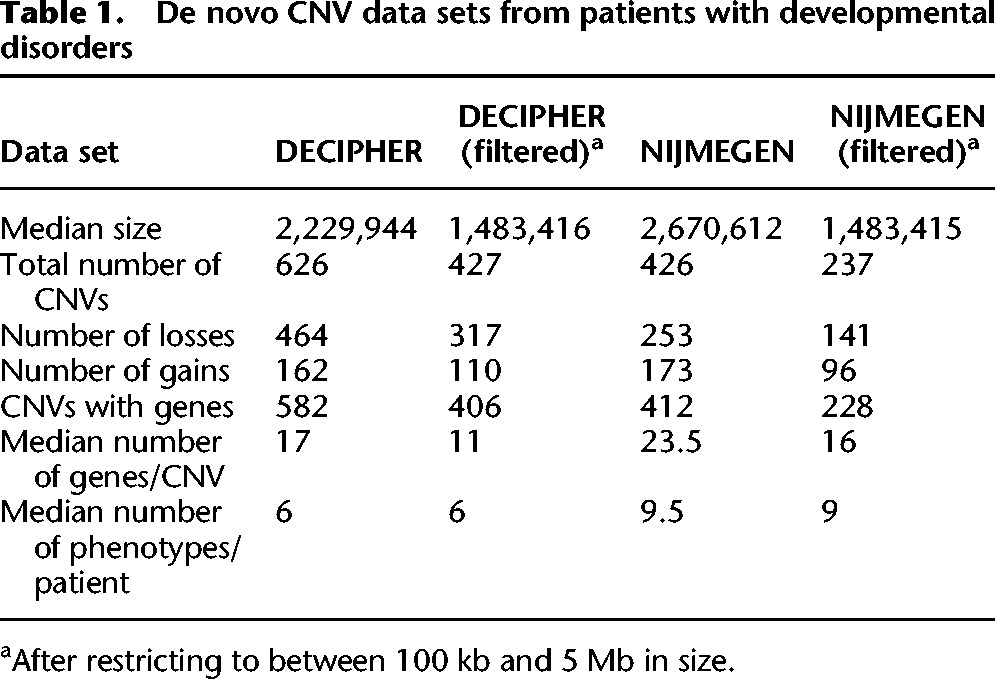
A large deletion or duplication (copy number variant [CNV]) affecting multiple functionally related genes could incur compounding deleterious effects (e.g., by epistasis), whereas a CNV overlapping functionally unrelated genes would not. We examined two independent data sets of de novo CNVs, 626 from the Database of Chromosomal Imbalance and Phenotype in Humans Using Ensembl Resources (DECIPHER) (Firth et al. 2009) and 426 from the Department of Human Genetics, Radboud University Medical Center (NIJMEGEN) (Vulto-van Silfhout et al. 2013) that had been identified in the genomes of patients with developmental disorders, for functionally related genes that could contribute to patients’ phenotypes (Table 1).
Table 1.
De novo CNV data sets from patients with developmental disorders
Measuring functional similarity
We sought to determine the functional similarity among genes found within each de novo CNV. Functional similarity can be inferred from known pathways and functions, coexpression patterns, protein–protein interaction (PPI) experiments, sequence information, and phenotypes seen in model organisms, each having different errors and covering a different subset of genes. Unlike previous studies of functional clustering (Lee and Sonnhammer 2003; Singer et al. 2005; Sémon and Duret 2006; Makino and McLysaght 2008; Al-Shahrour et al. 2010), we used an integrated network, which represents genes as nodes and the likelihood or strength of an interaction based on multiple sources of evidence as weighted edges between them. This network was obtained by augmenting the integrated network described in Honti et al. (2014) with mouse phenotype data from the Mouse Genome Database (Bult et al. 2008) (see Methods), which increased the number of edges 10-fold and improved the functional specificity (Supplemental Fig. S1). The resulting Phenotypic Linkage Network (PLN) combines all data sources (Supplemental Table S1) into a single network containing 17,039 genes connected by 10,792,987 edges representing gene–gene pairwise functional similarities. To conservatively consider whether genes formed part of a functional cluster, we considered only pairs of genes connected by the top 1% of the 142,864,287 shortest paths in this network (Supplemental Table S2). We confirmed our major findings using two additional networks: HumanNet (Lee et al. 2011), a publicly available integrated functional network; and COXPRESdb (Obayashi et al. 2008), a coexpression network, again using the top 1% shortest paths in each. However, we focused on results obtained using the PLN for detailed analyses due to its greater coverage of genes than HumanNet (Supplemental Table S2) and the demonstrated superiority of integrated functional networks over coexpression-only or protein–protein interaction-only networks at predicting gene function (Troyanskaya et al. 2003; Deng et al. 2004; Lee et al. 2004).
CNVs contain significantly large functional clusters
Controlling for CNV size using gene-number-matched randomizations (see Methods), both de novo CNV data sets were found to overlap significantly large functional clusters, although the frequency of CNVs affecting any functional cluster (at least two functionally related genes) was significant in only one data set: 49.4% (44% expected, P = 0.001) of DECIPHER CNVs contained a functional cluster with an average size of 3.46 genes (P = 0.0217); and 54% (50% expected, P = 0.07) of NIJMGEN CNVs contained a functional cluster of 3.69 genes, on average (P = 0.0005) (Fig. 1). To ensure that these functional clusters do not simply reflect recent tandem gene duplications whose functions have not diverged substantially, paralogous genes, identified in OPTIC (Heger and Ponting 2008) or Ensembl (Vilella et al. 2009) using zebrafish as the out-group, were counted as a single copy. Subsequently, functional clusters remained significantly large and on average contained more genes (DECIPHER 3.54 genes/cluster, P = 0.0010; NIJMEGEN 3.80 genes/cluster, P = 0.0001). Since including paralogs results in a slight decrease in the average size of functional clusters within CNVs, we infer that these duplicated genes tend to form separate small clusters rather than contributing to the larger functional clusters, which include nonparalogous genes. A large number of CNVs contain larger functional clusters than expected, including both deletions and duplications (Fig. 1D; Supplemental Fig. S2). In subsequent analyses, results are reported after collapsing paralogous genes unless otherwise specified. The presence of significantly large functional clusters in de novo CNVs was largely robust to variation in network or clustering threshold (Supplemental Fig. S3).
Figure 1.

De novo CNVs from patients with developmental disorders contain significantly large numbers of functionally similar genes, as defined by proximity in the phenotypic linkage network (PLN). (Blue) DECIPHER, (red) NIJMEGEN. (A,B) DECIPHER (A) and NIJMEGEN (B) de novo CNVs contain significantly large functional clusters compared to 10,000 gene-number-matched randomizations, the significance of which increases when paralogous genes within the same CNV are collapsed to a single copy. Arrows indicate observed value and P-value. (C) The largest functional cluster is most significant in both data sets. The size of the circle indicates the average cluster size, light gray line indicates P = 0.05, and data sets are offset due to high overlap. (D) Thirty percent of de novo CNVs contain a functional cluster that is larger than expected (points, gray line indicate P = 0.5); shaded areas indicate 95% confidence intervals given a uniform distribution of P-values. The respective patients were not significantly enriched for any phenotype (hypergeometric test with Bonferroni correction). (E,F) More DECIPHER (E) and NIJMEGEN (F) de novo CNVs contain functional clusters compared to 10,000 gene-number-matched randomizations. Only DECIPHER was significantly different. Arrows indicate observed value and P-value.
De novo CNVs tend to contain one large functional cluster
On average, de novo CNVs contained 2.0 and 1.8 distinct functional clusters (P > 0.05) for DECIPHER and NIJMEGEN CNVs, respectively. The largest cluster in each CNV tended to be far larger than the second or third largest clusters. The largest cluster contained on average 4.83 and 4.92 genes for DECIPHER and NIJMEGEN, respectively, and was the most significantly large compared to 10,000 gene-number-matched randomizations (P = 0.0002, P = 0.0002), whereas the second and third largest clusters were only slightly larger than the minimum size of two genes (P > 0.01) (Fig. 1C). These observations were largely robust to the network and clustering parameter used (Supplemental Fig. S3).
In summary, roughly half the de novo CNVs overlapped at least one cluster of functionally related genes, and these clusters were significantly large (Fig. 1). In particular, the single largest cluster of functionally related genes of approximately five genes was highly significant in both DECIPHER and NIJMEGEN de novo CNVs.
Clusters of functionally related genes explain CNV pathogenicity beyond known disease genes
De novo CNVs are often pathogenic, and functional clusters within these CNVs may contribute to their pathogenicity. Functional clusters found in DECIPHER and NIJMEGEN CNVs were significantly enriched in (1) known disease genes from the Online Mendelian Inheritance in Man (OMIM) database (OMIM 2012), (2) known haploinsufficient (HIS) genes (Dang et al. 2008), (3) genes recurrently hit in multiple patients, and (4) genes associated with the respective patient's phenotype in the Human Phenotype Ontology (HPO) (Fig. 2; Dolken et al. 2012). The largest cluster in each CNV was the most enriched (Supplemental Fig. S4). However, the pathogenicity of de novo CNVs was not solely explained by the presence of these disease or HIS genes. Logistic regression was used to distinguish the ability of functional clusters from that of disease and HIS genes to differentiate the combined set of 664 de novo CNVs from a set of 2478 CNVs identified in healthy individuals (Shaikh et al. 2009). When functional clusters, disease genes, and HIS genes were included in the model, they were each significant (P < 10−20, P = 4.4 × 10⁻¹⁷, P = 3.0 × 10⁻¹¹, respectively) with the presence of a functional cluster within a CNV having the greatest effect (odds ratios: cluster = 9.0, OMIM gene = 3.0 and HIS gene = 3.3). Clusters of functionally related genes were more specific to pathogenic CNVs than either OMIM or HIS genes: Half of pathogenic CNVs affected a cluster of functionally related genes but only 4% of benign CNVs affected one (Fig. 3). In contrast, known disease genes were present in 13% of benign CNV; and HIS genes were present in only a third of pathogenic CNVs. In addition, we compared the presence of a functional cluster to the LOD-score (log-odds score) of at least one of the genes being haploinsufficient as defined in Huang et al. (2010). This score combines information from multiple genes in the CNV but is based on a model of only a single likely deleterious gene being sufficient to render the CNV to be pathogenic. Again, when both were put into a combined logistic regression, both factors were significant predictors of pathogenicity; OR cluster = 2.5 (P = 0.0033), OR HIS-LOD = 1.4 (P < 10−15). To make the comparison more even, we dichotomized the HIS-LOD score according to the logistic regression of CNV pathogenicity against the continuous HIS-LOD score taking a threshold of HIS-LOD = 5.09 (the point at which the logistic regression predicts a 50% chance of the CNV being pathogenic). Combining this dichotomized score with the binary presence/absence of a functional cluster resulted in both being significant predictors (P < 10−10) though clusters were less strong than the HIS-LOD (OR cluster = 8.4, OR dichotomized LOD = 10.8). This highlights the importance of considering the contribution of multiple genes to the pathogenicity of a CNV rather than attempting to identify a single causal disease gene within the CNV.
Figure 2.
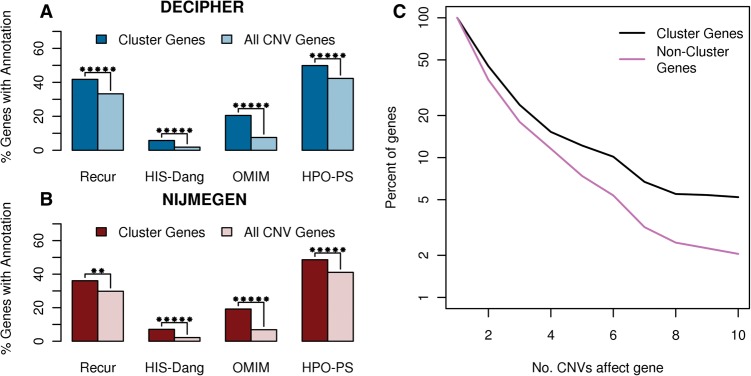
Enrichment of various disease-relevant annotations in functional clusters respectively compared to all genes in their CNVs. The enrichment of disease genes in DECIPHER (A) and NIJMEGEN (B) functional clusters. Recur indicates genes found in more than one de novo CNV in the same data set, HIS-Dang are haploinsufficient genes identified in Dang et al. (2008), OMIM are genes causally related to a disease in the OMIM database (OMIM 2012) and HPO-PS are candidate genes specifically associated with the respective patient's phenotype based on gene-phenotype annotations in the Human Phenotype Ontology database (Dolken et al. 2012). Stars indicate significance: (*) P < 0.05, (**) P < 0.005, (***) P < 0.0005, etc. up to a maximum of five stars. (C) Survivorship curve indicating the frequency of functional cluster genes in recurrent regions compared to CNV genes not belonging to clusters of functionally related genes. The more frequently a gene was seen affected by de novo CNVs, the greater the chance it belongs to a functional cluster.
Figure 3.
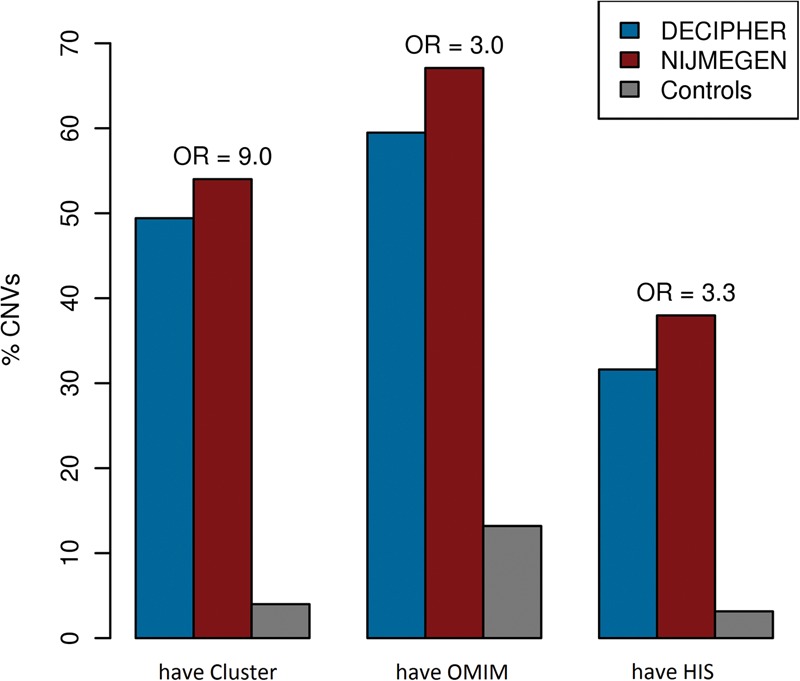
The presence of clusters of functionally related genes in a CNV is a more specific or more sensitive predictor of pathogenicity than the presence of OMIM or HIS genes. The percentage of CNVs which contain at least one functional cluster (have Cluster), disease gene from OMIMan (have OMIM) (OMIM 2012), or haploinsufficient gene (have HIS) from Dang et al. (2008). The height of the DECIPHER (blue) and NIJMEGEN (red) bars indicates the sensitivity of the predictor to pathogenic CNVs, whereas the height of control (gray) bars indicates the specificity of each predictor (a low bar is high specificity), above the bars is the odds ratio (OR) from the combined logistic regression.
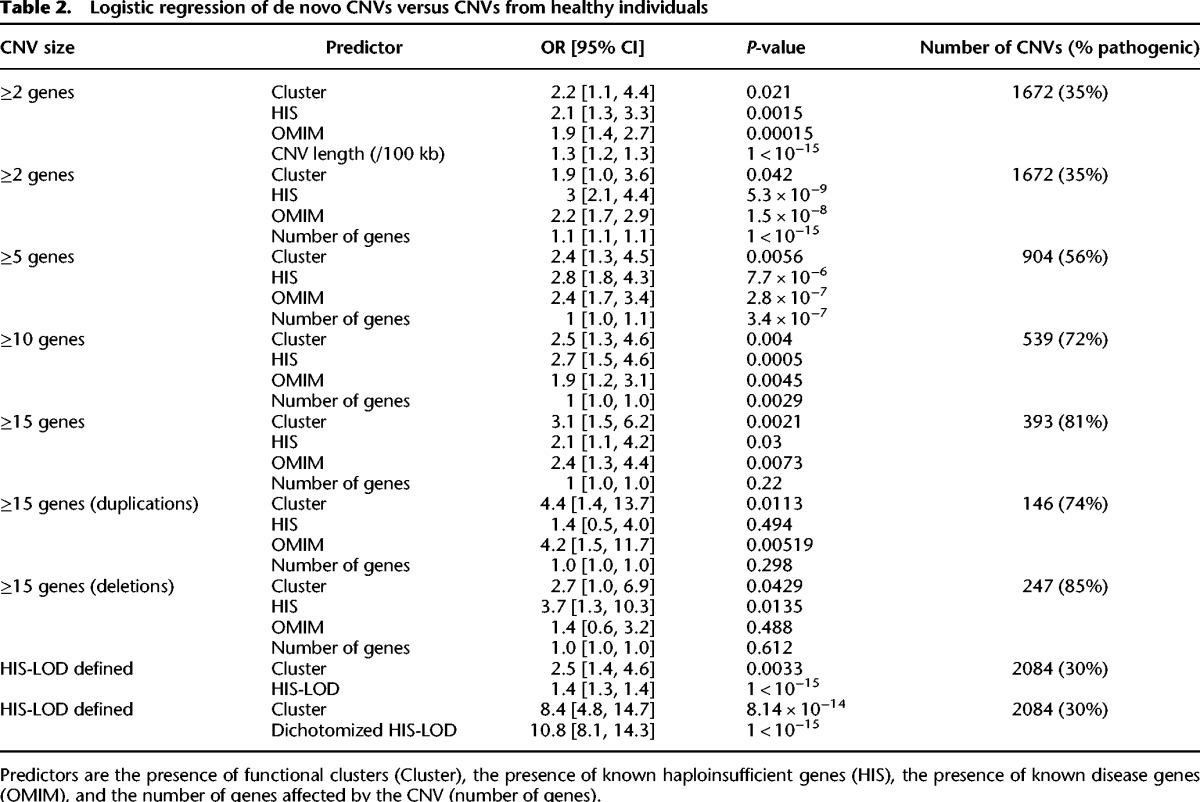
When the total number of genes affected by a CNV was added to the model, the presence of a functional cluster remained a significant predictor of CNV pathogenicity (odds ratios: cluster = 1.9; OMIM gene = 2.2; and HIS gene = 3.0, down from 9.0, 3.0, and 3.3, respectively) and retained its preeminence for larger CNVs affecting at least 15 genes (odds ratios: cluster = 3.1; OMIM gene = 2.4; HIS gene = 2.1) (Table 2). The inclusion of the total number of genes affected by a CNV substantially reduced the predictive power of all three predictors and had the greatest effect on reducing the predictive power of the presence of a functional cluster as expected since it is dependent on the number of pairwise similarities between CNV genes, which grows as the square of the number of genes. This is consistent with the functional relationships between genes in the CNV being a significant contributor to the phenotypic consequences of the CNV beyond their individual deleteriousness; however, this effect is relatively small. Unlike HIS and OMIM genes, functional clusters were a significant predictor of large CNV pathogenicity among both deletions and duplications (Table 2). We also replicated this model using a published case-control CNV data set from patients with developmental disorders (Cooper et al. 2011) and, as before, when large CNVs were considered (affecting at least 10 genes), functional clusters were a better predictor of CNV pathogenicity than HIS or OMIM genes (Supplemental Table S3).
Table 2.
Logistic regression of de novo CNVs versus CNVs from healthy individuals
Genes found to be disrupted in multiple patients are more likely to be disease causing. Genes belonging to functional clusters were significantly enriched in genes affected by CNVs in more than one patient (“recurrently hit”) compared to all CNV genes (DECIPHER P = 1.5 × 10⁻⁸; NIJMEGEN P = 0.0013), and this enrichment increased with the number of patients harboring a CNV that overlaps the gene (Fig. 2). Thus, the more often a region was seen to be affected by CNVs in patients with developmental disorders, the larger the proportion of genes belonging to functional clusters within the region.
We have shown that de novo CNVs in patients with developmental disorders affect a significantly large functional cluster enriched in disease genes, which is rarely seen in either apparently benign CNVs or random regions containing an equal number of genes.
The human genome is functionally clustered
Previous studies have found significant clustering of functionally related genes in the human genome (Caron et al. 2001; Lee and Sonnhammer 2003; Fukuoka et al. 2004; Singer et al. 2005; Sémon and Duret 2006; Makino and McLysaght 2008; Michalak 2008; Al-Shahrour et al. 2010), but these have yet to be linked to human disease. To determine the genome-wide extent of disease-relevant functional clustering similar to what we observed within the de novo CNVs, we combined the single-linkage clustering with a growing cluster algorithm similar to what was used by others (Li et al. 2005; Ng et al. 2009; Weber and Hurst 2011) such that genes are added to a cluster of functionally related genes as long as they are within a distance threshold D and above a similarity threshold of T of another gene that belongs to the cluster (Supplemental Fig. S5). The similarity threshold (T) was set at the top 1% shortest paths in the network as above, and the distance threshold (D) was set equal to the 99th percentile of observed genomic distances between functionally related genes in the DECIPHER and NIJMEGEN de novo CNVs (2.1 Mb) (Supplemental Fig. S6).
We identified 933 clusters of functionally related genes within the human genome using the phenotypic linkage network (Fig. 4; Supplemental Table S4). A total of 3411 genes (16% of the genome) were present in functional clusters after collapsing paralogs, which is consistent with previous estimates of 3%–20% of genes participating in functional clusters (Spellman and Rubin 2002; Al-Shahrour et al. 2010). The significance of these functional clusters was determined by comparing to 1000 gene-label permutations, which permute the genes with respect to their genomic locations while leaving the patterns of gene density in the genome intact. Both the number of clusters (933) and the total number of genes in clusters (3411) were significantly high (P < 0.001), but the average size of clusters was not significantly different (on average 3.6, P = 0.114; data not shown) from the randomizations (Fig. 4). Our findings were robust to the clustering parameters and the network used to identify the functional clusters and were not due to the MHC region (Supplemental Fig. S7).
Figure 4.

The human genome contains clusters of functionally related genes. (A) The 933 clusters of functionally related genes are present on all chromosomes examined. Chromosomes are arranged from 1 to X from left to right with functional clusters (orange), yellow bands indicate centromeres, and dark orange bands indicate regions of highly repetitive sequence; the banding pattern was obtained from UCSC Genome Browser hg18 (Rhead et al. 2010). (B,C) The extent of functional clusters compared to 1000 network node-label permutations of the PLN (see Methods), observed functional clusters are indicated by arrows with the respective P-value. The null distribution when paralogs were included is almost identical to that when paralogs were excluded, thus it is mostly hidden behind it in the plots.
Pathogenic CNVs affect functional clusters to a greater extent than benign CNVs
If functional clusters contribute to CNV pathogenicity through compounding the deleterious effects of each gene then we would expect benign CNVs to affect a smaller number of genes in the functional cluster than pathogenic CNVs (i.e., de novo patient CNVs). Because we have shown that the largest cluster within each de novo CNV was the most significant (Fig. 1C), we restricted our analyses to the largest cluster hit by each de novo CNV, where the CNV hit two or more genes in the cluster (herein termed “pathogenic clusters”). There were 315 pathogenic clusters across the genome. Apparently, benign CNVs do not specifically avoid the pathogenic clusters because 169 were also overlapped by a benign CNV, more than the 143 expected under a binomial model (P = 0.002). In addition, 54 of the pathogenic clusters were also the largest cluster affected by a benign CNV (32 expected, P = 0.0001, Supplemental Fig. S8). However, de novo CNVs affect more genes in the pathogenic clusters than the apparently benign CNVs: For the 54 pathogenic clusters which were also the largest cluster hit by a benign CNV, the de novo CNV affected on average 2.8 more genes within the cluster than the benign CNV (P = 0.0006, Student's t-test); and for the 169 pathogenic clusters overlapped at all by a benign CNV, the de novo CNV affected on average 2.2 more genes within the cluster than the benign CNV (P = 1.1 × 10⁻¹¹, Student's t-test). Thus, de novo CNVs were more likely to affect a functional cluster and overlap more genes in the functional cluster than the apparently benign CNVs, revealing small hits to functional clusters are unlikely to be pathogenic. These results suggest pathogenicity is conferred by the cumulative effects of a CNV affecting many genes within the same functional cluster.
Clusters of functionally related genes explain shared patient phenotypes
We considered whether CNVs that affect the same genome-wide functional cluster resulted in similar phenotypes. All DECIPHER and NIJMEGEN de novo CNVs were combined into a single data set and grouped by patient, and patient phenotypes were mapped to HPO terms (see Methods) (Dolken et al. 2012). As above, we focused our analyses on the largest cluster hit by a CNV where the CNV hit more than one gene in the cluster. On average, a patient phenotype was present in 30% (±0.3%) of patients whose CNVs overlapped the same genome-wide functional cluster; this value was only matched or surpassed once after the 1000 permutations of patient phenotypes (P = 0.0002).
When considered in a pairwise manner, patients whose CNVs affected the same functional cluster genes (Cluster-and-Genes) or which affect genes in the same functional cluster but do not affect any of the same genes (Cluster-only) have significantly more similar phenotypes than patients whose CNVs affected the same genes not belonging to functional clusters (Genes-only) or whose CNVs do not overlap at all (Fig. 5). This latter case, Cluster-only, excludes cases in which the patients’ CNVs overlap and thus could be phenotypically similar because they have the same syndrome. CNVs that affected fewer than two genes were excluded, since they could not affect a functional cluster. This ensured that the phenotypic similarity was not due to patients whose CNVs affect a functional cluster having more phenotype annotations (P > 0.07, two-sided Wilcoxon rank-sum test) (Supplemental Fig. S9). In agreement with our finding that functional clusters are more strongly associated with pathogenicity than known disease genes (Fig. 3), we observed that patients whose CNVs affected the same OMIM genes did not have more similar phenotypes than those affecting the same non-OMIM genes (P > 0.4).
Figure 5.

Clusters of functionally related genes are a better indicator of phenotypic similarity than genes. (A) Patient pairs were placed into six categories based on shared genetic elements. Orange rectangles represent genes. Purple rectangles represent genes belonging to the same genome-wide functional cluster. Black bordered rectangles indicate OMIM disease genes. Black segments indicate the de novo CNVs from two different patients. Only one CNV per patient is included for each situation for simplicity; in cases with multiple de novo CNVs, overlaps between all the CNV(s) of one patient and all the CNVs of the other patient were considered. (B) Phenotype similarity as measured by the Goodall3 index (Boriah et al. 2008) between pairs of patients in each category shown in A: Cluster-and-Genes affect the functional cluster and the same genes; Cluster-and-OMIM affect the same functional cluster and the same OMIM genes; Cluster-only affect the same functional cluster but different genes; Genes-only affect the same genes but not the functional cluster; OMIM-only affect the same OMIM genes but not the same functional cluster. Stars indicate significance, calculated using a Wilcoxon rank-sum test: (*) P < 0.05; (**) P < 0.005; (***) P < 0.0005, etc., up to a maximum of five stars. The red line indicates the median phenotypic similarity over all patient pairs.
Patients whose CNVs affected the same functional cluster genes (Cluster-and-Genes) had consistently significantly more similar phenotypes than Genes-only patient pairs across both alternative networks and four different sets of clustering parameters (Supplemental Fig. S10). Patient pairs with CNVs affecting the same functional cluster but none of the same genes (Cluster-only) had consistently more similar phenotypes than Genes-only pairs, but due to the smaller number of patient pairs in this category, it did not retain significance. Patients whose CNVs overlap the same cluster have significantly more similar phenotypes than those whose CNVs do not. These results show that the disruption of functional clusters by CNVs influences the respective patient's phenotype.
Discussion
In this study, we have demonstrated that clusters of functionally related genes in the human genome contribute to CNV-mediated developmental disorders. Using three different functional networks, we found that two independent sets of de novo CNVs from individuals with developmental disorders frequently contained a significantly large cluster of functionally related genes (Fig. 1). These clusters were enriched in known disease genes compared to the rest of the CNV (Fig. 2; Supplemental Fig. S4), but the presence of a functional cluster was better able to distinguish patient de novo CNVs from CNVs from healthy individuals (Fig. 3). Across the genome, we found significantly more similarly sized functional clusters than expected, many of which were not overlapped by any of the apparently benign or pathogenic CNVs considered. Pathogenic CNVs were more likely to affect functional clusters and affected more genes in the functional cluster than apparently benign CNVs. Finally, we showed that patients with mutations in the same genome-wide functional clusters had significantly similar phenotypes (Fig. 5).
Although the extent and type of functional clustering across the whole human genome will always be subject to the definition of functional similarity and the errors and biases present in each source of functional information, we have identified significantly unusual clustering within those regions of the genome that are affected by pathogenic CNVs. To minimize the contribution of false positives without sacrificing coverage of functional information, we used an integrative approach that weights the contribution of multiple data types and sets, and then we replicated our findings using two other networks that used different data sources and different statistical methods in their construction.
Large CNVs (typically >500 kb) have been consistently associated with disease (Sharp et al. 2006; Sebat et al. 2007; Xu et al. 2008; Greenway et al. 2009; Kirov et al. 2009; Miller et al. 2010; Cooper et al. 2011; Paciorkowski et al. 2011; Girirajan et al. 2013), but similarly sized CNVs are not uncommon and are found at frequencies of 5%–10% in the healthy population (Itsara et al. 2009). If the pathogenicity of a CNV is increased by perturbing multiple functionally related genes, then we would expect large CNVs in healthy individuals to avoid such clusters. Indeed, when considering benign CNVs in the same size range as the de novo CNVs (100 kb–5 Mb), only one in 20 affected multiple functionally related genes as compared to approximately half the pathogenic CNVs. Corroboratively, we find that both sets of de novo CNVs affected more functionally related genes than expected after controlling for the number of genes affected by the CNVs. Furthermore, we found that the presence of a functional cluster was a significant predictor of pathogenicity of a CNV after controlling for either CNV size or the number of genes affected by the CNV (Table 2).
Our findings support a model in which the compounding effects of a simultaneous copy number change of localized groups of functionally related genes contribute extensively to etiology of developmental disorders. By increasing the number of functionally related genes affected by a single CNV, clusters of functionally related genes may increase the penetrance and/or severity of the phenotype(s) influenced by the functionally related genes. Our finding that it is the number of functionally related genes affected by a CNV, rather than affecting a functional cluster per se, that distinguishes pathogenic CNVs from apparently benign CNVs suggests that (1) there is a degree of redundancy in the affected functional clusters that is being eliminated by these larger pathogenic CNVs; (2) there are epistatic effects between combinations of disrupted genes; and/or (3) the effect of each additionally affected gene pushes the same phenotype along a continuum and over the threshold for disease. The first two possibilities suggest that effects of these CNVs will only be revealed in genetic models carrying multiple simultaneous mutations, as has been observed for microcephaly (Golzio et al. 2012), whereas the latter suggests that some disorder-relevant phenotypic similarities might be observed by apparently healthy individuals whose CNVs affect disease-relevant clusters to a lesser extent, as observed for autism (Bernier et al. 2012). Finally, since the loss of a gene copy can act to reveal a recessive mutation in the remaining haplotype (Hochstenbach et al. 2012), where a loss event occurs across a functional cluster, a single recessive mutation in any of the affected functionally similar genes may yield similar phenotypes, with larger CNVs more likely to reveal a mutation within a clustered gene.
Several studies have focused on individual dosage-sensitive or known disease genes within CNVs (Vissers et al. 2005; Mefford et al. 2010). We found the presence of clusters of functionally related genes within CNVs was a significant predictor of pathogenicity independent from the presence of either of these classes of known disease genes (Fig. 3). The presence of clusters of functionally related genes remained a significant predictor of pathogenicity when used in addition to the LOD score of the presence of at least one haploinsufficient gene (Huang et al. 2010) and after controlling for the total number of genes in the CNV, although the effect size did diminish. Furthermore, the disruption of a cluster of functionally related genes may only explain up to 50% of the patient de novo CNVs considered here, and our findings do not exclude the contribution of phenotypic effects caused by individual dosage-sensitive genes or noncoding elements. However, we observed that controlling for total length of a CNV as opposed to the total number of genes in a CNV had little effect on the logistic regression of CNV pathogenicity, suggesting noncoding elements play a minor role overall in CNV pathogenicity (Table 2). Furthermore, the contribution of functionally clustered genes to these patients’ disorders is reinforced by the observation that patients that possess CNVs that affect genes within the same functional cluster are more likely to demonstrate phenotypic similarity even when those patients’ CNVs do not overlap (Fig. 5). Although there remain many aspects of functional clustering that warrant further study, we have shown that consideration of clusters of functionally related genes within the genome provides a useful addition to existing methods of interpreting the clinical significance of large copy-number variants and will aid in the diagnosis and treatment of patients with rare genetic disease.
Methods
De novo CNV data sets
De novo CNVs observed in patients with developmental abnormalities are considered likely pathogenic (Zhang et al. 2009; Coe et al. 2012; Malhotra and Sebat 2014). We obtained 626 de novo CNVs and the respective patient phenotypes, compiled from a consortium of clinical genetics laboratories, and we identified on a variety of arrays from the Database of Chromosomal Imbalance and Phenotype in Humans Using Ensembl Resources (DECIPHER) (Firth et al. 2009). DECIPHER patient phenotypes were described using the London Neurogenics Database (LND) terms (Bass 2002). In addition, a second independent set of 426 de novo CNVs, identified in a large cohort of patients with intellectual disability and/or multiple congenital abnormalities using the Affymetrix 250K NspI SNP array, were obtained from the Department of Human Genetics, Radboud University Medical Center, Nijmegen, The Netherlands (NIJMEGEN; dbVar Study: nstd85) (Vulto-van Silfhout et al. 2013). NIJMEGEN phenotypes were described using a uniform clinical form using Human Phenotype Ontology (HPO) terms, as described in Vulto-van Silfhout et al. (2013). Patients had between one and 56 distinct phenotypes (Q1 = 5, Q2 = 9, Q3 = 15) such as autism, craniofacial malformations, cardiac defects, or other morphological or behavioral abnormalities. The most common phenotypes were nervous system abnormalities (>90% of patients), intellectual disability (80%), eye abnormalities (43%), and facial abnormalities (39%).
Many arrays have poor resolution (Vissers et al. 2005; Lee et al. 2007), resulting in many false positives for CNVs <100 kb in size (Hehir-Kwa et al. 2007; Lee et al. 2007; Tucker et al. 2011), whereas CNVs >100 kb are likely to pass validations (Cooper et al. 2011), leading several studies using CNVs from different arrays to remove small CNVs (Itsara et al. 2009; Tucker et al. 2011). In addition, the pathogenicity of small de novo CNVs is unclear (Vermeesch et al. 2011). Very large CNVs contain many extraneous genes that introduce substantial noise to functional analyses. To reduce noise when looking for clusters of functionally related genes within CNVs, both DECIPHER and NIJMEGEN CNVs >5 Mb or <100 kb in size were filtered out, leaving 427 and 237 de novo CNVs, respectively (Table 1). We checked that our findings were robust to this filtering (Supplemental Fig. S3).
The 626 DECIPHER de novo CNVs were recorded in hg18 coordinates, whereas the 426 NIJMEGEN de novo CNVs were identified in hg17 coordinates that were mapped to hg18 using liftOver (Rhead et al. 2010). Genes were mapped to these CNV regions from Ensembl 54 (Flicek et al. 2010) such that some exonic sequence from every transcript for the gene was within the CNV region. Using this criterion has been shown to reduce the length bias of mapped genes over other mapping criteria (Webber 2011).
Collapsing paralogs
Human paralogs were identified using both Ensembl 54 (Flicek et al. 2010) and OPTIC databases (Heger and Ponting 2008), which both use phylogenetic methods to identify paralogs, using zebrafish as the out-group. All paralogous relationships identified in either resource were included when identifying instances of paralogy. Within each gene set (CNV or gene-number-matched randomization or genome-wide cluster of functionally related genes), paralogous genes were collapsed such that the first member of the family encountered is retained, and all other members are removed. In addition, the functional similarity between paralogous genes is set to zero when identifying genome-wide clusters of functionally related genes to prevent the expansion of clusters due to arrays of tandemly duplicated genes. We also repeated the significance of genome-wide clustering of functionally related genes after removing all genes with any paralogs; this did not change the significance of results (data not shown).
Creating the PLN
We were interested in the functional similarity between genes found within each de novo CNV. Interactions between genes can be obtained or inferred from genome-wide databases of known pathways and functions, expression patterns, protein–protein interaction (PPI) experiments, sequence information, and knockout phenotypes displayed by model organisms. Each of these data types has errors and covers a subset of genes. Thus we combined multiple data sources (Supplemental Table S1) together into a single integrated network, which represents genes as nodes and the likelihood or strength of an interaction as weighted edges between them, using the method described in Honti et al. (2014). Briefly, data sets were rescored according to the regression of the data set against the similarity of mouse phenotypes annotated to the 1–1 orthologs and then summed after weighting each data set according to the strength of its relationship with phenotypic similarity. This network was combined with the semantic similarity between mouse knockout phenotypes by weighting each according to their ability to predict human phenotypic similarity from the HPO using the same methodology. Semantic similarity between phenotype terms was calculated using the average information content (IC) (Resnik 1995) of the most informative disjoint common ancestors. This was combined for all terms assigned to a pair of genes by taking the average of the similarity between the most similar pairs of terms (maximum best-match) and the average of the similarity between all best-matching term pairs (average best-match) (Pesquita et al. 2009). The resulting single integrated functional network had 10-fold greater coverage and greater specificity than it did prior to the integration of mouse phenotype information (Supplemental Fig. S2). We name the final integrated functional network the Phenotypic Linkage Network (PLN). The final PLN is available in the Supplemental Material.
We confirmed the overlap of de novo CNVs with functional clusters in two other networks: HumanNet (Lee et al. 2011), another integrated functional network; and COXPRESdb (Obayashi et al. 2008), a coexpression-only network. Functional clusters within these two additional networks were defined as with the PLN described below. However, we focused on results obtained using the PLN due to its greater coverage of genes compared to HumanNet (Supplemental Table S2) and the improvement of integrated functional networks over coexpression or protein–protein interaction-only networks when predicting gene function (Troyanskaya et al. 2003; Deng et al. 2004; Lee et al. 2004).
Identifying clusters of functionally related genes
The PLN contained roughly 11 million direct edges, which are on 7.4% of all possible pairwise similarities. To increase the coverage, we calculated the shortest paths through this network that gave a similarity metric for 142,864,287 gene pairs (>98% of all possible pairwise comparisons between the 17,039 genes in the PLN). Shortest paths were calculated by converting original network similarity edges into distances using dist = 1/(1 + sim). Dijkstra's shortest-path algorithm was applied to the distances (Dijkstra 1959). The resulting shortest paths were converted back to similarities using the inverse function: sim = 1/dist − 1 (shortest-path similarities).
Clusters of functionally related genes were identified using single linkage hierarchical clustering using a height threshold equal to the top 1% shortest paths in the network. To identify genome-wide clusters of functionally related genes, this approach was augmented with a distance threshold (equal to 2.1 Mb based on the clusters of functionally related genes identified in CNVs) (Supplemental Fig. S6), such that two genes must also be located within that distance in the genome to be assigned to the same cluster (similar to the neighborhood model) (Li et al. 2005). Results were replicated using a 5% shortest-paths threshold and at a 0.1% shortest-paths threshold as well as a 1.3-Mb distance and 5-Mb distance threshold. We focused on results considering only the top 1% most similar genes within the network, as at this threshold less than half the genes within the CNVs whose mouse orthologs' disruptions had been phenotyped were found in the same cluster, indicating that the genes shared a specific function rather than simply being well-studied genes.
Randomizations
The patient de novo CNVs contained many more genes than random sequences of equal length (Supplemental Fig. S11), as previously reported for autistic patients (Sanders et al. 2011). Thus the genes affected by each de novo CNV were compared to 10,000 randomly chosen, equally sized sets of genes that were contiguous on a chromosomal arm, “gene-number-matched randomizations,” to determine the expected functional similarity between the genes affected by these CNVs. Genes not present in the relevant gene network were excluded and paralogs collapsed such that randomizations had the same number of genes remaining as the original CNV.
Genome-wide clusters of functionally related genes were compared to “network node label permutations,” where the gene locations in the genome and topology of the network were maintained, but the genes represented by each node in the network were randomly scrambled.
Shared phenotypes were compared to “phenotype permutations” in which the number of distinct phenotypes assigned to each patient and the frequency of each phenotype in the total patient population was preserved, but the identities of the phenotypes assigned to each patient were randomly permuted.
Known disease genes
Known disease genes were obtained from the OMIM database (OMIM 2012). Only OMIM disease genes classed as confirmed and where the molecular basis or mutation in the gene is known or where the gene is part of a known contiguous gene syndrome were considered known disease genes; these were mapped to 1648 Ensembl genes. In addition, 297 curated human haploinsufficient genes (HIS) were obtained from Dang et al. (2008). Significance of the enrichment of these disease genes in clusters of functionally related genes (versus all CNV genes) was calculated using a one-sided hypergeometric test. For the logistic regression, both apparently benign and de novo CNVs were filtered to remove CNVs >5 Mb or <100 kb in length. The presence/absence of a functional cluster (at least two functionally related genes), at least one known disease gene, or at least one known HIS gene were each treated as a binary predictor.
Neither the phenotypic consequences of HIS genes nor OMIM disease genes were recorded in rigorously defined terms, so they could not be easily compared to the patients’ phenotypes as recorded in DECIPHER and NIJMEGEN. However, gene-phenotype annotations from HPO (Robinson et al. 2008) could be easily compared to the patients’ phenotypes in NIJMEGEN, which were also recorded using HPO terms, and to the patients’ phenotypes in DECIPHER, which were recorded using LND terms that were mapped to HPO (see below). Each gene had all terms ancestral to the terms found in the HPO database assigned to them by imputing on the hierarchy of HPO terms. The patients’ phenotypes were not imputed to avoid matches between distinct but related phenotypes (e.g., epilepsy and autism). Significance of the enrichment of these phenotype-specific genes in clusters of functionally related genes (versus all CNV genes) was calculated using a one-sided binomial test.
In addition, we compared the predictive power of the presence of at least one functional cluster with the presence of a HIS gene or an OMIM known disease gene using logistic regression with or without also including the number of genes affected by each CNV as a fourth predictor. When the number of genes affected by each CNV was included, we limited CNVs to those affecting at least two genes so that all the CNVs had the opportunity to affect a functional cluster (we also test higher thresholds since functional clusters should be more important in very large CNVs). In addition, we directly compared the presence of a functional cluster with the LOD score of there being a haploinsufficient gene within the CNV as defined by Huang et al. (2010) and calculated using the provided imputed HIS scores and software. These CNV LOD scores were dichotomized by using a logistic regression of CNV pathogenicity against the continuous HIS-LOD score and finding the value where this regression predicts a 50% chance of the CNV being pathogenic (this was equal to a HIS-LOD of 5.09). CNVs with a LOD score above this threshold were assigned a 1 and those below were assigned a 0 in the dichotomized version. We also replicated this logistic regression using a published set of case-control CNVs for patients with developmental disorders (Cooper et al. 2011); since 15,000 control CNVs in this set affected exactly two genes (out of less than 30,000 control CNVs affecting at least two genes), we started with a threshold of CNVs affecting at least three genes in this data set.
Mapping phenotypes
DECIPHER patient phenotypes were recorded using LND, whereas NIJMEGEN patient phenotypes were recorded using HPO; to make the phenotypes comparable we used an existing mapping file from the HPO website (Dolken et al. 2012) (http://www.human-phenotype-ontology.org/contao/index.php/downloads.html) and used the most general mapping for each term if matches were not 1–1. HPO and LND phenotypes without any known mappings were excluded from both CNV data sets.
CNVs hitting genome-wide functional clusters
We compared the overlap of genome-wide functional clusters hit by different data sets to the expectation using a binomial model where p is the product of the proportion of clusters hit/not hit by the respective data sets. This model does not account for different sizes of functional clusters. However, 71% of the time when a cluster of functionally related genes is hit by a CNV from a particular data set, it is completely hit by a CNV from that data set regardless of the size of the cluster of functionally related genes, suggesting clusters of functionally related genes are small compared to the size of CNVs. Thus, a cluster of functionally related gene sizes is unlikely to be an important factor in the likelihood of a cluster of functionally related genes being hit by a CNV from each data set. All P-values were calculated using a one-sided binomial distribution.
Phenotype similarity
Ancestral phenotype terms were imputed for each patient by assigning all ancestral terms of the phenotypes assigned to the patient using the respective ontology (HPO for NIJMEGEN and LND for DECIPHER). The similarity between two patients’ phenotypes was calculated using a simplified version of Goodall's probability index (Goodall 1966), called Goodall3, proposed by Boriah et al. (2008). This measure has a key advantage over the more common Jaccard similarity (Jaccard 1901) by accounting for the frequency of each phenotype in the cohort. Goodall3 weights the concordant presence/absence of each phenotype by the probability of it happening by chance (based on the observed frequency of each phenotype in the whole data set). This was summed for each pair of patients over all phenotypes observed in at least one patient in the entire cohort. In addition, Goodall3 was one of the best indices of the 14 different indices evaluated by Boriah et al. (2008). Significance was assessed using a two-sided Wilcoxon rank-sum test (also known as a Mann-Whitney U test), which compares the median of the distribution of phenotypic similarities between all pairs of patients in each category (Fig. 5A).
Data access
The PLN is available in Supplemental File 4 and at http://wwwfgu.anat.ox.ac.uk/downloads/webber-resources/PLN/.
Supplementary Material
Acknowledgments
T.A. was funded through NSERC Julie Payette Scholarships and the Clarendon Foundation in partnership with Somerville College. This study makes use of data generated by the DECIPHER Consortium. A full list of the centers that contributed to the generation of the data is available from http://decipher.sanger.ac.uk and via email from decipher@sanger.ac.uk. Funding for the project was provided by the Wellcome Trust.
Author contributions: T.A. and C.W. designed the research and wrote the manuscript; T.A. performed the analyses; F.H. contributed the PLN; R.P., N.L., J.H.K., A.V.S., and B.V. contributed the NIJMEGEN data.
Footnotes
[Supplemental material is available for this article.]
Article published online before print. Article, supplemental material, and publication date are at http://www.genome.org/cgi/doi/10.1101/gr.184325.114.
References
- Al-Shahrour F, Minguez P, Marqués-Bonet T, Gazave E, Navarro A, Dopazo J. 2010. Selection upon genome architecture: conservation of functional neighborhoods with changing genes. PLoS Comput Biol 6: e1000953. [DOI] [PMC free article] [PubMed] [Google Scholar]
- Bass HN. 2002. London dysmorphology database, London neurogenetics database & dysmorphology photo library on CD-ROM. Am J Hum Genet 71: 687. [Google Scholar]
- Bernier R, Gerdts J, Munson J, Dawson G, Estes A. 2012. Evidence for broader autism phenotype characteristics in parents from multiple-incidence autism families. Autism Res 5: 13–20. [DOI] [PMC free article] [PubMed] [Google Scholar]
- Boriah S, Chandola V, Kumar V. 2008. Similarity measures for categorical data: a comparative evaluation. In Proceedings of the eighth SIAM international conference on data mining, pp. 234–254. SIAM, Atlanta, GA. [Google Scholar]
- Boulding H, Webber C. 2012. Large-scale objective association of mouse phenotypes with human symptoms through structural variation identified in patients with developmental disorders. Hum Mutat 33: 874–883. [DOI] [PubMed] [Google Scholar]
- Bult CJ, Eppig JT, Kadin JA, Richardson JE, Blake JA, Mouse Genome Database Group. 2008. The Mouse Genome Database (MGD): mouse biology and model systems. Nucleic Acids Res 36: D724–D728. [DOI] [PMC free article] [PubMed] [Google Scholar]
- Caron H, van Schaik B, van der Mee M, Baas F, Riggins G, van Sluis P, Hermus MC, van Asperen R, Boon K, Voûte PA, et al. 2001. The human transcriptome map: clustering of highly expressed genes in chromosomal domains. Science 291: 1289–1292. [DOI] [PubMed] [Google Scholar]
- Coe BP, Girirajan S, Eichler EE. 2012. The genetic variability and commonality of neurodevelopmental disease. Am J Med Genet C Semin Med Genet 160C: 118–129. [DOI] [PMC free article] [PubMed] [Google Scholar]
- Cohen BA, Mitra RD, Hughes JD, Church GM. 2000. A computational analysis of whole-genome expression data reveals chromosomal domains of gene expression. Nat Genet 26: 183–186. [DOI] [PubMed] [Google Scholar]
- Cooper GM, Coe BP, Girirajan S, Rosenfeld JA, Vu TH, Baker C, Williams C, Stalker H, Hamid R, Hannig V, et al. 2011. A copy number variation morbidity map of developmental delay. Nat Genet 43: 838–846. [DOI] [PMC free article] [PubMed] [Google Scholar]
- Dang VT, Kassahn KS, Marcos AE, Ragan MA. 2008. Identification of human haploinsufficient genes and their genomic proximity to segmental duplications. Eur J Hum Genet 16: 1350–1357. [DOI] [PubMed] [Google Scholar]
- Deng M, Chen T, Sun F. 2004. An integrated probabilistic model for functional prediction of proteins. J Comput Biol 11: 463–475. [DOI] [PubMed] [Google Scholar]
- Dijkstra EW. 1959. A note on two problems in connexion with graphs. Numer Math 1: 269–271. [Google Scholar]
- Doelken SC, Köhler S, Mungall CJ, Gkoutos GV, Ruef BJ, Smith C, Smedley D, Bauer S, Klopocki E, Schofield PN, et al. 2013. Phenotypic overlap in the contribution of individual genes to CNV pathogenicity revealed by cross-species computational analysis of single-gene mutations in humans, mice and zebrafish. Dis Model Mech 6: 358–372. [DOI] [PMC free article] [PubMed] [Google Scholar]
- Dolken S, Robinson PN, Bauer S. 2012. The Human Phenotype Ontology. London Dysmorphology Database Mapping; http://www.human-phenotype-ontology.org/contao/index.php/downloads.html. [Google Scholar]
- Firth HV, Richards SM, Bevan AP, Clayton S, Corpas M, Rajan D, Vooren SV, Moreau Y, Pettett RM, Carter NP. 2009. DECIPHER: Database of Chromosomal Imbalance and Phenotype in Humans Using Ensembl Resources. Am J Hum Genet 84: 524–533. [DOI] [PMC free article] [PubMed] [Google Scholar]
- Flicek P, Aken BL, Ballester B, Beal K, Bragin E, Brent S, Chen Y, Clapham P, Coates G, Fairley S, et al. 2010. Ensembl's 10th year. Nucleic Acids Res 38: D557–D562. [DOI] [PMC free article] [PubMed] [Google Scholar]
- Fukuoka Y, Inaoka H, Kohane I. 2004. Inter-species differences of co-expression of neighboring genes in eukaryotic genomes. BMC Genomics 5: 4. [DOI] [PMC free article] [PubMed] [Google Scholar]
- Girirajan S, Dennis MY, Baker C, Malig M, Coe BP, Campbell CD, Mark K, Vu TH, Alkan C, Cheng Z. 2013. Refinement and discovery of new hotspots of copy-number variation associated with autism spectrum disorder. Am J Hum Genet 92: 221–237. [DOI] [PMC free article] [PubMed] [Google Scholar]
- Golzio C, Willer J, Talkowski ME, Oh EC, Taniguchi Y, Jacquemont S, Reymond A, Sun M, Sawa A, Gusella JF, et al. 2012. KCTD13 is a major driver of mirrored neuroanatomical phenotypes of the 16p11.2 copy number variant. Nature 485: 363–367. [DOI] [PMC free article] [PubMed] [Google Scholar]
- Goodall DW. 1966. A new similarity index based on probability. Biometrics 22: 882–907. [Google Scholar]
- Greenway SC, Pereira AC, Lin JC, DePalma SR, Israel SJ, Mesquita SM, Ergul E, Conta JH, Korn JM, McCarroll SA, et al. 2009. De novo copy number variants identify new genes and loci in isolated sporadic tetralogy of Fallot. Nat Genet 41: 931–935. [DOI] [PMC free article] [PubMed] [Google Scholar]
- Heger A, Ponting CP. 2008. OPTIC: orthologous and paralogous transcripts in clades. Nucleic Acids Res 36: D267–D270. [DOI] [PMC free article] [PubMed] [Google Scholar]
- Hehir-Kwa JY, Egmont-Petersen M, Janssen IM, Smeets D, van Kessel AG, Veltman JA. 2007. Genome-wide copy number profiling on high-density bacterial artificial chromosomes, single-nucleotide polymorphisms, and oligonucleotide microarrays: a platform comparison based on statistical power analysis. DNA Res 14: 1–11. [DOI] [PMC free article] [PubMed] [Google Scholar]
- Hochstenbach R, Poot M, Nijman IJ, Renkens I, Duran KJ, Van't Slot R, van Binsbergen E, van der Zwaag B, Vogel MJ, Terhal PA, et al. 2012. Discovery of variants unmasked by hemizygous deletions. Eur J Hum Genet 20: 748–753. [DOI] [PMC free article] [PubMed] [Google Scholar]
- Honti F, Meader S, Webber C. 2014. Unbiased functional clustering of gene variants with a phenotypic-linkage network. PLoS Comput Biol 10: e1003815. [DOI] [PMC free article] [PubMed] [Google Scholar]
- Huang N, Lee I, Marcotte EM, Hurles ME. 2010. Characterising and predicting haploinsufficiency in the human genome. PLoS Genet 6: e1001154. [DOI] [PMC free article] [PubMed] [Google Scholar]
- Itsara A, Cooper GM, Baker C, Girirajan S, Li J, Absher D, Krauss RM, Myers RM, Ridker PM, Chasman DI, et al. 2009. Population analysis of large copy number variants and hotspots of human genetic disease. Am J Hum Genet 84: 148–161. [DOI] [PMC free article] [PubMed] [Google Scholar]
- Jaccard P. 1901. Étude comparative de la distribution florale dans une portion des Alpes et des Jura. Bull Soc Vaud Sci Nat 37: 547–579. [Google Scholar]
- Kamath RS, Fraser AG, Dong Y, Poulin G, Durbin R, Gotta M, Kanapin A, Le Bot N, Moreno S, Sohrmann M, et al. 2003. Systematic functional analysis of the Caenorhabidits elegans genome using RNAi. Nature 421: 231–237. [DOI] [PubMed] [Google Scholar]
- Kirov G, Grozeva D, Norton N, Ivanov D, Mantripragada KK, Holmans P, International Schizophrenia Consortium, Wellcome Trust Case Control Consortium, Craddock N, Owen MJ, et al. 2009. Support for the involvement of large copy number variants in the pathogenesis of schizophrenia. Hum Mol Gen 18: 1497–1503. [DOI] [PMC free article] [PubMed] [Google Scholar]
- Lee JM, Sonnhammer ELL. 2003. Genomic gene clustering analysis of pathways in eukaryotes. Genome Res 13: 875–882. [DOI] [PMC free article] [PubMed] [Google Scholar]
- Lee I, Date SV, Adai AT, Marcotte EM. 2004. A probabilistic functional network of yeast genes. Science 306: 1555–1558. [DOI] [PubMed] [Google Scholar]
- Lee C, Iafrate AJ, Brothman AR. 2007. Copy number variations and clinical cytogenetic diagnosis of constitutional disorders. Nat Genet 39: S48–S54. [DOI] [PubMed] [Google Scholar]
- Lee I, Blom UM, Wang PI, Shim JE, Marcotte EM. 2011. Prioritizing candidate disease genes by network-based boosting of genome-wide association data. Genome Res 21: 1109–1121. [DOI] [PMC free article] [PubMed] [Google Scholar]
- Lercher MJ, Urrutia AO, Hurst LD. 2002. Clustering of housekeeping genes provides a unified model of gene order in the human genome. Nat Genet 31: 180–183. [DOI] [PubMed] [Google Scholar]
- Li Q, Lee B, Zhang L. 2005. Genome-scale analysis of positional clustering of mouse testis-specific genes. BMC Genomics 6: 7. [DOI] [PMC free article] [PubMed] [Google Scholar]
- Makino T, McLysaght A. 2008. Interacting gene clusters and the evolution of the vertebrate immune system. Mol Biol Evol 25: 1855–1862. [DOI] [PubMed] [Google Scholar]
- Makino T, McLysaght A. 2009. The evolution of functional gene clusters in eukaryote genomes. In Evolutionary biology, pp. 185–194. Springer, Berlin/Heidelberg. [Google Scholar]
- Malhotra D, Sebat J. 2014. CNVs: harbingers of a rare variant revolution in psychiatric genetics. Cell 148: 1223–1241. [DOI] [PMC free article] [PubMed] [Google Scholar]
- Mefford HC, Muhle H, Ostertag P, von Spiczak S, Buysse K, Baker C, Franke A, Malafosse A, Genton P, Thomas P, et al. 2010. Genome-wide copy number variation in epilepsy: novel susceptibility loci in idiopathic generalized and focal epilepsies. PLoS Genet 6: e1000962. [DOI] [PMC free article] [PubMed] [Google Scholar]
- Mezey J, Nuzhdin S, Ye F, Jones C. 2008. Coordinated evolution of co-expressed gene clusters in the Drosophila transcriptome. BMC Evol Biol 8: 2. [DOI] [PMC free article] [PubMed] [Google Scholar]
- Michalak P. 2008. Coexpression, coregulation, and cofunctionality of neighboring genes in eukaryotic genomes. Genomics 91: 243–248. [DOI] [PubMed] [Google Scholar]
- Miller DT, Adam MP, Aradhya S, Biesecker LG, Brothman AR, Carter NP, Church DM, Crolla JA, Eichler EE, Epstein CJ, et al. 2010. Consensus statement: chromosomal microarray is a first-tier clinical diagnostic test for individuals with developmental disabilities or congenital anomalies. Am J Hum Genet 86: 749–764. [DOI] [PMC free article] [PubMed] [Google Scholar]
- Ng YK, Wu W, Zhang L. 2009. Positive correlation between gene coexpression and positional clustering in the zebrafish genome. BMC Genomics 10: 42. [DOI] [PMC free article] [PubMed] [Google Scholar]
- Obayashi T, Hayashi S, Shibaoka M, Saeki M, Ohta H, Kinoshita K. 2008. COXPRESdb: a database of coexpressed gene networks in mammals. Nucleic Acids Res 36: D77–D82. [DOI] [PMC free article] [PubMed] [Google Scholar]
- OMIM 2012. Online Mendelian Inheritance in Man. McKusick-Nathans Institute of Genetic Medicine, Johns Hopkins University, Baltimore, MD: http://www.omim.org/. [Google Scholar]
- Paciorkowski AR, Thio LL, Rosenfeld JA, Gajecka M, Gurnett CA, Kulkarni S, Chung WK, Marsh ED, Gentile M, Reggin JD, et al. 2011. Copy number variants and infantile spasms: evidence for abnormalities in ventral forebrain development and pathways of synaptic function. Eur J Hum Genet 19: 1238–1245. [DOI] [PMC free article] [PubMed] [Google Scholar]
- Pal C, Hurst LD. 2003. Evidence for co-evolution of gene order and recombination rate. Nat Genet 33: 392–395. [DOI] [PubMed] [Google Scholar]
- Pesquita C, Faria D, Falcão AO, Lord P, Couto FM. 2009. Semantic similarity in biomedical ontologies. PLoS Comput Biol 5: e1000443. [DOI] [PMC free article] [PubMed] [Google Scholar]
- Poyatos JF, Hurst LD. 2006. Is optimal gene order impossible? Trends Genet 22: 420. [DOI] [PubMed] [Google Scholar]
- Resnik P. 1995. Using information content to evaluate semantic similarity in a taxonomy. In Proceedings of the 14th international joint conference on artificial intelligence (IJCAI), pp. 448–453. Morgan Kaufmann, San Francisco, CA. [Google Scholar]
- Rhead B, Karolchik D, Kuhn RM, Hinrichs AS, Zweig AS, Fujita PA, Diekhans M, Smith KE, Rosenbloom KR, Raney BJ, et al. 2010. The UCSC Genome Browser database: update 2010. Nucleic Acids Res 38: D613–D619. [DOI] [PMC free article] [PubMed] [Google Scholar]
- Robinson PN, Köhler S, Bauer S, Seelow D, Horn D, Mundlos S. 2008. The human phenotype ontology: a tool for annotating and analyzing human hereditary disease. Am J Hum Genet 83: 610–615. [DOI] [PMC free article] [PubMed] [Google Scholar]
- Sanders S, Ercan-Sencicek A , Hus V, Luo R, Murtha M, Moreno-De-Luca D, Chu S, Moreau M, Gupta A, Thomson S, et al. 2011. Multiple recurrent de novo CNVs, including duplications of the 7q11.23 Williams syndrome region, are strongly associated with autism. Neuron 70: 863–885. [DOI] [PMC free article] [PubMed] [Google Scholar]
- Sebat J, Lakshmi B, Malhotra D, Troge J, Lese-Martin C, Walsh T, Yamrom B, Yoon S, Krasnitz A, Kendall J, et al. 2007. Strong association of de novo copy number mutations with autism. Science 316: 445–449. [DOI] [PMC free article] [PubMed] [Google Scholar]
- Sémon M, Duret L. 2006. Evolutionary origin and maintenance of coexpressed gene clusters in mammals. Mol Biol Evol 23: 1715–1723. [DOI] [PubMed] [Google Scholar]
- Shaikh TH, Gai X, Perin JC, Glessner JT, Xie H, Murphy K, O'Hara R, Casalunovo T, Conlin LK, D'Arcy M, et al. 2009. High-resolution mapping and analysis of copy number variations in the human genome: a data resource for clinical and research applications. Genome Res 19: 1682–1690. [DOI] [PMC free article] [PubMed] [Google Scholar]
- Sharp AJ, Hansen S, Selzer RR, Cheng Z, Regan R, Hurst JA, Stewart H, Price SM, Blair E, Hennekam RC, et al. 2006. Discovery of previously unidentified genomic disorders from the duplication architecture of the human genome. Nat Genet 38: 1038–1042. [DOI] [PubMed] [Google Scholar]
- Singer GAC, Lloyd AT, Huminiecki LB, Wolfe KH. 2005. Clusters of co-expressed genes in mammalian genomes are conserved by natural selection. Mol Biol Evol 22: 767–775. [DOI] [PubMed] [Google Scholar]
- Spellman PT, Rubin GM. 2002. Evidence for large domains of similarly expressed genes in the Drosophila genome. J Biol 1: 5. [DOI] [PMC free article] [PubMed] [Google Scholar]
- Troyanskaya OG, Dolinski K, Owen AB, Altman RB, Botstein D. 2003. A Bayesian framework for combining heterogeneous data sources for gene function prediction (in Saccharomyces cerevisiae). Proc Natl Acad Sci 100: 8348–8353. [DOI] [PMC free article] [PubMed] [Google Scholar]
- Tucker T, Montpetit A, Chai D, Chan S, Chenier S, Coe B, Delaney A, Eydoux P, Lam W, Langlois S, et al. 2011. Comparison of genome-wide array genomic hybridization platforms for the detection of copy number variants in idiopathic mental retardation. BMC Med Gen 4: 25. [DOI] [PMC free article] [PubMed] [Google Scholar]
- Vermeesch JR, Balikova I, Schrander-Stumpel C, Fryns J, Devriendt K. 2011. The causality of de novo copy number variants is overestimated. Eur J Hum Genet 19: 1112–1113. [DOI] [PMC free article] [PubMed] [Google Scholar]
- Vilella AJ, Severin J, Ureta-Vidal A, Heng L, Durbin R, Birney E. 2009. EnsemblCompara GeneTrees: complete, duplication-aware phylogenetic trees in vertebrates. Genome Res 19: 327–335. [DOI] [PMC free article] [PubMed] [Google Scholar]
- Vissers LE, Veltman JA, van Kessel AG, Brunner HG. 2005. Identification of disease genes by whole genome CGH arrays. Hum Mol Gen 14: R215–R223. [DOI] [PubMed] [Google Scholar]
- Vulto-van Silfhout AT, Hehir-Kwa JY, van Bon BW, Schuurs-Hoeijmakers JH, Meader S, Hellebrekers CJ, Thoonen IJ, de Brouwer AP, Brunner HG, Webber C, et al. 2013. Clinical significance of de novo and inherited copy-number variation. Hum Mutat 34: 1679–1687. [DOI] [PubMed] [Google Scholar]
- Webber C. 2011. Functional enrichment analysis with structural variants: pitfalls and strategies. Cytogenet Genome Res 135: 277–285. [DOI] [PubMed] [Google Scholar]
- Weber CC, Hurst LD. 2011. Support for multiple classes of local expression clusters in Drosophila melanogaster but no evidence for gene order conservation. Genome Biol 12: R23. [DOI] [PMC free article] [PubMed] [Google Scholar]
- Xu B, Roos JL, Levy S, van Rensburg EJ, Gogos JA, Karayiorgou M. 2008. Strong association of de novo copy number mutations with sporadic schizophrenia. Nat Genet 40: 880–885. [DOI] [PubMed] [Google Scholar]
- Zhang F, Gu W, Hurles ME, Lupski JR. 2009. Copy number variation in human health, disease, and evolution. Annu Rev Genom Human Genet 10: 451–481. [DOI] [PMC free article] [PubMed] [Google Scholar]
Associated Data
This section collects any data citations, data availability statements, or supplementary materials included in this article.