Abstract
Despite many advances in both diagnosis and treatment, tuberculosis still remains one of commonest causes of morbidity and mortality from any infectious cause in the world. Although the overall incidence and mortality rate for tuberculosis has decreased over the years, timely and accurate diagnosis of tuberculosis is essential for the health of the patient as well as the public. For the diagnosis of tuberculosis, a high degree of clinical suspicion is required, and this becomes much more important in high-risk populations. Tuberculosis may masquerade as any disease; therefore, tissue and microbiological assessment is sometimes important for establishing the diagnosis. However, in daily practice, the clinician and radiologist should be familiar with the imaging features of pulmonary and extrapulmonary tuberculosis, as well as manifestations of tuberculosis in immunocompromised patients. Imaging provides a very important role in the diagnosis and management of tuberculosis. Although chest X rays remain the basic imaging modality for pulmonary tuberculosis, computed tomography, magnetic resonance imaging, and nuclear medicine techniques, including positron emission tomography/computed tomography, are extremely helpful in the assessment of both pulmonary and extrapulmonary tuberculosis.
Conventional chest X rays are typically used to diagnose pulmonary tuberculosis. However, other imaging modalities (e.g., CT, PET-CT, and MRI) are helpful in assessing both pulmonary and extrapulmonary tuberculosis.
The role of imaging in tuberculosis (TB) has shown exponential growth, as in all spheres of medicine. The possibility of a tubercular etiology is often first suggested on an imaging study, particularly in relatively inaccessible sites. In a known case of TB, imaging is often requested to assess the extent of disease, evaluate response to therapy, or detect residual infection after completion of therapy. Imaging also plays a vital role in guiding aspiration and biopsies and provides guidance for therapeutic drainage of pathological fluid collections.
All the imaging modalities, ranging from radiography to combined positron emission tomography/computed tomography (PET-CT), have their role depending on the clinical profile of the patient. Despite the advent of CT, PET-CT, and magnetic resonance imaging (MRI), conventional radiography remains the initial modality for suspected pulmonary TB or for mass screening purposes, and its role in musculoskeletal imaging remains unchallenged. The introduction of digital or computed radiography has enhanced the throughput, with improvement in image quality and reduction of radiation dose to patients. Owing to its high speed and better resolution, CT is the modality of choice for evaluation of thoracic, gastrointestinal, and urogenital TB. Multislice CT has practically replaced conventional barium studies as well as intravenous pyelography. Nephrotoxicity of the contrast media used for CT remains a cause of concern, especially in patients with impaired renal function. Its multiplanar imaging capability and unsurpassed soft tissue contrast resolution make MRI the modality of choice in evaluating central nervous system (CNS) TB. Advancements in MR technology have resulted in expansion of the role of MRI in other parts of body also. PET-CT has the advantage of providing anatomical and metabolic information. It is expected to improve the sensitivity and specificity; however, more studies are required to establish its role in detection, differentiation, and follow-up of TB.
Although any organ of the body can be involved by TB, the lung remains the most commonly involved organ. The imaging appearances of TB may mimic a number of other diseases, and it is imperative to correlate imaging findings with clinical profile and other investigations.
In the following, the imaging appearances of TB are described for five major categories: pulmonary, CNS, abdominal, musculoskeletal, and miscellaneous.
PULMONARY TUBERCULOSIS
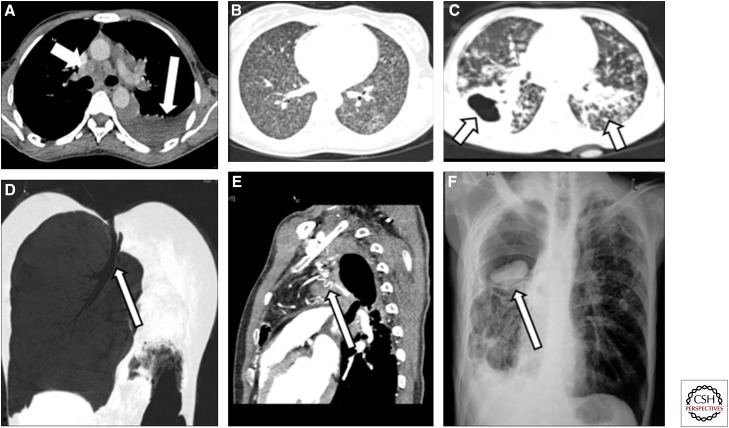
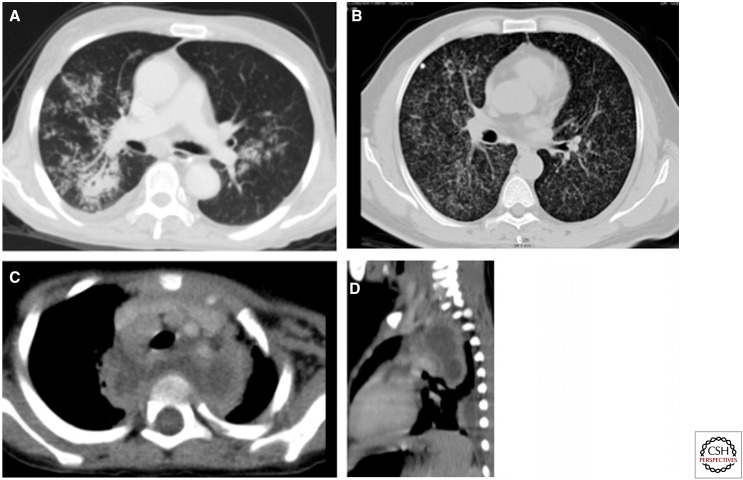
Mycobacterium tuberculosis is an airborne organism that reaches the pulmonary alveoli. It has conventionally been divided into primary and postprimary TB (Figs. 1 and 2).
Figure 1.
Spectrum of imaging findings in pulmonary tuberculosis (TB). (A) Axial computed tomography (CT) section of the mediastinum showing a hypodense subcarinal and precarinal node (short white arrow) and left pleural effusion (long white arrow). (B) Axial lung window CT section showing numerous miliary nodules in both lung fields. (C) Axial lung window section showing a thick-walled cavity in the right lung (arrow) and numerous centrilobular nodules in the left lung (arrow). (D) Coronal minimum intensity projection (MiniP) showing bronchostenosis leading to complete cutoff of the left main bronchus (arrow) and resultant collapse of the left lung. (E) Sagittal section of CT angiogram showing numerous tortuous dilated vessels (arrow) in a patient with hemoptysis and a history of TB 20 yr previously. Bronchial artery embolization was performed for this patient. (F) Chest radiograph posterioanterior (PA) view showing a dependent aspergilloma in a tubercular cavity in the right upper lobe (arrow).
Figure 2.
Imaging findings in pulmonary TB. (A) Ill-defined parenchymal opacity with cavitation on the right side. Random nodules give a tree-in-bud appearance in both lungs. (B) Diffuse miliary mottling in both lungs. Note the calcified granuloma and fibrotic strands on the right side. (C,D) Axial and sagittal reconstructions show conglomerate necrotic posterior and superior mediastinal lymphadenopathy displacing the trachea and branches of the arch of aorta anteriorly and extending into the retropharyngeal region, giving an abscess-like appearance.
Primary Tuberculosis
Primary TB is due to first-time exposure to mycobacterium bacilli. In TB-endemic regions, primary pulmonary TB often begins early in childhood with the inhalation of the tubercle bacillus (Raviglione and O'Brien 2005); however, it may be seen in adults, especially in developed countries, where the incidence of primary TB in adults has been reported to be 23%–34% (Miller and Miller 1993).
Primary TB may manifest as parenchymal disease, lymphadenopathy, pleural effusion, miliary disease, or any combination thereof. It may also present as lobar or segmental atelectasis. The inspired organism usually settles in the middle and lower lungs or in the anterior segment of the upper lobe, as these are the areas with greatest ventilation (Ghon focus), and extends via lymphatics to mediastinal nodes (Ghon complex). Once a Ghon focus undergoes fibrosis/calcification, it is called a Ranke focus, and, when calcification of lymph nodes occurs, it is called a Ranke complex. On plain radiography of the chest or CT, primary TB manifests as an area of homogeneous parenchymal consolidation, which is usually sublobar and subpleural. Multilobar consolidation is uncommon but can be seen in almost 25% of cases. The consolidation is usually dense; it may show an air bronchogram, especially on CT, and may mimic bacterial consolidation. Lobar or segmental atelectasis is a common radiological manifestation in children, the anterior segment of an upper lobe or the medial segment of the middle lobe commonly being involved. Associated enlarged nodes and poor response to antibiotics may provide clues to the diagnosis. With good immunity, the Ghon lesion usually heals, and a calcified focus seen on the chest radiograph in many adult patients is then the only telltale sign of infection in the remote past.
Enlarged paratracheal or hilar nodes differentiate primary from postprimary TB. Groups of lymph nodes more commonly involved are the hilar, right paratracheal, subcarinal, and aortopulmonary. In the Indian population, the right paratracheal group is the most commonly involved (Garg and Kalra 2010). CT is more sensitive than plain radiography in showing the enlarged nodes. Typically, affected nodes are larger than 2 cm and have low-attenuation centers on contrast CT, representing necrosis (Burrill et al. 2007). Low-density areas on enhanced CT are seen in 60% of the tubercular nodes (Gulati et al. 1994). Gross enlargement of lymph nodes may be seen in TB and may simulate sarcoidosis, lymphoma, or metastatic lymphadenopathy.
Pleural effusion may also be observed, and in some patients, it may be the sole manifestation of infection, especially in adult-onset primary TB. It is usually unilateral. Septations may be seen on ultrasound, reflecting the chronic nature of the disease.
With compromised immunity, a progressive primary infection may present as miliary disease. High-resolution CT is more sensitive than plain radiography in detecting such disease. The nodules are 1–3 mm in diameter and are seen in a perivascular and periseptal but random distribution.
Postprimary Tuberculosis
Both reactivation and reinfection with the tubercle bacillus are categorized under postprimary TB. In an adult with a healed remote infection, decreasing immunity may result in reactivation, which has a predilection for apical and posterior segments of the upper lobe and superior segments of the lower lobe. Postprimary TB is seen almost exclusively in adults and is characterized by a predilection for the upper lobe, cavitation, and absence of lymph node enlargement. A poorly defined area of consolidation is the earliest finding. These areas may evolve into more defined reticular or nodular opacities. Cavitation is the sine qua non of postprimary TB. It usually occurs in areas of consolidation with irregular thick walls. Cavitation may progress to endobronchial spread, which results in a typical tree-in-bud distribution of nodules in addition to cavitation. Pleural effusion, although more common in primary TB, is seen in ∼6%–18% of cases of postprimary TB (Woodring et al. 1986). The effusions are usually small and may be loculated. Pleura may be thickened.
The insidious nature of symptoms often causes a delay in diagnosis resulting in extensive disease, which in the long run leads to fibrosis, bronchial stenosis, and bronchiectasis. Bronchiectasis, a common complication of postprimary TB, is a result of a paracicatricial process secondary to pulmonary destruction and fibrosis. A tuberculous cavity with tortuous vessels may result in hemoptysis and secondary formation of aspergillomas or Rasmussen’s aneurysm. Persistent communication between the bronchial tree and pleural space caused by TB (bronchopleural fistula) not only is associated with considerable morbidity and mortality but also poses a challenging management problem.
Active or Inactive?
TB makes its presence felt on imaging long after the resolution of disease. Whether or not the infection is active is a question that forever plagues the radiologist. Active disease is in general characterized by the presence of centrilobular nodules, thick-walled cavities, consolidation, miliary nodules, pleural effusions, or necrotic lymphadenopathy. Resolution to thin-walled smooth cavities, fibrosis, and parenchymal, nodal, or pleural calcifications often denotes remote infection. Air fluid level within a cavity may indicate superadded infection. In addition, involvement of the chest wall and osseous structures signifies activity.
Tuberculosis in HIV Patients
HIV patients are more susceptible to TB. Leung et al. (1996) compared the CT scans of HIV-positive and HIV-negative patients with TB and found that the former showed more features resembling primary TB. Radiological manifestations in HIV-associated pulmonary TB have been found to be related to the level of immunosuppression. HIV-seropositive patients with a CD4 T lymphocyte count of <200/mm3 have a higher incidence of mediastinal or hilar lymph node enlargement, a lower prevalence of cavitation, and more frequent extrapulmonary involvement as compared with HIV patients with a CD4 T lymphocyte count of >200/mm3 (Goodman 1990; Barnes et al. 1991; Jeong and Lee 2008).
CENTRAL NERVOUS SYSTEM TUBERCULOSIS
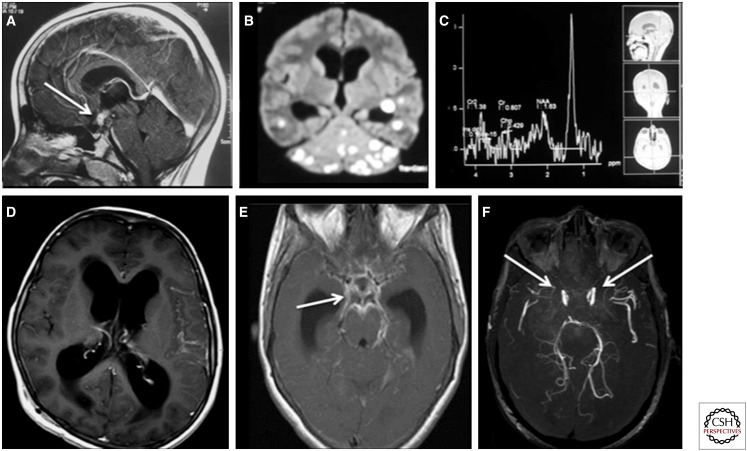
Involvement of the CNS produces the most devastating manifestations of the disease (Figs. 3–8). With the global pandemic of HIV infection, the incidence of CNS infections has also increased. CNS involvement may develop during the initial exposure or in the postprimary phase.
Figure 3.
Spectrum of imaging findings in central nervous system tuberculosis. (A) Sagittal T1 postgadolinium magnetic resonance (MR) image showing a ring-enhancing tuberculoma (arrow) in the region of the pituitary and hypothalamus in a patient who presented with diabetes insipidus. (B) Diffusion-weighted image of the brain showing numerous hyperintense lesions representing tuberculomas, which show central diffusion restriction. (C) MR spectroscopy at 135 ppm showing a lipid peak at 1.3 ppm. (D) T1 postcontrast axial image showing hydrocephalus as a complication of TB. (E) T1 postcontrast image showing basal meningeal enhancement (arrow) in a patient with meningeal TB. (F) Postcontrast MR angiogram showing complete absence of takeoff of the anterior cerebral artery and marked attenuation of the middle cerebral arteries (arrows), suggesting tubercular vasculitis. The patient had dense basal exudates.
Figure 4.
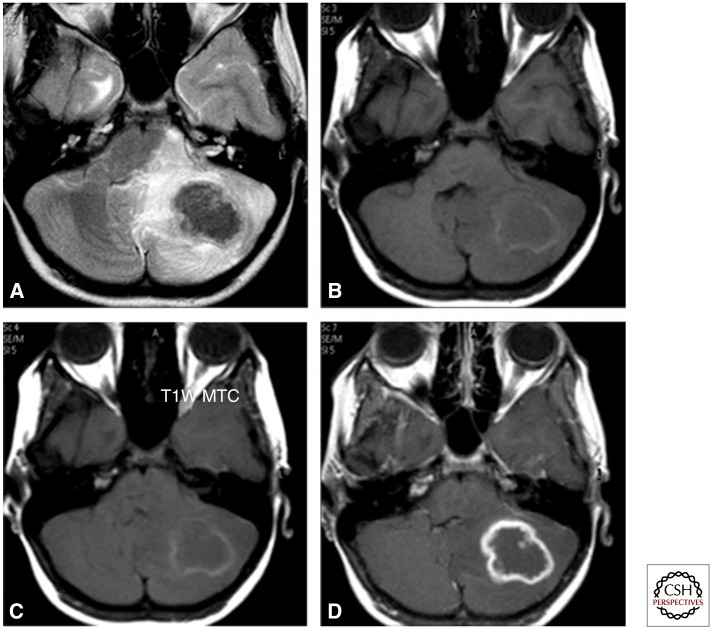
Axial T2 image (A) showing a lobulated lesion of low intensity in the left cerebellum with perilesional oedema showing a hyperintense signal. Corresponding T1 (B) and magnetization transfer contrast (C) images show a peripheral rim of mild hyperintensity with central iso- to hypo-intense signal. Postcontrast scan (D) shows rim enhancement with a central nonenhancing area.
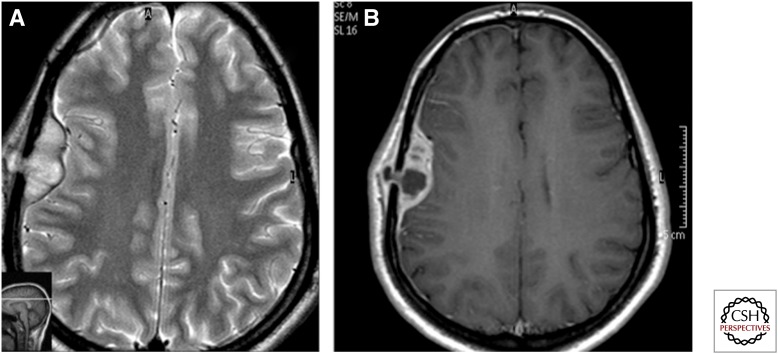
Figure 5.
Axial T2 (A) and postcontrast axial T1 (B) images showing an extradural collection in the right frontoparietal region with extension to the subgaleal region through a focal lytic lesion in the parietal bone—collar stud appearance, tubercular.
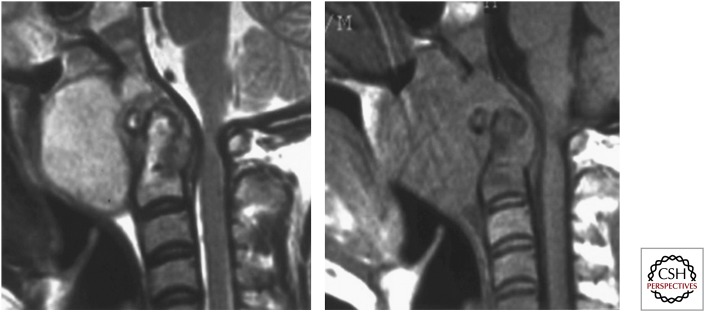
Figure 6.
Sagittal T2 and T1 images showing partial destruction with signal alteration of C1–2, especially the dens, with a large prevertebral collection. A thin epidural collection results in compression over the cervicomedullary junction.
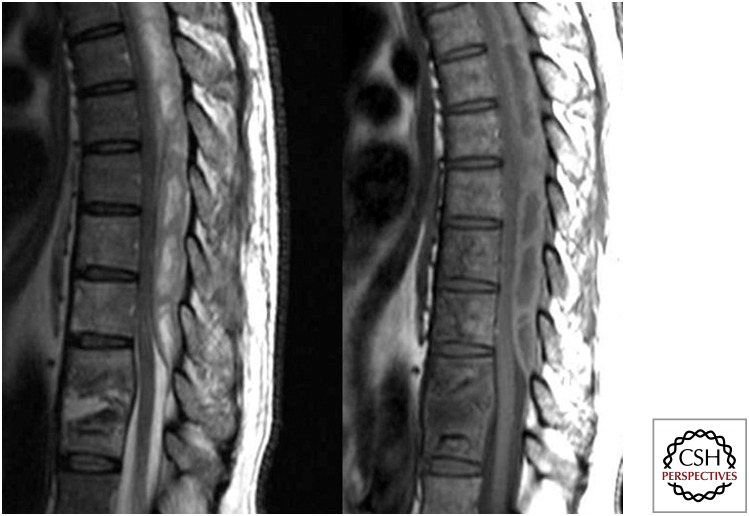
Figure 7.
Sagittal T2 and T1 images showing partial destruction with signal alteration of D9–10 and of D7–8 with involvement of the intervening disc. An associated large posterior epidural collection from D9 upward is resulting in moderate to marked compression over the adjacent dorsal cord, which is pushed anteriorly.
Figure 8.
Sagittal T2 and postcontrast sagittal and axial images showing a well-defined intramedullary lesion with a low-intensity signal on T2 and rim enhancement on contrast images. Intramedullary tuberculoma.
Various forms of involvement of the CNS, often coexistent, are observed: parenchymal (Fig. 4), meningeal (meningitis and its sequelae or complications) (Fig. 3), calvarial (Fig. 5), and spinal (Figs. 6–8).
Parenchymal Tuberculosis
The parenchyma may be involved either from direct spread from cerebrospinal fluid (CSF) or through hematogenous dissemination. Indeed, the most commonly involved territories within the brain are the corticomedullary junction and the periventricular region, typical for hematogenous dissemination.
Parenchymal involvement is most frequently seen in the form of a tuberculous granuloma (tuberculoma, the classic lesion) (Celso et al. 2009), but it can also be observed in various other forms, including tuberculoma en plaque, tuberculous abscess, cystic tuberculoma, multiple grapelike tuberculoma, microtuberculoma, calcified tuberculoma, and tuberculous encephalopathy. The imaging appearance of tuberculoma on MRI depends on the stage of the tuberculoma. A noncaseating granuloma is hyperintense on T2 and hypointense on T1 and shows solid enhancement. A solid caseating granuloma is hypointense on both T1 and T2, although it may show a T1 hyperintense rim. When liquefaction of the center or caseous necrosis occurs, the center becomes hyperintense on T2. Caseating granulomas show ring enhancement. T1 magnetization transfer images have been described to increase lesion conspicuity. In addition, calculation of the magnetization transfer ratio allows relatively specific diagnosis of tubercular etiology. Central diffusion restriction and lipid peaks on MR spectroscopy are supportive of a diagnosis of tuberculomas. On CT, tuberculomas appear as round or lobulated soft tissue masses with varying attenuation and homogeneous or ring enhancement. A target sign (i.e., a central calcification or punctate enhancement surrounded by hypoattenuation and ring enhancement on CT [described by Margado and Ruivo 2005]) is suggestive but not diagnostic of tuberculoma. Tuberculomas in the pediatric age group are seen more frequently in cerebellum, whereas in adults they have a predilection for the cerebral hemispheres and basal ganglion. A number of lesions may mimic tuberculoma on routine imaging, including degenerating cysticercus, fungal granuloma, tumors such as lymphomas, and metastases. Newer techniques such as diffusion imaging, spectroscopy, and magnetization transfer imaging may help in differentiating these lesions (Gupta 2002; Patkar et al. 2012).
Tubercular abscess is relatively rare, being seen most often in immunocompromised patients. Abscesses lack epithelioid giant cells and have a wall composed of vascular granulation tissue. Unlike tuberculomas (which have a center of caseous necrosis), abscesses have a core of semiliquid pus with innumerable acid-fast bacilli (AFB)-positive bacilli. On imaging, abscesses are larger than granulomas, are multiloculated and show a T2 hyperintense center with a hypointense periphery. They generally show a thin rim of enhancement, although they sometimes display thick and irregular enhancement. Diffusion-weighted imaging and magnetization transfer imaging may help in differentiating a tubercular from a pyogenic abscess, the former showing low apparent diffusion coefficient and lower magnetization transfer ratio values (Gupta et al. 2001).
Miliary TB is often associated with TB meningitis (Trivedi et al. 2009) and presents as small (<2 mm) foci, which show low-intensity signal on T2 images and homogeneous nodular enhancement after administration of gadolinium.
Encephalopathy is an uncommon complication of cranial TB and is a result of a delayed hypersensitivity reaction to protein in tubercle bacilli. There is resultant extensive damage to white matter, seen on imaging as extensive brain edema (Patkar et al. 2012).
Meningeal Tuberculosis
Meningeal involvement can occur because of either rupture of a subpial granuloma into the CSF space or hematogenous spread from meningeal vessels (Trivedi et al. 2009). Characteristic of TB is the involvement of basal meninges with thick basal exudate. Such exudate is seen in the basal cisterns, sylvian fissure and, rarely, in meninges over the convexity; the cisternal component may result in hydrocephalus and cranial nerve involvement. The basal enhancement, hydrocephalus, tuberculomas, and infarcts are more common in tubercular meningitis than in pyogenic meningitis (Chowdhury et al. 1991; Patkar et al. 2012). Basal exudates show hyperdensity on CT, and lack of suppression of extra-axial CSF spaces may be seen on FLAIR images. Meningeal enhancement, particularly of the basal meninges, may be seen on administration of contrast. Contrast-enhanced MRI is superior to CT for evaluation of meningitis and its sequelae. Magnetization transfer imaging has been found to be useful in assessing the abnormal meninges and in differentiating tubercular from pyogenic meningitis (Patkar et al. 2012).
Diffuse and focal involvement of the dura may also be seen in the form of pachymeningitis, usually caused by a dural-based lesion. Whereas focal pachymeningitis is hypointense on T2, diffuse pachymeningitis shows hyperintensity on T2. Pachymeningitis, however, is a nonspecific finding.
There are a number of sequelae or complications of meningitis, and patients frequently present with complications, the most common of which include hydrocephalus, vasculitis, infarcts, and cranial nerve involvement. Hydrocephalus may be communicating (nonobstructive), noncommunicating (obstructive), or complex. Yadav et al. (2009) reported a high incidence of complex hydrocephalus in tubercular meningitis, resulting in failure of third ventriculostomy in these patients. MRI with recent advancements is superior to CT in evaluating the type of hydrocephalus and flow patterns and in patient follow-up.
Vasculitis occurs as a result of inflammatory changes in the vessels attributable to the basal exudates. Large intracerebral vessels are affected, including the terminal segment of the anterior cerebral artery, the middle cerebral artery, and the proximal anterior cerebral artery. Resulting intimal changes, vasospasm, thrombosis, and formation of mycotic aneurysms lead to large areas of cerebral infarction. The triad of a hydrocephalic pattern, narrowing of the arteries at the base of the brain, and narrowing or occlusion of small or medium-sized arteries with early draining veins on conventional angiography favors tubercular arteritis (Lehrer 1966). Focal segmental or uniform narrowing of large segments, an irregular beaded appearance of vessels, and complete occlusion are the features seen on MR or CT angiograms. MR scores more than CT in showing infarcts and in differentiating acute from chronic infarcts (Shukla et al. 2008). Basal ganglion, thalamus, and internal capsule are the common sites of infarcts in tubercular meningitis/vasculitis (Nair et al. 2009).
Cranial nerve involvement is another important sequela of tubercular meningitis and may be a result of ischemic changes in the nerve, entrapment of the nerve, mass effect on the nerve, or direct involvement of the cranial nerve nuclei by pathology. Chronic changes may lead to fibrosis and permanent functional loss of the affected nerve.
SPINAL TUBERCULOSIS
The spine is the commonest site of osseous involvement by TB. Spondylodiscitis, also known as Pott’s disease, is the commonest form; however, it can also manifest as tubercular myelitis, intramedullary tuberculoma, spinal meningitis, arachnoiditis, or epidural abscess.
Spondylodiscitis usually begins in the anterior part of the vertebral body adjacent to end plates, commonly in the lower dorsal and upper lumbar spine (Weaver and Lifeso 1984). Infection then spreads beneath the anterior longitudinal ligament or posterior longitudinal ligament or sometimes through the vertebral endplate. Vertebral body destruction, marrow edema, soft tissue abscesses, hyperintensity, and enhancement of disc and loss of disc height commonly ensue. The infection may spread into the spinal canal, with formation of epidural abscesses that may compress the thecal sac, causing neurological symptoms. Plain radiographs are normal in the early stages. The earliest sign may be demineralization of the endplates with resorption and loss of dense margins. As the disease progresses, radiographs will show progressive vertebral collapse with anterior wedging and gibbus formation. MRI is the most sensitive modality for early diagnosis and follow-up of spinal TB. The earliest sign is marrow edema, seen as hyperintense signal on T2 and STIR (short tau inversion recovery) images. With progression of the disease, MRI shows loss of definition of the endplates and adjoining vertebral bodies with hypointense signal on T1 and hyperintense signal on T2 and STIR images. At this stage, the intervertebral disc shows hyperintense signal on T2 and STIR images with loss of internuclear cleft. With further progression, there is reduction in the intervertebral space, varying degrees of collapse of the vertebrae, and resultant kyphosis. Associated pre- and paravertebral, as well as epidural collection/abscess, is best seen on MRI. The collapsed vertebrae along with the epidural collection/abscess may result in varying degrees of extradural compression, best evaluated on MRI. The cord changes in the form of edema or myelitis are best seen on STIR images. The most common differential diagnosis is pyogenic meningitis, which at times may be difficult to differentiate solely on the basis of imaging. Other conditions that may simulate spinal TB are lymphoma, metastasis, and myeloma. Uncommon presentations include involvement of a solitary vertebra, multifocal skip lesions, isolated neural arch involvement, intramedullary tuberculoma, and isolated tubercular myelitis. Intramedullary tuberculomas show a signal intensity and enhancement pattern similar to those of intracranial tuberculoma (Jena et al. 1991).
Spinal arachnoiditis follows almost the same pathology as cranial meningitis. MRI is the modality of choice for diagnosis of the arachnoiditis, the features consisting of CSF (cerebrospinal fluid) loculations, obliteration of the spinal subarachnoid space, clumping of nerve roots, and adherence to the dura, best seen on T2-weighted sequences. On sagittal sections, an irregular wavy appearance is seen. Axial sections may give the appearance of an empty thecal sac owing to adherence of nerve roots to the dura.
NECK TUBERCULOSIS
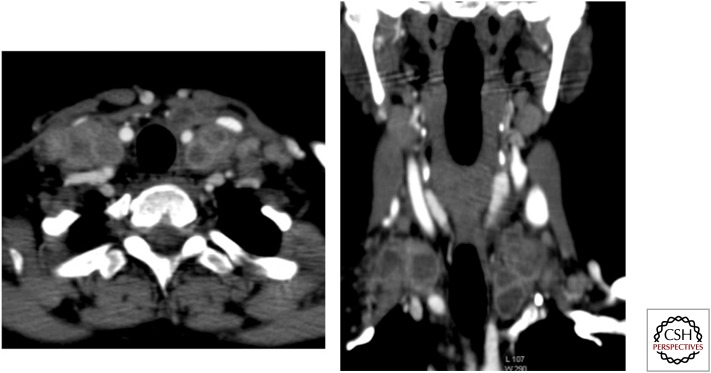
Involvement of the neck nodes is a relatively common manifestation in the form of painless cervical lymphadenitis. The enlarged lymph nodes initially may be homogeneous, but they subsequently develop central necrosis seen as central low attenuating areas on CT (Fig. 9) and areas of hyperintense signal on T2 MR images (Tan et al. 2010). Contrast study will show peripheral enhancement. It may, however, be difficult to differentiate involved nodes from necrotic nodes seen in metastatic head and neck squamous cell carcinomas on imaging alone. Extranodal involvement of the other neck structures, such as the larynx, pharynx, and sinonasal cavity, although rare, may be seen; the imaging findings in these cases are, however, nonspecific (Burrill et al. 2007).
Figure 9.
Postcontrast axial and coronal maximum intensity projection (MIP) images showing bilateral large conglomerate necrotic supraclavicular and cervical lymph nodes. Aspiration cytology confirmed tuberculosis.
ABDOMINAL TUBERCULOSIS
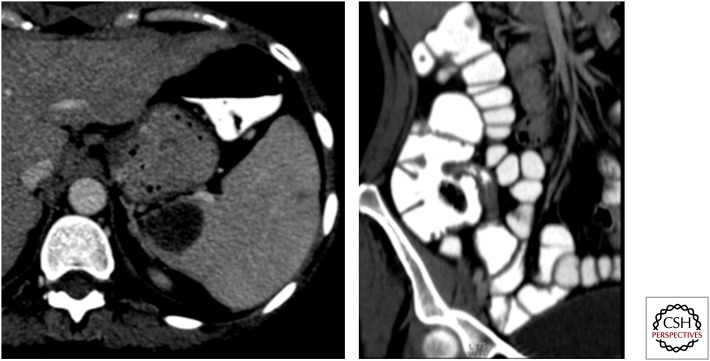
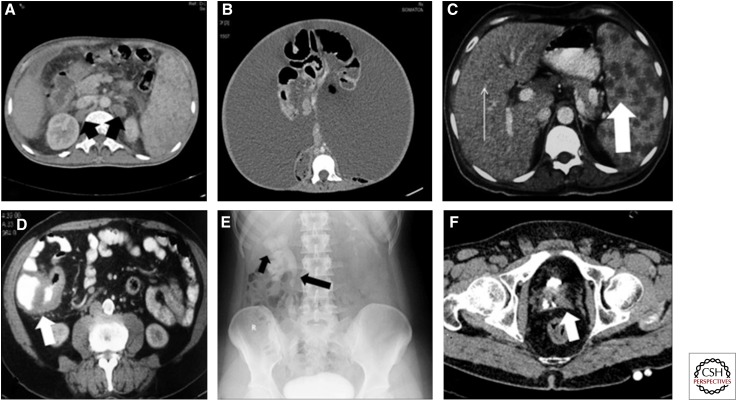
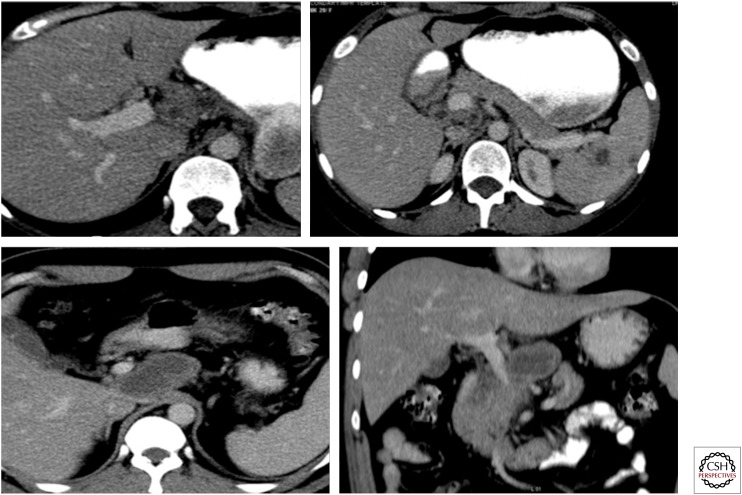
The abdomen is the sixth most common site of extrapulmonary TB (Prakash 2009). There may be involvement of the peritoneum and its reflections, the gastrointestinal tract, the lymphatic system, and solid organs such as the liver (Figs. 10–12).
Figure 10.
Axial and oblique coronal maximum intensity projection computed tomography images showing a well-defined lesion in the spleen with stricture in the terminal ileum. Note also two more small hypoattenuating lesions in the spleen. Ileal tuberculosis with splenic tubercular abscess.
Figure 11.
Spectrum of imaging findings in abdominal TB. (A) Axial computed tomography (CT) section of abdomen showing retrocaval and retro-aortic hypodense nodes (black arrow). Note splenomegaly and small hypodense lesions in the spleen. (B) Axial CT section showing wet tubercular peritonitis with high-density ascites. (C) Numerous small hypodense lesions in the liver (thin arrow) and larger hypodense lesions in the spleen (thick arrow) in a patient with disseminated tuberculosis. (D) Thickening of the ileo-caecal junction (white arrow). (E) KUB (kidney, ureter, bladder) radiograph as part of an intravenous urogram (IVU) study, showing an irregular cavity communicating with an upper pole calyx (short arrow) with stricture and deformation of the upper ureter (long arrow). (F) Small-capacity bladder with small amount of contrast within (thimble bladder).
Figure 12.
Contrast-enhanced computed tomography scan showing large necrotic lymph node posterior to and compressing the portal vein. Necrotic periportal lymph nodes and a few thick-walled cystic lesions (granulomas) are also seen in the spleen with septa. Tuberculosis was confirmed on histopathology.
Lymphadenopathy
Lymph node enlargement is the most common manifestation of abdominal TB and may or may not be associated with other abdominal organ involvement. Characteristically the nodal involvement reflects the lymphatic drainage of the involved bowel. The appearance of the involvement may range from an increased number of normal-sized nodes to grossly enlarged discrete nodes or a conglomerate with matting. Ultrasound shows a heterogeneous echotexture with a central hypoechoic area, in contrast to the homogeneously hypoechoic nodes seen in lymphoma (Prakash 2009). Abdominal lymph node involvement is best evaluated on CT. Plain scans show low or soft tissue attenuation values. Contrast-enhanced scans may show peripheral enhancement (the central liquefactive portion is nonenhancing) or heterogeneous enhancement and rarely homogeneous enhancement (Suri et al. 1999). MRI also may show different patterns; the appearance is typically hypointense on T1 images, whereas on T2 images, the signal is generally hyperintense or there is a central hyperintense signal with peripheral low-intensity signal. Rarely, hypo- to isointense signal is observed on T1 as well as T2 images (Sinan et al. 2002; Prakash 2009).
Peritoneal Involvement
Peritoneal involvement can occur through hematogenous spread to the peritoneum or via rupture of involved nodes, small bowel lesions, or the fallopian tubes. The imaging appearance has been classified into three types (Tarique et al. 2002).
Wet—The most common type, characterized by high-density free or loculated ascites. The hyperattenuation on CT may be attributed to the high protein and cellular content.
Dry—An uncommon type of peritoneal TB characterized by peritoneal caseous nodules and a fibrous reaction.
Fibrotic—Associated with omental masses, matted bowel loops, and occasionally loculated ascites.
The CT appearance is nonspecific and can also be seen in peritoneal carcinomatosis, mesothelioma, peritonitis, and rarely lymphoma.
Hepatosplenic Involvement
Hepatosplenic involvement is commonly seen in patients with disseminated TB. The lesions may be miliary with innumerable small nodules of 0.5–2 mm (which may or may not be seen on CT but on ultrasound usually present as bright liver or spleen patterns in the form of a diffuse increase in echogenicity). A macronodular form, visualized as large hypoattenuating nodules on CT or hypoechoic lesions on ultrasound, is rare. These lesions may eventually undergo calcification (Burrill et al. 2007). MRI is more sensitive than ultrasound and CT in detecting hepatosplenic TB.
Gastrointestinal Tract Involvement
Any part of the GI tract may get involved, but the most commonly involved segment is the ileocecal region. Esophageal and gastric TB is uncommon but usually seen in association with thoracic TB. Obstruction due to ileocecal TB is most common. Plain radiographs may show enteroliths, with features of obstruction including multiple air fluid levels. Imaging features of small bowel TB will depend on the stage of pathology. Initially, it may be seen as rapid transit of contrast, hypersegmentation, or flocculation of the contrast column, or changes in the contour or mucosal pattern of intestine. Later, there is sclerosis, hypertrophy, and stenosis, resulting in a short stricture or strictures that have smooth but stiff contours and in which mucosal relief has disappeared (Prakash 2009). Multiple strictures with segmental dilatations are a common feature in small bowel TB. Fixity of loops, spiculation, matting, and signs of malabsorption are other features.
The ileocecal region is the area most commonly affected because of physiological stasis, abundant lymphoid tissue, increased rate of absorption in the region, and closer contact of the bacilli with mucosa in this region (Leder and Low 1995). Mural thickening involving both the ileum and the cecum is commonly identified on CT. The thickening is commonly concentric, although when eccentric, it frequently involves the medial cecal wall. Localized lymphadenopathy, surrounding fat stranding and skip lesions in the small bowel are often seen. On barium studies, thickening, spasm, and hypermobility of an incompetent ileocecal valve are considered characteristic. A gaping ileocecal valve with narrowing of the terminal ileum (Fleischner sign) or a narrowed terminal ileum with rapid emptying of the involved segment through a gaping ileocecal valve into a shortened, rigid, obliterated cecum (Stierlin sign) raise the suspicion of ileocecal TB. Shallow mucosal ulceration with elevated margins may also be seen if a double contrast examination is performed (Thoeni and Margulis 1979; Nakano et al. 1992). Retraction of the mesocolon eventually results in a “pulled-up cecum.” CT enteroclysis further improves the sensitivity in early diagnosis. At present, MR is not widely performed for evaluation of intestinal TB, but bowel wall changes can be well evaluated with MR enteroclysis. Crohn’s disease and lymphoma mimic ileocecal TB and may be difficult to differentiate on imaging alone.
Isolated large bowel involvement is less common and is seen in only about 9% of cases of GI tract TB (Theoni and Margulis 1979) and usually presents as a long or short segment of spiculations, spasm, rigidity, or ulceration.
Adrenal Involvement
Adrenal TB is the commonest cause of the adrenal insufficiency (Addison’s disease). Tubercular involvement of adrenal glands on contrast-enhanced CT may be seen as bilateral enlargement of the gland with or without internal necrotic areas or calcification and in later stages, as a small gland with or without calcification (Francis and Korobkin 1997).
GENITOURINARY TUBERCULOSIS
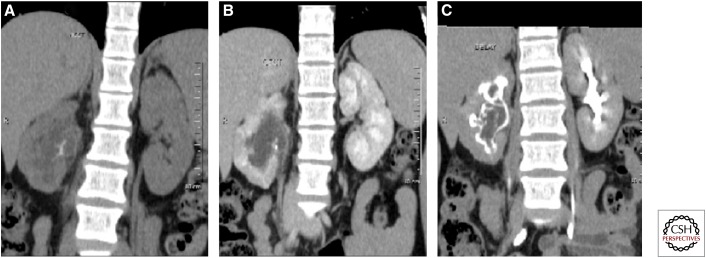
Genitourinary TB is one of the common extrapulmonary manifestations (Fig. 13). The spread is usually hematogenous but may be by direct extension.
Figure 13.
Coronal maximum intensity projection precontrast (A) and early (B) and delayed (C) postcontrast images in a case of renal tuberculosis, showing cortical irregularity of the right kidney with echogenic debris in the collecting system on ultrasound. CT shows calcification within the soft tissue, which is seen as a filling defect on delayed images. Mild hydronephrosis is seen with pelvi-ureteric junction obstruction. Note the thick-walled right ureter.
Parenchymal TB is usually associated with collecting system involvement and in the initial stage, results in localized tissue edema and vasoconstriction which can be seen on contrast-enhanced CT or MRI as areas of hypoperfusion; however, these findings are nonspecific (Jung et al. 2005). The collecting system is the most commonly involved site. In early stages, papillary necrosis or calyceal deformity occurs, whereas once acute inflammation has resolved, multifocal strictures may be seen (Wang et al. 2003). Erosion of the calyces results in an irregular contour and feathery appearance. Deformation of the collecting system gives rise to characteristic appearances: infundibular stenosis resulting in traction on the renal pelvis (Kerr’s kink), deformity of the pelvis causing a “hiked-up” pelvis and complete cut off of the calyx resulting in a phantom calyx. Resultant stasis leads to the production of renal calculi, which today are the most common manifestations of renal TB. Parenchymal scarring and calcification are also seen (Bhalla et al. 2009). Contrast-enhanced CT/CT urography is the most sensitive modality to show early lesions. Depending on the extent of the disease, ultrasound may show alterations in parenchymal echogenicity, well-defined parenchymal lesions, liquefying tubercular cavity, perinephric abscess, or parenchymal calcification. The major role of ultrasound remains the provision of guidance for interventional procedures.
The passage of tubercle bacilli into the collecting system results in involvement of the rest of the genitourinary system as well. The ureters initially respond with atony caused by the bacilluria, seen as dilatation. Eventually, irregularities caused by mucosal erosion and scarring are observed, producing a beaded appearance. Severe thickening of the wall in late stages gives rise to a “pipe stem” ureter. If not diagnosed and treated at an early stage, the kidney loses its morphology and may appear as multiple thin-walled cysts or as a multiloculated cyst. Sometimes, inadequately treated TB results in dystrophic calcifications involving the entire kidney, so-called putty kidney (Kim 2000).
Large tuberculomas within the bladder wall may present radiologically as filling defects. Scarring results in a thickening of the wall and contracture of the bladder, giving the appearance of a “thimble bladder.”
GENITAL TUBERCULOSIS
TB may affect the male as well as the female genital tract via the hematogenous or lymphatic route or via direct extension from the lower urinary tract (Fig. 14).
Figure 14.
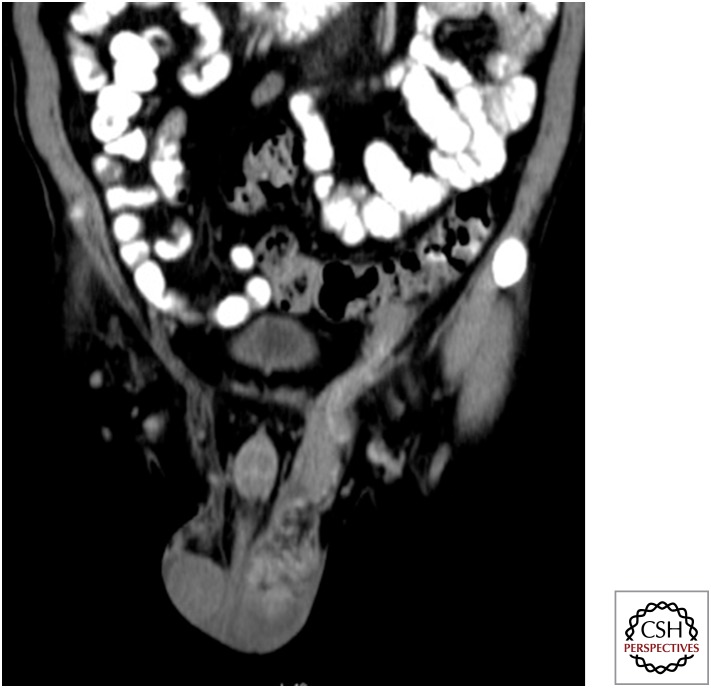
Coronal maximum intensity projection image showing left epididymo-orchitis with left-sided hydrocele. Note the thickened left spermatic cord—funiculitis.
The epididymis is one of the male genital organs most commonly affected by genital TB. Ultrasound shows a heterogeneous texture with diffuse swelling (Kim 2000; Jung et al. 2005). As at other sites, MRI shows relatively low-intensity signal on T2 images with enlargement. Involvement of the prostate can be in the form of prostatitis or abscess; on ultrasound, the former is seen as low echogenicity and increased vascularity. Prostatic abscess on MRI appears as a peripherally enhancing lesion with radiating, streaky areas of low-intense signal, often called the watermelon skin (Engin et al. 2000; Jung et al. 2005). Prostatic abscesses and periurethral abscesses and fistulas may also result, although relatively uncommon. Urethral strictures are another uncommon manifestation, and when seen, they commonly involve the bulbo-membranous junction (Bhalla et al. 2009). Dystrophic calcification results in long-standing cases. The seminal vesicles and the vas deferens also can be involved by TB, and cross-sectional images show wall thickening, contraction, or intraluminal or wall calcifications (Birnbaum et al. 1990; Kim 2000). In females, the fallopian tubes are the genital organ most often involved. Ascending infection of the female genital tract results in hydrosalpinx and complex tubo-ovarian masses. Ultrasound via the transabdominal and transvaginal routes is very helpful in making the diagnosis, as well as assessing extent. Hydrosalpinx is seen as an aperistaltic, tubular anechoic channel with incomplete septations. Tubo-ovarian masses are seen as a conglomerate mass which is unilocular or multilocular with a thickened wall that may show enhancement on contrast-enhanced MRI. Normal ovarian follicles may sometimes be identified as a part of the mass.
MUSCULOSKELETAL TUBERCULOSIS
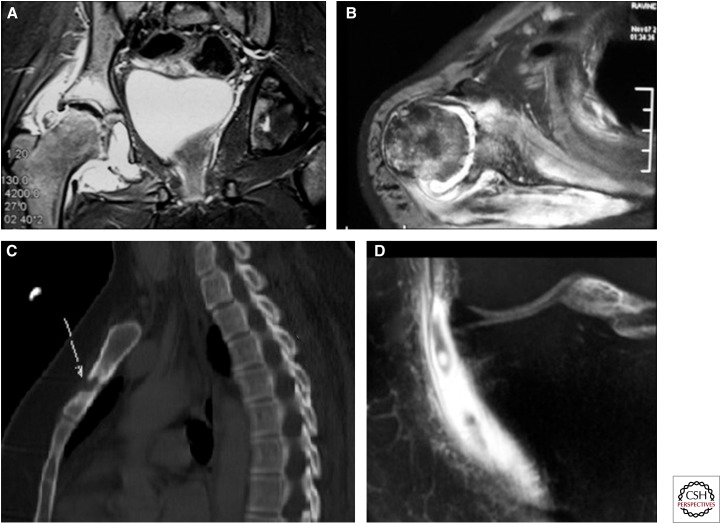
Any part of the musculoskeletal system can get involved at any age, but the large weight-bearing joints of the lower limb—hip, knee and ankle—are most commonly involved (Fig. 15). The smaller joints of the foot and hand, shoulder, elbow, and sternoclavicular and sacroiliac joints may also become affected. Isolated tubercular osteomyelitis may affect long as well as short tubular bones. The flat bones such as the skull, ribs, sternum, and iliac bones or bones of the carpus and tarsus, especially the calcaneum, may also be involved (Murray and Jacobson 1997).
Figure 15.
Spectrum of imaging findings in musculoskeletal tuberculosis. (A,B) Synovial thickening and surrounding bone changes. (C) Sagittal MIP CT image showing a lytic lesion in the sternum with surrounding mild sclerosis. (D) T1 postgadolinium coronal image showing thickening and enhancement of the medial collateral ligament bursa of the knee as a result of tubercular bursitis.
Imaging findings in musculoskeletal TB are often nonspecific and only indicative of an infective etiology, rather than of an exact causative organism. Chronicity of the lesion is often the only pointer toward a tubercular etiology. Marked periostitis, sequestra formation, and sclerosis are seen more often in pyogenic infection, whereas transphyseal spread and joint involvement tend to indicate a tubercular etiology.
Plain radiography of the suspected area is the ideal initial modality and, along with the clinical profile, can point toward the diagnosis. In the initial stages, plain radiographs may be normal and further evaluation with MRI, CT, or ultrasound may be required. Because of unsurpassed soft tissue contrast resolution, MRI is the most sensitive modality for early diagnosis and complete delineation of the disease. Conventional T2 and STIR images are most useful. CT has the advantages of showing bony destruction and being capable of guiding interventional procedures. In experienced hands, ultrasound with high-frequency transducers can provide invaluable information about the synovium, tendon sheaths, and bursal spaces and effusions. Isotope scan is sensitive but not specific.
Articular TB is commonly monoarticular and involves large joints. Synovitis, osteopenia, and marginal erosions are seen. Resulting hyperemia may result in the overgrowth of epiphysis in children. In chronic stages, fibrous ankylosis may be seen. Bony ankylosis may also be seen, although this is more common with pyogenic infections. In the initial stages, plain radiographs may show widening of joint space with soft tissue swelling. With progression of the disease process, marginal erosions, smudged and indistinct articular cortex, and still later loss of subchondral bone are seen on radiographs. Phemister’s triad of juxta-articular osteoporosis, peripherally located osseous erosions, and gradual narrowing of joint space indicate TB (Harisinghani et al. 2000). MRI scores more than other modalities in showing all features of tubercular pathology—synovitis, active and chronic pannus, articular erosions, cartilage destruction, abscesses, tenosynovitis, bursitis, periarticular inflammation, and marrow edema (Sawlani et al. 2003). MRI without gadolinium may not always differentiate fluid from thickened synovium, but after administration of contrast, the synovium shows early enhancement and so can be differentiated from fluid. Ultrasound can differentiate synovial thickening from effusion, the former being hypoechoic and fluid, anechoic.
Tubercular osteomyelitis is usually accompanied by arthritis. Osteopenia with lytic lesions without significant surrounding sclerosis points toward TB. Involvement of the epiphysis across the growth plate is often seen, unlike in pyogenic infection. Short tubular bones may be involved, producing a fusiform soft tissue swelling with associated periostitis. Cystic TB is a distinct form of TB commonly seen in children, leading to cystic lucencies in the bone with minimal surrounding sclerosis.
Tubercular tenosynovitis may be seen, commonly involving tendons of the hand. In the first stage, only a serous exudate is observed. As infection progresses, thickening of the synovium and presence of T2 hyperintense material within synovial fluid are seen, and eventually soft tissue masses form. Tubercular bursitis has also been described and commonly affects sites subjected to frequent trauma. The infected bursa may involve adjacent muscles, joints, tendons, and bones (Jaovisidha et al. 1996).
MISCELLANEOUS
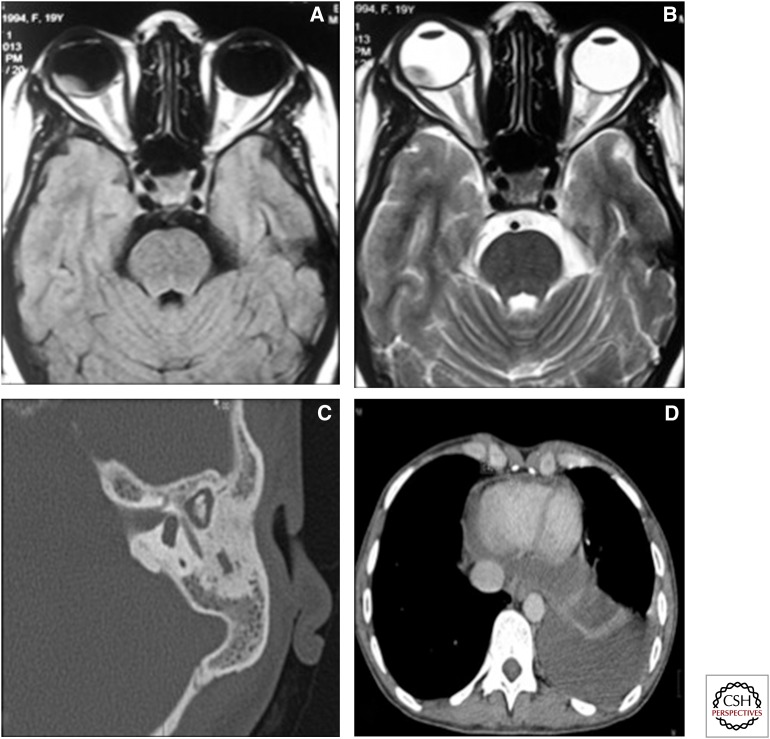
In a country where TB is endemic, like India, the disease may involve locations such as the eyes (Helm and Holland 1993), heart, temporal bone (Moon et al. 1997), and breast, which are otherwise exceedingly rare sites of TB (Fig. 16).
Figure 16.
Unusual and miscellaneous sites of involvement. (A) T1 axial image and (B) T2 axial image of the orbit showing a T1 hyperintense and T2 hypointense mass initially diagnosed on imaging as a choroidal melanoma. The patient had disseminated TB, and the ocular lesion was proven to be a caseating granuloma. (C) High-resolution CT of the temporal bone in a patient with tubercular otomastoiditis showing relative preservation of the ossicular chain and mastoid air cells. (D) Axial CT image, mediastinal window, showing thickening of the pericardium and pericardial effusion.
Cardiac TB is rare and generally involves the pericardium. It may present as pericardial effusion or a combination of effusion and constriction (Mayosi et al. 2005). Constrictive pericarditis is seen on imaging as thickened irregular pericardium with or without calcification. Accompanying signs of congestive cardiac failure may be seen. Myocardial TB is extremely rare and presents as a mass-like lesion or a diffuse infiltrative lesion (Jagia et al. 2010; Gulati and Kothari 2011).
TB is also a common cause of otomastoiditis. In a patient with soft tissue in the middle ear and mucosal thickening of the external auditory canal, the relative preservation of walls of the mastoid air cells and scutum without significant sclerosis points toward a tubercular etiology (Rho et al. 2007).
PET-CT Scanning in TB
PET-CT scanning is nonspecific for tumor as well as infectious and inflammatory conditions (Figs. 17 and 18). Therefore, interpretation of any positive fluorine-18 fluorodeoxyglucose (FDG) study should include consideration of benign diseases, including TB, especially in the tubercular endemic regions (Zheng et al. 2011). Soussan et al. (2012) described two distinct patterns of FDG PET activity in pulmonary TB—the pulmonary pattern and the lymphatic pattern. In the pulmonary pattern, FDG uptake was seen within the cavitary or noncavitary consolidation surrounded by micronodules along with mild to moderate tracer uptake within the mediastinal and hilar lymph nodes. In the lymphatic pattern, usually observed in patients with extrapulmonary/systemic symptoms, FDG uptake was seen as extrathoracic involvement. In patients with the lymphatic pattern, hilar and mediastinal lymph nodes were larger and showed higher uptake. Therefore, FDG PET improved specificity, especially in the detection of pulmonary tubercular involvement. Assessment of a single pulmonary nodule in endemic areas returns a high false-positive rate for malignancy (Li et al. 2011). Tubercular pleuritis can be confused with pleural mesothelioma on FDG PET (Yeh et al. 2009). Dual point imaging has been advocated to distinguish between tubercular and malignant lesions but has shown only limited promise (Yen et al. 2008; Razak et al. 2011).
Figure 17.
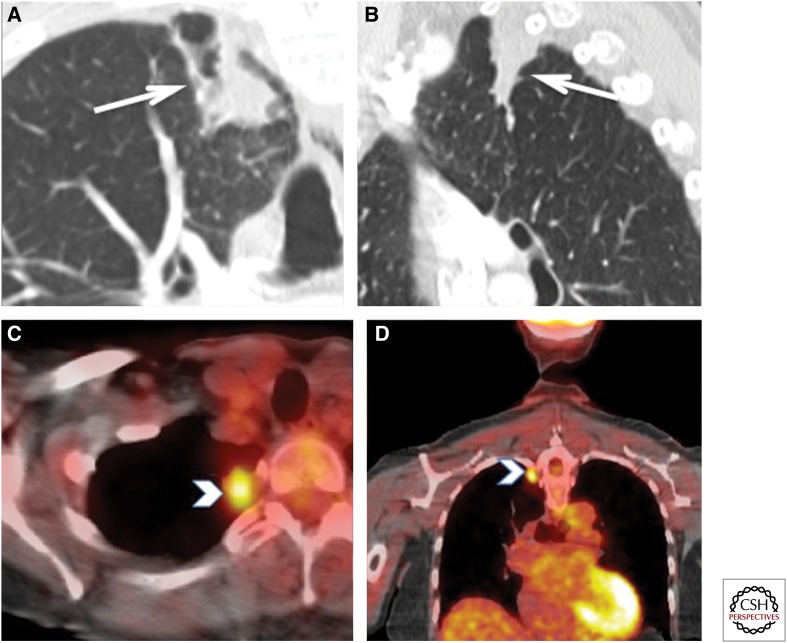
Biopsy-proven FDG-positive tuberculosis. This ex-smoker 72-year-old woman was detected with a mass at the right lung apex on a thyroid ultrasound. (A,B) Enhanced computed tomography (CT) of the chest showed a 28 × 15-mm ill-defined nodular density abutting the pleura (white arrows). There was no enlarged mediastinal or hilar lymph nodes. (C,D) Axial and coronal fused PET-CT images show increased tracer uptake with a maximum SUV of 4.0 (white arrowheads). No other FDG-avid lesions were identified. These findings were suspicious for bronchogenic, but a wedge resection pathology of this lesion showed “few acid-fast bacilli seen with necrotizing granulomatous inflammation.” No carcinoma was seen. Therefore, this FDG uptake can be seen in active tuberculosis. This patient was subsequently treated with antitubercular treatment.
Figure 18.

Increased activity in an atypical mycobacterium infection (culture proven). A 70-year-old female with previous computed tomography (CT) changes of atypical mycobacterium underwent PET-CT for follow-up of surgically resected tonsillar squamous cell carcinoma. (A,B) Peripheral moderate increased FDG uptake (arrow) in a new right lung cavitary lesion with additional two new, tiny lung nodules showing mild increased tracer uptake (arrowhead). The differential diagnosis included metastatic disease, aspiration, and infection including atypical mycobacterium. A bronchoscopically obtained specimen grew atypical mycobacterium.
FDG PET-CT has been shown to be useful (Tian et al. 2010b; Yadla et al. 2012) for the assessment of response to treatment in extrapulmonary TB (Fig. 19), and a decrease of approximately one-third in maximum standardized uptake value (SUV) has been reported at one month (Martinez et al. 2012). In addition, nonresponders can be predicted from the responders on the basis of persistent uptake in the five or more mediastinal lymph node stations and a maximum SUV >10 on delayed dual-point FDG imaging (Sathekge et al. 2011). In patients in whom the majority of lesions are improving on anticarcinogenic treatment but who also display nonresponding FDG-avid lesions, the latter may be of another etiology, including TB (Lee et al. 2011).
Figure 19.

Minimal to no activity in a treated known TB case. A 53-year-old male with known history of lymphoma and culture proven TB was on antitubercular treatment. A computed tomography (CT) section shows patchy consolidations (left) that were predominantly in upper lobe distribution. PET-CT after 7 mo (right) shows almost total resolution of consolidations, and there is no significant increased tracer uptake in this treated TB (middle).
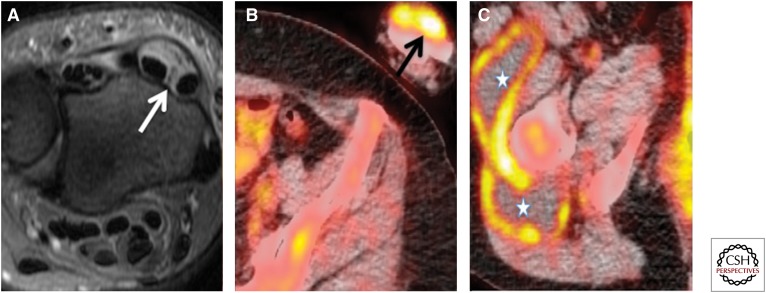
Abdominal and peritoneal TB is another presentation of TB in endemic countries. FDG PET-CT shows high false-positive rates in abdominal TB (Shimamoto et al. 2007; Takalkar et al. 2007; Tian et al. 2010a), but the distribution pattern may help in distinguishing peritoneal carcinomatosis from TB (Jeffry et al. 2003). Diffuse hepatosplenic FDG uptake without focal anatomical lesions may be a predictor of TB after lymphoma in these organs (Jeong et al. 2010). FDG PET-CT can detect tubercular involvement of unknown and unexpected sites (including tuberculous arthritis [Fig. 20] and common bile duct, pharyngeal, jejunal, and adrenal TB), in cases which were initially thought to be malignant (Wang and Lin 2006; Roudaut et al. 2008; Ito et al. 2010; Dong et al. 2013; Wang et al. 2013). HIV-positive patients are at increased risk of malignancy as well as TB, and FDG PET-CT scanning was found not to be useful in distinguishing these three entities (Sathekge et al. 2010).
Figure 20.
Biopsy-proven left wrist tubercular synovitis and right thigh nontubercular trochanteric bursitis. Nonsmoker 48-year-old female with previous BCG vaccination suffers from rheumatoid arthritis and drug-induced Sjogren’s syndrome. She underwent a PET-CT to rule out malignancy. (A) Fast relaxation fast spin echo T2-weighted axial section show left wrist extensor compartment tenosynovitis (white arrow). (B,C) Axial fused PET-CT images show left wrist dorsum uptake (black arrow) and multiloculated collection in the right thigh with peripheral uptake (asterisk). The synovectomy of left wrist showed tuberculosis; however, repeated aspirations and cultures of right thigh collections were negative for fungal and acid-fast bacilli with no growth and therefore attributed to right trochanteric bursitis.
FDG PET-CT scanning for staging of lung carcinoma is more specific, especially in TB-prevalent areas (Lee et al. 2009). Carbon-11 choline is useful in distinguishing between pulmonary malignancy and TB, but its role in extrapulmonary TB needs further research (Chen et al. 2008).
The authors believe that as more data become available from areas where TB is endemic, owing to the increasing availability and use of FDG PET-CT scanning, there will be emerging specific use of this modality.
SUMMARY
TB is rife in developing countries, but it has also shown increased incidence in developed countries because of infection of immunocompromised hosts. TB can involve any organ system in the body, and there is a wide range of imaging features. Whereas diagnosis continues to require a high index of clinical suspicion, imaging has a very important role to play in both the diagnosis and the management of TB. PET-CT is an emerging technology in developing countries, and further data from these countries will assist in formulating exciting indications for this modality along with the already established options of plain radiography, ultrasound, CT, and MRI.
Footnotes
Editors: Stefan H.E. Kaufmann, Eric J. Rubin, and Alimuddin Zumla
Additional Perspectives on Tuberculosis available at www.perspectivesinmedicine.org
REFERENCES
- Barnes PF, Bloch AB, Davidson PT, Snider DE Jr. 1991. Tuberculosis in patients with human immunodeficiency virus infection. N Engl J Med 324: 1644–1650. [DOI] [PubMed] [Google Scholar]
- Bhalla AS, Gupta AK, Sharma R. 2009. Tubercular infection of the urinary tract. In Diagnostic radiology genitourinary imaging, 3rd ed. (ed. Khandelwal N, Chowdhury V, Gupta AK) pp. 120–138. Jaypee Brother Medical, New Delhi, India. [Google Scholar]
- Birnbaum BA, Friedman JP, Lubat E, Megibow AJ, Bosniak MA. 1990. Extrarenal genitourinary tuberculosis: CT appearance of calcified pipe-stem ureter and seminal vesicle abscess. J Comput Assist Tomogr 14: 653–655. [PubMed] [Google Scholar]
- Burrill J, Williams CJ, Bain G, Conder G, Hin AL, Misra RR. 2007. Tuberculosis: A radiological review. Radiographics 27: 1255–1273. [DOI] [PubMed] [Google Scholar]
- Celso L, da Cruz H Jr, Domingues RC. 2009. Intracranial infections. In Magnetic resonance imaging of the brain and spine, 4th ed (ed. Atlas SW), pp. 929–1026. Lippincott Williams & Wilkins, Philadelphia. [Google Scholar]
- Chen CJ, Yao WJ, Chou CY, Chiu NT, Lee BF, Wu PS. 2008. Peritoneal tuberculosis with elevated serum CA125 mimicking peritoneal carcinomatosis on F-18 FDG-PET/CT. Ann Nucl Med 22: 525–527. [DOI] [PubMed] [Google Scholar]
- Chowdhury V, Gulati P, Sachdev A, Mittal SK. 1991. Sonography in pyogenic and tubercular meningitis: A comparative study. Indian J Radiol Imag 1: 7–10. [Google Scholar]
- Dong A, Wang Y, Gong J, Zuo C. 2013. FDG PET/CT findings of common bile duct tuberculosis. Clin Nucl Med 39: 67–70. [DOI] [PubMed] [Google Scholar]
- Engin G, Acunas G, Tunaci M. 2000. Imaging of extrapulmonary tuberculosis. Radiographics 20: 471–488. [DOI] [PubMed] [Google Scholar]
- Francis IR, Korobkin M. 1997. The incidentally discovered adrenal masses. Magn Reson Imaging Clin N Am 5: 147–164. [PubMed] [Google Scholar]
- Garg MK, Kalra N. 2010. Radiological manifestations of pulmonary tuberculosis. In Diagnostic radiology, 3rd ed (ed. Chowdhury V, Gupta AK, Khandelwal N), pp. 60–68. Jaypee Brother Medical, New Delhi, India. [Google Scholar]
- Goodman PC. 1990. Pulmonary tuberculosis in patients with acquired immunodeficiency syndrome. J Thorac Imaging 5: 38–45. [DOI] [PubMed] [Google Scholar]
- Gulati GS, Kothari SS. 2011. Diffuse infiltrative cardiac tuberculosis. Ann Pediatr Cardiol 4: 87–89. [DOI] [PMC free article] [PubMed] [Google Scholar]
- Gulati M, Suri S, Kaur G, Jindal SK, Behera D. 1994. CT manifestations of tubercular mediastinal lymphadenopathy. Indian J Chest Dis Allied Sci 36: 3–7. [PubMed] [Google Scholar]
- Gupta RK. 2002. Magnetization transfer MR imaging in central nervous system infections. Indian J Radiol Imaging 12: 51–58. [Google Scholar]
- Gupta RK, Vatsal DK, Hussain N, Chawla S, Prasad KN, Roy R, Kumar R, Jha D, Hussain M. 2001. Differentiation of tuberculous from pyogenic brain abscesses with in vivo proton MR spectroscopy and magnetization transfer MR imaging. AJNR Am J Neuroradiol 22: 1503–1509. [PMC free article] [PubMed] [Google Scholar]
- Harisinghani MG, McLoud TC, Shepard JA, Ko JP, Shroff MM, Mueller PR. 2000. Tuberculosis from head to toe. Radiographics 20: 449–470. [DOI] [PubMed] [Google Scholar]
- Helm CJ, Holland GN. 1993. Ocular tuberculosis. Surv Ophthalmol 38: 229–256. [DOI] [PubMed] [Google Scholar]
- Ito K, Morooka M, Kubota K. 2010. 18F-FDG PET/CT findings of pharyngeal tuberculosis. Ann Nucl Med 24: 493–496. [DOI] [PubMed] [Google Scholar]
- Jagia P, Gulati GS, Sharma S. 2010. Imaging in cardiomyopathies. In Diagnostic radiology, 3rd ed (ed. Chowdhury V, Gupta AK, Khandelwal N), pp. 376–383. Jaypee Brother Medical, New Delhi, India. [Google Scholar]
- Jaovisidha S, Chen C, Ryu KN, Siriwongpairat P, Pekanan P, Sartonis DJ, Resnick D. 1996. Tuberculous tenosynovitis and bursitis: Imaging findings in 21 cases. Radiology 201: 507–513. [DOI] [PubMed] [Google Scholar]
- Jeffry L, Kerrou K, Camatte S, Lelievre L, Metzger U, Robin F, Lecuru F. 2003. Peritoneal tuberculosis revealed by carcinomatosis on CT scan and uptake at FDG-PET. BJOG 110: 1129–1131. [PubMed] [Google Scholar]
- Jena AN, Banerji AK, Tripathi RP, Gulati PK, Jain RK, Khushu S, Sapra ML. 1991. Demonstration of intramedullary tuberculomas by magnetic resonance imaging: A report of two cases. Br J Radiol 64: 555–557. [DOI] [PubMed] [Google Scholar]
- Jeong YJ, Lee KS. 2008. Pulmonary tuberculosis: Up-to-date imaging and management. AJR Am J Roentgenol 191: 834–844. [DOI] [PubMed] [Google Scholar]
- Jeong YJ, Sohn MH, Lim ST, Kim DW, Jeong HJ, Chung MJ, Yim CY. 2010. “Hot liver” on 18F-FDG PET/CT imaging in a patient with hepatosplenic tuberculosis. Eur J Nucl Med Mol Imaging 37: 1618–1619. [DOI] [PubMed] [Google Scholar]
- Jung YY, Kim JK, Cho K. 2005. Genitourinary tuberculosis: Comprehensive sectional imaging. AJR Am J Roentgenol 184: 143–150. [DOI] [PubMed] [Google Scholar]
- Kim SH. 2000. Genitourinary tuberculosis. In Clinical urography, 2nd ed (ed. Pollack HM, Dyer R, McClennan BL), pp. 1193–1228. Saunders, Philadelphia. [Google Scholar]
- Leder RA, Low VHS. 1995. Tuberculosis of the abdomen. Radiol Clin North Am 33: 691–705. [PubMed] [Google Scholar]
- Lee JW, Kim BS, Lee DS, Chung JK, Lee MC, Kim S, Kang WJ. 2009. 18F-FDG PET/CT in mediastinal lymph node staging of non-small-cell lung cancer in a tuberculosis-endemic country: Consideration of lymph node calcification and distribution pattern to improve specificity. Eur J Nucl Med Mol Imaging 36: 1794–1802. [DOI] [PubMed] [Google Scholar]
- Lee G, Lee JH, Park SG. 2011. F-18 FDG PET/CT imaging of solitary genital tuberculosis mimicking recurrent lymphoma. Clin Nucl Med 36: 315–316. [DOI] [PubMed] [Google Scholar]
- Lehrer H. 1966. The angiographic triad in tuberculous meningitis. A radiographic and clinicopathologic correlation. Radiology 87: 829–835. [DOI] [PubMed] [Google Scholar]
- Leung AN, Brauner MW, Gamsu G, Milika-Cabanne N, Ben Romdhane H, Carette MF, Grenier P. 1996. Pulmonary tuberculosis: Comparison of CT findings in HIV sero positive and HIV sero negative patients. Radiology 198: 687–691. [DOI] [PubMed] [Google Scholar]
- Li Y, Su M, Li F, Kuang A, Tian R. 2011. The value of (18)F-FDG-PET/CT in the differential diagnosis of solitary pulmonary nodules in areas with a high incidence of tuberculosis. Ann Nucl Med 25: 804–811. [DOI] [PubMed] [Google Scholar]
- Margado C, Ruivo N. 2005. Imaging meningo-encephalic tuberculosis. Eur J Radiol 55: 188–192. [DOI] [PubMed] [Google Scholar]
- Martinez V, Castilla-Lievre MA, Guillet-Caruba C, Grenier G, Fior R, Desarnaud S, Boue F. 2012. (18)F-FDG PET/CT in tuberculosis: An early non-invasive marker of therapeutic response. Int J Tuberc Lung Dis 16: 1180–1185. [DOI] [PubMed] [Google Scholar]
- Mayosi BM, Burgess LJ, Doubell AF. 2005. Heart disease in Africa. Circulation 112: 3608–3616. [DOI] [PubMed] [Google Scholar]
- Miller WT, Miller WT Jr. 1993. Tuberculosis in the normal host: Radiological findings. Semin Roentgenol 28: 109–118. [DOI] [PubMed] [Google Scholar]
- Moon WK, Han MH, Chang KH, Im JG, Kim HJ, Sung KJ, Lee HK. 1997. CT and MR imaging of head and neck tuberculosis. Radiographics 17: 391–402. [DOI] [PubMed] [Google Scholar]
- Murray RO, Jacobson HG. 1997. Skeletal tuberculosis in the radiology of skeletal diseases. In Exercises in diagnosis, 2nd ed, pp. 414–426. Churchill Livingstone, Edinburgh. [Google Scholar]
- Nair PP, Kalita J, Kumar S, Misra UK. 2009. MRI pattern of infarcts in basal ganglia region in patients with tuberculous meningitis. Neuroradiology 51: 221–225. [DOI] [PubMed] [Google Scholar]
- Nakano H, Jaramillo E, Watanabe M, Miyachi I, Takahama K, Itoh M. 1992. Intestinal tuberculosis: Findings on double contrast barium enema. Gastrointest Radiol 17: 108–114. [DOI] [PubMed] [Google Scholar]
- Patkar D, Narang J, Yanamandala R, Lawande M, Shah G. 2012. Central nervous system tuberculosis: Pathophysiology and imaging findings. Neuroimag Clin North Am 22: 677–705. [DOI] [PubMed] [Google Scholar]
- Prakash A. 2009. Abdominal tuberculosis. In Diagnostic radiology gastrointestinal and hepatobiliary imaging, 3rd ed (ed. Gupta A, Chowdhury V, Khandelwal N). Jaypee Brother Medical, New Delhi, India. [Google Scholar]
- Raviglione MC, O'Brien RJ. 2005. Tuberculosis. In Harrison’s principles of internal medicine, 17th ed (ed. Kasper DL, Barunwald E, Fauci A, et al. ) pp. 1006–1021. McGraw-Hill, New York. [Google Scholar]
- Razak HR, Geso M, Abdul Rahim N, Nordin AJ. 2011. Imaging characteristics of extrapulmonary tuberculosis lesions on dual time point imaging (DTPI) of FDG PET/CT. J Med Imaging Radiat Oncol 55: 556–562. [DOI] [PubMed] [Google Scholar]
- Rho MH, Kim DW, Kim SS, Sung YS, Kwon JS, Lee SW. 2007. Tuberculous otomastoiditis on high-resolution temporal bone CT: Comparison with nontuberculous otomastoiditis with and without cholesteatoma. AJNR Am J Neuroradiol 28: 493–496. [PMC free article] [PubMed] [Google Scholar]
- Roudaut N, Malecot JM, Dupont E, Boussion N, Visvikis D, Doucet L, Cheze-Le Rest C. 2008. Adrenal tuberculosis revealed by FDG PET. Clin Nucl Med 33: 821–823. [DOI] [PubMed] [Google Scholar]
- Sathekge M, Maes A, Kgomo M, Pottel H, Stolz A, Van De Wiele C. 2010. FDG uptake in lymph-nodes of HIV+ and tuberculosis patients: Implications for cancer staging. Q J Nucl Med Mol Imaging 54: 698–703. [PubMed] [Google Scholar]
- Sathekge M, Maes A, Kgomo M, Stoltz A, Van de Wiele C. 2011. Use of 18F-FDG PET to predict response to first-line tuberculostatics in HIV-associated tuberculosis. J Nucl Med 52: 880–885. [DOI] [PubMed] [Google Scholar]
- Sawlani V, Chandra T, Mishra RN, Aggarwal A, Jain UK, Gujral RB. 2003. MRI features of tuberculosis of peripheral joints. Clin Radiol 58: 755–762. [DOI] [PubMed] [Google Scholar]
- Shimamoto H, Hamada K, Higuchi I, Tsujihata M, Nonomura N, Tomita Y, Hatazawa J. 2007. Abdominal tuberculosis: Peritoneal involvement shown by F-18 FDG PET. Clin Nucl Med 32: 716–718. [DOI] [PubMed] [Google Scholar]
- Shukla R, Abbas A, Kumar P, Gupta RK, Jha S, Prasad KN. 2008. Evaluation of cerebral infarction in tuberculous meningitis by diffusion weighted imaging. J Infect 57: 298–306. [DOI] [PubMed] [Google Scholar]
- Sinan T, Sheikh M, Ramadan S, Sahwney S, Behbehani A. 2002. CT features in abdominal tuberculosis: 20 years experience. BMC Med Imaging 2: 1–7. [DOI] [PMC free article] [PubMed] [Google Scholar]
- Soussan M, Brillet PY, Mekinian A, Khafagy A, Nicolas P, Vessieres A, Brauner M. 2012. Patterns of pulmonary tuberculosis on FDG-PET/CT. Eur J Radiol 81: 2872–2876. [DOI] [PubMed] [Google Scholar]
- Suri S, Gupta S, Suri R. 1999. Computed tomography in abdominal tuberculosis. Br J Radiol 72: 92–98. [DOI] [PubMed] [Google Scholar]
- Takalkar AM, Bruno GL, Reddy M, Lilien DL. 2007. Intense FDG activity in peritoneal tuberculosis mimics peritoneal carcinomatosis. Clin Nucl Med 32: 244–246. [DOI] [PubMed] [Google Scholar]
- Tan CH, Kontoyiannis DP, Viswanathan C, Iyer RB. 2010. Tuberculosis: A benign impostor. Am J Roentengenol 194: 555–561. [DOI] [PubMed] [Google Scholar]
- Theoni RF, Margullis AR. 1979. Gastrointestinal tuberculosis. Semin Roentgenol 14: 283–294. [DOI] [PubMed] [Google Scholar]
- Tian G, Xiao Y, Chen B, Guan H, Deng QY. 2010a. Multi-site abdominal tuberculosis mimics malignancy on 18F-FDG PET/CT: Report of three cases. World J Gastroenterol 16: 4237–4242. [DOI] [PMC free article] [PubMed] [Google Scholar]
- Tian G, Xiao Y, Chen B, Xia J, Guan H, Deng Q. 2010b. FDG PET/CT for therapeutic response monitoring in multi-site non-respiratory tuberculosis. Acta Radiol 51: 1002–1006. [DOI] [PubMed] [Google Scholar]
- Trivedi R, Saksena S, Gupta RK. 2009. Magnetic resonance imaging in central nervous system tuberculosis. Indian J Radiol Imaging 19: 256–265. [DOI] [PMC free article] [PubMed] [Google Scholar]
- Wang HY, Lin WY. 2006. Jejunal tuberculosis: Incidental finding on an FDG-PET scan. Kaohsiung J Med Sci 22: 34–38. [DOI] [PMC free article] [PubMed] [Google Scholar]
- Wang LJ, Wu CF, Wong YC, Chuang CK, Chu SH, Chen CJ. 2003. Imaging findings of urinary tuberculosis on excretory urography and computerized tomography. J Urol 169: 524–528. [DOI] [PubMed] [Google Scholar]
- Wang JH, Chi CY, Lin KH, Ho MW, Kao CH. 2013. Tuberculous arthritis—Unexpected extrapulmonary tuberculosis detected by FDG PET/CT. Clin Nucl Med 38: e93–e94. [DOI] [PubMed] [Google Scholar]
- Weaver P, Lifeso R. 1984. The radiological diagnosis of tuberculosis of the adult spine. Skeletal Radiol 12: 178–186. [DOI] [PubMed] [Google Scholar]
- Woodring JH, Vandiviere HM, Fried AM, Dillon ML, Williams TD, Melvin IG. 1986. Update: The radiographic features of pulmonary tuberculosis. AJR Am J Roentgenol 146: 497–506. [DOI] [PubMed] [Google Scholar]
- Yadav YR, Mukerji G, Parihar V, Sinha M, Pandey S. 2009. Complex hydrocephalus (combination of communicating and obstructive type): An important cause of failed endoscopic third ventriculostomy. BMC Res Notes 2: 137. [DOI] [PMC free article] [PubMed] [Google Scholar]
- Yadla M, Sivakumar V, Kalawat T. 2012. Assessment of early response to treatment in extrapulmonary tuberculosis: Role of FDG-PET. Indian J Nucl Med 27: 136–137. [DOI] [PMC free article] [PubMed] [Google Scholar]
- Yeh CL, Chen LK, Chen SW, Chen YK. 2009. Abnormal FDG PET imaging in tuberculosis appearing like mesothelioma: Anatomic delineation by CT can aid in differential diagnosis. Clin Nucl Med 34: 815–817. [DOI] [PubMed] [Google Scholar]
- Yen RF, Chen KC, Lee JM, Chang YC, Wang J, Cheng MF, Lee YC. 2008. 18F-FDG PET for the lymph node staging of non-small cell lung cancer in a tuberculosis-endemic country: Is dual time point imaging worth the effort? Eur J Nucl Med Mol Imaging 35: 1305–1315. [DOI] [PubMed] [Google Scholar]
- Zheng Z, Pan Y, Guo F, Wei H, Wu S, Pan T, Li J. 2011. Multimodality FDG PET/CT appearance of pulmonary tuberculoma mimicking lung cancer and pathologic correlation in a tuberculosis-endemic country. South Med J 104: 440–445. [DOI] [PubMed] [Google Scholar]


