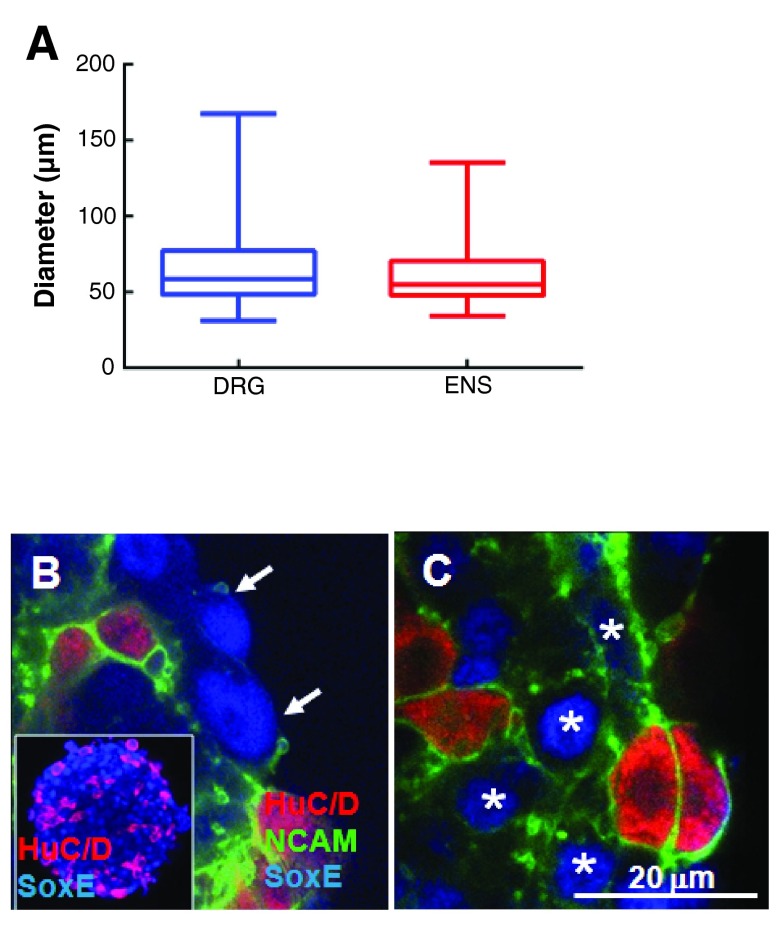
Figure 9. QE8 DRG cell aggregates in vitro have different internal structure than ENS cell aggregates.
A. QE8 DRG and ENS HNK-1 +ve cell aggregates were similar in average size and size distribution. Box plots show the first quartile to inter quartile range and whiskers show minimum and maximum range of data, while the median is represented by a vertical line. There was no difference between DRG and ENS in aggregate size when analysed using Mann-Whitney test for nonparametric data. Starting cell density was 0.5 ×10 6 cells/ml. B. Unlike QE8 ENS cell aggregates, Hu +ve neurons and SoxE +ve cells are not segregated in DRG aggregates (inset), but like ENS aggregates, peripheral SoxE +ve cells show little outer NCAM labelling (arrows). C. In contrast, internal SoxE +ve cells (stars) as well as surface and internal Hu +ve cells show strong NCAM labelling in DRG cell aggregates.

