

Abstract
Handling of data below the lower limit of quantification (LLOQ), below the limit of quantification (BLOQ) in population pharmacokinetic (PopPK) analyses is important for reducing bias and imprecision in parameter estimation. We aimed to evaluate whether using the concentration data below the LLOQ has superior performance over several established methods. The performance of this approach (“All data”) was evaluated and compared to other methods: “Discard,” “LLOQ/2,” and “LIKE” (likelihood-based). An analytical and residual error model was constructed on the basis of in-house analytical method validations and analyses from literature, with additional included variability to account for model misspecification. Simulation analyses were performed for various levels of BLOQ, several structural PopPK models, and additional influences. Performance was evaluated by relative root mean squared error (RMSE), and run success for the various BLOQ approaches. Performance was also evaluated for a real PopPK data set. For all PopPK models and levels of censoring, RMSE values were lowest using “All data.” Performance of the “LIKE” method was better than the “LLOQ/2” or “Discard” method. Differences between all methods were small at the lowest level of BLOQ censoring. “LIKE” method resulted in low successful minimization (<50%) and covariance step success (<30%), although estimates were obtained in most runs (∼90%). For the real PK data set (7.4% BLOQ), similar parameter estimates were obtained using all methods. Incorporation of BLOQ concentrations showed superior performance in terms of bias and precision over established BLOQ methods, and shown to be feasible in a real PopPK analysis.
Keywords: Bioanalysis, BLOQ, limit of quantification, pharmacometrics, population pharmacokinetics
Introduction
In population pharmacokinetic (PopPK) analyses of concentration–time data, the modeler is often confronted with concentrations that are reported as below the lower limit of quantification (LLOQ). Drug concentrations in PK samples obtained in (pre-)clinical trials are generally quantified using chromatographic methods, combined with either absorbance-, fluorescence-, or mass spectrometric detectors. During validation of the method, a calibration curve is constructed relating raw bioanalytical data, usually peak areas or peak area ratios, to concentrations. Also, a LLOQ is defined for the method, and sometimes a limit of detection (LOD). During routine analysis, concentrations that are calculated to be under the LLOQ are generally not reported, but left censored as “below the limit of quantification” (BLOQ). Often, laboratories also specify “nondetectable” (ND) instead of BLOQ when no analyte could be detected at all.
The U.S. Food and Drug Administration (FDA) has issued guidelines on bioanalytical method validation, which are adhered to by most laboratories. These guidelines specify that the analytical method should ensure an interassay precision of ≤20% at the LLOQ, and ≤15% at all other levels, and that four of every six samples taken in quality control (QC) should be within ±15% of the nominal value (FDA 2001). In practice, however, the LLOQ is often chosen “on the safe side,” that is, somewhat higher than absolutely necessary such that the interassay variation at the LLOQ is well below the 20% limit. This is done to reduce chances of invalidation of a method during the application of the method to routine drug analysis, due to variation in the (mass spectrometry [MS]) detector response over time. The variation may result in rejecting analytical batches or raising the LLOQ for particular batches. It is, therefore, likely that BLOQ data, although potentially measured with less precision than concentration data greater than LLOQ, are still a valuable information source and, when used in the analysis of PK, may aid in defining the proper structural model and increase the precision of parameter estimates.
Several methods have been proposed to deal with these left-censored values. The most commonly applied methods include: discarding the BLOQ value, replacing the BLOQ value with 0, replacing the value by LLOQ/2, or by maximizing the likelihood of these concentrations reported as being BLOQ (Wakefield and Racine-Poon 1995; Beal 2001). It has been shown that the use of the latter method, performs best in terms of bias and precision of the methods mentioned above (Beal 2001; Ahn et al. 2008; Byon et al. 2008). In effect, this incorporates BLOQ data as binary information. We hypothesize that the information contained in concentration data BLOQ offers an even more valid approach to handling such data. A schematic representation of this is offered in Figure1. In this report, a study is presented exploring the potential benefits of the use of data over the approaches introduced above. Performance is first evaluated using simulation studies. Second, a real PK data set from a phase I trial was used to evaluate the feasibility of using BLOQ data in a PopPK analysis, and the resulting parameter estimates between the various BLOQ methods were compared.
Figure 1.
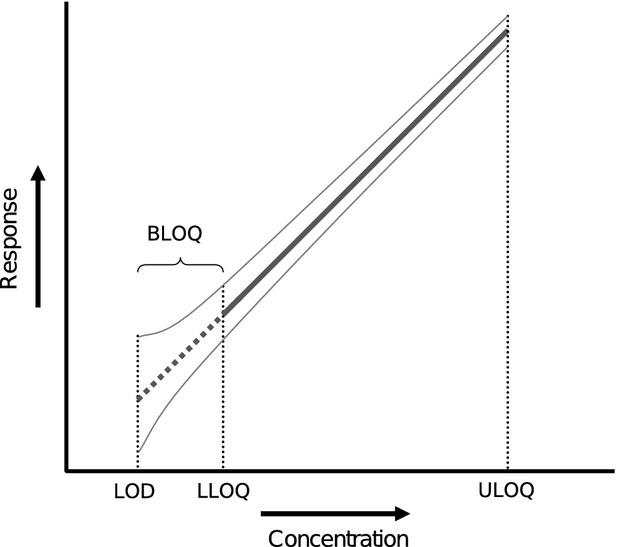
Schematic representation of calibration curve showing quantification and detection limits. The thin gray lines indicate a hypothetical uncertainty interval around the calibration line. In the “All data” method, data between the limit of detection (LOD) and lower limit of quantification (LLOQ) is used in the same manner as data above the LLOQ.
Materials and Methods
Methods for handling BLOQ data that were evaluated in this analysis were the following:
“Discard”: all BLOQ data were discarded.
“LLOQ/2”: all BLOQ data in the absorption phase were substituted with LLOQ/2, while in the elimination phase only the first data point under the LLOQ was substituted with LLOQ/2 and subsequent points were discarded.
“LIKE”: LIKE is a method that enables simultaneously modeling of the continuous data above the LLOQ and binary data below the LLOQ (Wakefield and Racine-Poon 1995). In this, the likelihood of the BLOQ data being below the LLOQ is maximized with respect to the model parameters. Of the likelihood-based methods as summarized by Beal et al., we chose to focus solely on the “M3” as this method has been shown to be the most accurate and precise (Ahn 1998; Beal 2001).
“All data” method: all detectable concentrations were included as continuous data, including points below the LLOQ. Concentrations below the LOD were discarded.
The first part of the analysis concerned simulation studies. First, a bioanalytical and residual error model was constructed based on literature data. Next, the four BLOQ methods were compared using PK data simulated from various PopPK models, with varying levels of BLOQ censoring. Afterward, several additional factors that might influence the performance of the BLOQ methods were investigated such as the estimation method and the use of the approach in unbalanced study designs. In the second part of the analysis, we evaluated the feasibility of the “All data” approach, and how the methods compared in a realistic setting.
Simulation studies
Analytical and residual error model
Broadly, two separate sources of residual error can be distinguished in PopPK modeling analyses: one stemming from model misspecification, the other from inaccuracy in bioanalysis. To obtain a credible model for the part of the residual error describing the bioanalytical uncertainty, we reviewed published data on interday precision from validation studies performed in our own laboratory (Vainchtein et al. 2006a,b, 2007a,b; ter Heine et al. 2007, 2009; Damen et al. 2008, 2009a,b; Jansen et al. 2009, 2010). To avoid interlaboratory bias in establishing an appropriate bioanalytical error model, the data set was combined with a similar-sized data set obtained from bioanalysis validation reports published in 2009 in J Chromatogr B Analyt Technol Biomed Life Sci that contained information on the interday precision at the LLOQ and a low–mid–high concentration range (Borges et al. 2009; Carli et al. 2009; Clavijo et al. 2009; Gu et al. 2009; Ling et al. 2009; Nirogi et al. 2009a,b; Qiao et al. 2009; Zhang et al. 2009; Ptolemy et al. 2010; Stanton et al. 2010). To these validation data, a mean error model of the form y = ax + b was fitted, in which x is the ratio of the nominal concentration relative to the LLOQ, y is the absolute error, calculated as the reported relative interday uncertainty at nominal concentration x multiplied by x, a defines the part of the error proportional to the concentration, and b is the additive part of the error. The fitted analytical error model represents the error model for an analytical method with average performance in terms of interassay precision. To investigate the influence of analytical methods with worse-than-average precision, we also defined an analytical error model for a “worst-case” analytical method, of which the interassay precision was 20% at the LLOQ, and 40% at the LOD. For the other part of the residual error model, that is, the error due to model misspecification, an additional 20% variation was added, proportional to the concentration. The complete residual error model thus was of the form:  , in which y is the observed concentration,
  is the predicted concentration, and εn are the stochastic variance components of the residual error model sampled from N (0,1). Usually, bioanalytical laboratories also define a LOD for the analytical method. In this analysis, the LOD was defined to be 30% of the LLOQ, as often the LOD is defined as three times the signal noise, and the LLOQ as 10 times signal noise. Data below the LOD should be considered unquantifiable and, therefore, were discarded when using the “All data” method.
PK models and simulations
The PK models and parameters used to generate the data sets are shown in Table1. In all PK models, between-subject variation (BSV) in parameters was defined at 25% in the PK parameters CL and V only. Covariance between parameters was not considered. A dose of 100 mg was administered, orally in one dose, or i.v. (intravenous) as a 2-h infusion. Data sets were simulated, initially without residual error, for cohorts of 25 patients. One curve per patient was simulated, using a dense scheme at nominal times of 15 and 30 min, and 1, 2, 4, 6, 8, 12, 16, and 24 h. After simulation, the LLOQ was defined for each data set at three different levels (“moderate,” “high,” and “very high”) such that respectively 10%, 20%, or 40% of the simulated data (without residual variability) were below the LLOQ. Next, using the analytical error model obtained from literature, residual variability was added to the data set, as well as model misspecification error. Concentrations were then determined to be above or below the LLOQ.
Table 1.
Pharmacokinetic (PK) model parameters used for the simulation of data sets
| Structural model: | CL (L/h) | V (L) | Q2 (L/h) | V2 (L) | ka (/h) |
|---|---|---|---|---|---|
| IV1 – 1 comp. i.v. | 5 | 50 | – | – | – |
| IV2 – 2 comp. i.v. | 5 | 50 | 10 | 100 | – |
| O1 – 1 comp. oral | 5 | 50 | – | – | 0.5 |
i.v., intravenous; 1 comp., one-compartment linear model; 2 comp., two-compartment linear model.
To account for BSV and variation in residual errors, 100 simulated data sets were created for each PK model, level of BLOQ censoring, and residual error scenario. After simulation, the generated data sets were fitted to the “correct” structural model, that is, the same model that was used in the simulation, which was repeated for 100 times for each specific method for handling BLOQ data, and repeated for all scenarios. A combined proportional and additive error model was used. BSV was estimated only on CL and V.
Comparison of methods
Bias of the parameter estimates was defined as the difference between the parameter estimate and the nominal value (the value that was used to simulate the data), relative to the nominal value. Relative root mean squared error (RMSE) was calculated for each scenario using the equation:
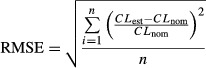 |
1 |
with CLest being the estimated parameter for clearance, CLnom the nominal clearance value used to simulate the data, and the number of simulation and reestimations performed for each scenario (n = 100).
Also, the significance of systematic bias, that is, the significance of the mean bias being different from zero (P < 0.01) was determined. Box plots were created to reveal the distribution of bias in each scenario. To judge model estimation stability, the number of runs that produced parameter estimates, the number of successful minimizations, and the number of runs that produced a successful covariance step were recorded (Table2).
Table 2.
Observed percentages of successful minimizations and successful covariance steps
| PK model | LOQ censoring | Parameter estimation (%) | Minimization successful1 (%) | Covariance step successful (%) | |||||||||
|---|---|---|---|---|---|---|---|---|---|---|---|---|---|
| Discard | LOQ/2 | LIKE | All data | Discard | LOQ/2 | LIKE | All data | Discard | LOQ/2 | LIKE | All data | ||
| i.v., 1 comp. | Moderate | 100 | 100 | 90 | 100 | 100 | 98 | 53 | 100 | 100 | 98 | 34 | 100 |
| High | 100 | 100 | 92 | 100 | 100 | 99 | 43 | 100 | 100 | 99 | 15 | 100 | |
| Very high | 100 | 100 | 91 | 100 | 96 | 100 | 25 | 100 | 94 | 100 | 7 | 100 | |
| i.v., 2 comp. | Moderate | 100 | 100 | 94 | 100 | 68 | 87 | 13 | 86 | 28 | 40 | 4 | 38 |
| High | 100 | 100 | 93 | 100 | 65 | 84 | 18 | 88 | 24 | 50 | 2 | 48 | |
| Very high | 100 | 100 | 100 | 100 | 64 | 79 | 26 | 82 | 11 | 50 | 5 | 53 | |
| Oral, 1 comp. | Moderate | 100 | 100 | 91 | 100 | 93 | 96 | 46 | 93 | 91 | 94 | 20 | 91 |
| High | 100 | 100 | 80 | 100 | 96 | 97 | 34 | 98 | 95 | 93 | 14 | 97 | |
| Very high | 100 | 100 | 79 | 100 | 99 | 98 | 21 | 100 | 98 | 98 | 1 | 98 | |
| Oral, 1 comp., NONMEM VII | Moderate | 100 | 100 | 100 | 100 | 100 | 100 | 62 | 100 | 100 | 100 | 32 | 100 |
| High | 100 | 100 | 100 | 100 | 100 | 96 | 54 | 100 | 100 | 95 | 16 | 100 | |
| Very high | 100 | 100 | 100 | 100 | 99 | 97 | 54 | 98 | 98 | 93 | 18 | 98 | |
PK, pharmacokinetic; LOQ, limit of quantification; LIKE, likelihood-based; i.v., intravenous; 1 comp., one-compartment linear model; 2 comp., two-compartment linear model; NONMEM, nonlinear mixed-effects modeling.
As reported by NONMEM.
Other influences
To study several additional possible influences on performance, additional simulation and reestimation analyses were performed, however, only for the linear one-compartment oral PK model. First, we evaluated if the performance of the BLOQ methods was similar for the worst-case analytical error model compared to the realistic error model. We also evaluated the performance of the stochastic approximation expectation maximization (SAEM) algorithm (as implemented in NONMEM [nonlinear mixed-effects modeling]) for the various BLOQ methods. Furthermore, dose escalation trials often show an unbalanced amount of left censoring due to data BLOQ. We investigated the influence of analyzing such an “unbalanced” data set with the BLOQ methods: instead of 25 patients at the same dose as was done previously, a dose escalation trial was mimicked, in which doses of 5–10–20–30–50, and 100 mg were administered to three patients at each level, and 10 at the 50 mg level. Finally, an additional likelihood-based method was evaluated, in which the “All data” method was used for all the concentration data above the LOD, with the additional implementation of the LIKE method for data below the LOD. This method was termed “LIKE-LOD.”
Real PopPK data set
A PK data set was available for the anticancer agent indisulam, obtained from a dose escalation trial evaluating combination chemotherapy with irinotecan (Ryan et al. 2005). Patients received a 2-h infusion of indisulam, and per patient one PK curve was available, obtained over 120 h. Plasma samples were analyzed using a validated LC-MS/MS (liquid chromatography–mass spectrometry) method with a concentration range of 0.1–20 μg/mL (Beumer et al. 2004). The assay fulfilled all generally accepted requirements for linearity (r > 0.99, residuals between −8% and 10%), accuracy (−13.5% to 1.4%) and precision (<11% for all tested concentration levels). Although an extensive semiphysiological PK model has already been established for this drug (Zandvliet et al. 2006), we only performed basic compartmental PK modeling on this limited data set, and, for example, the influence of covariates was not investigated. First, using the “All data” method, the most adequate structural model was defined, and using this PK model, the performance of the other BLOQ methods was evaluated. A bootstrap analysis was performed for the final model and data set for each BLOQ method, to investigate difference between parameter estimates and imprecision. The Medical Ethics Committee in all study centers approved the study protocols and all patients gave written informed consent.
Software
Model creation and output processing was performed using Perl (version 5.8.8, ActiveState, Vancouver, BC, Canada). Simulation, data handling, and plotting were performed in R (http://cran.r-project.org/, version 2.10.0). Model estimation was performed with nonlinear mixed-effects modeling implemented in NONMEM VI level 2.0 or NONMEM VII (both ICON Development Solutions, Ellicott City, MD; Beal and Sheiner 1989). The Laplacian method was used for modeling continuous data (“All data”/“LLOQ/2” approaches) and combined censored and continuous data (“LIKE” approach). The SAEM method was used only to evaluate the difference between this estimation method and linearization-based estimation. When the SAEM was used, the first-order estimation (FO) method was implemented prior to the SAEM to obtain initial estimates for the SAEM. For the “LIKE” method, instead of FO, the Laplacian estimation method was implemented prior to SAEM.
Results
Simulation studies
Analytical and residual error model
Figure2 shows the interday precision from validations performed in our own laboratory or published in literature, for a total of 62 analytical methods for drugs or drug metabolites. This shows that interday uncertainty for all published methods was <15% at concentrations above the LLOQ, and at the LLOQ the uncertainty was slightly higher for most methods, but always <20%. No apparent differences were observed between precision of methods validated in our laboratory compared to other published methods. Fitting of a model of the form y = ax + b (solid line), showed that at the LLOQ, the median interday variation was 9.3%. For the simulations, the values found for a and b corresponded to a proportional error magnitude of 7.4%, and an additive error magnitude of 5.6% of the LLOQ. In Figure2, the gray dashed line indicates the “worst-case scenario,” of a bioanalytical method that just complies with FDA standards, having interday precision of just below 15% at low, mid, and high QC concentrations, and 20% at the LLOQ. Using this model, for which parameters were set at a = 12, and b = 8, the measurement error at the LLOQ is 20%, and 38.7% at the LOD.
Figure 2.
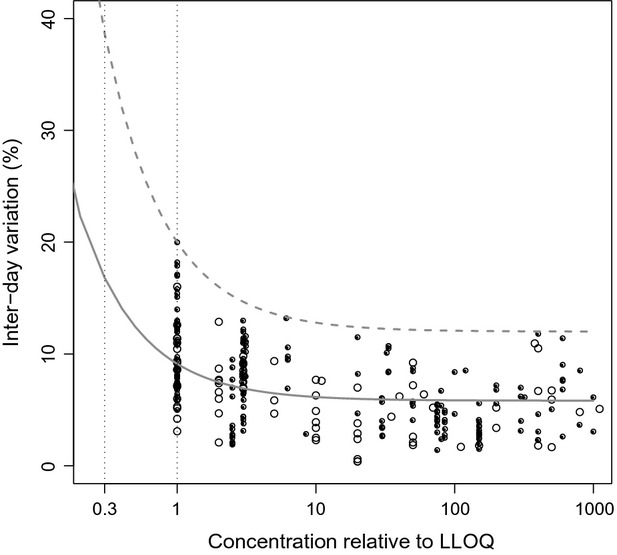
Interday variation (CV%) plotted versus concentration relative to lower limit of quantification (LLOQ). Black dots represent data from validations performed in our own laboratories, open circles represent data from published validation reports. The gray line shows the analytical residual error model fitted on these data (y = ax + b), in which y is the standard deviation of the absolute error at nominal concentration x (relative to the LLOQ), which was used as realistic scenario. The dotted gray line indicates the error model for the worst-case scenario.
Comparison of methods
Boxplots of parameter bias obtained in the simulation and reestimation procedures for the several models are shown in Figures5. As in a high percentage of runs the data sets did not support the estimation of the magnitude of additive error term in the residual error model, this parameter was fixed to a small size (≪ LLOQ). Moreover, also estimation of BSV in parameters other than CL and V was not supported by the data, and therefore only BSV in CL and V was estimated.
Figure 5.

Performance of lower limit of quantification (LLOQ) methods for oral one-compartment linear model. Performed with NONMEM VI (nonlinear mixed-effects modeling), Laplacian method with interaction.
For the linear one-compartment i.v. model (Fig.3), it was observed that for the population parameters CL and V, no systematic bias was observed using any of the BLOQ methods for the situations where the percentage of BLOQ censoring was “moderate” (10%) or “high” (20%). Only for the situation where BLOQ censoring was “very high” (40%), considerable bias and imprecision was observed for CL for the “Discard” and “LLOQ/2” methods. Using the “LIKE” method, higher RMSE values were obtained than in the “LLOQ/2” or “All data” methods, and also more outliers were observed, both for fixed and random parameters. In general, the lowest values for RMSE for all parameters especially at the 40% level were obtained using the “All data” method. For the random effects, RMSE were higher than fixed parameters, but comparable for all methods at the 10% and 20% level of BLOQ, except for the “LIKE” method which showed higher variation in estimates.
Figure 3.

Performance of lower limit of quantification (LLOQ) methods for i.v. (intravenous) one-compartment linear model, performed with NONMEM VI (nonlinear mixed-effects modeling), Laplacian method with interaction. The root mean squared error (RMSE, shown in the bottom of each plot), should be as low as possible: low values for RMSE indicate lower probabilities of obtaining biased parameter estimates when performing a single population pharmacokinetic (PopPK) analysis. Mean bias should be as minimally different from 0 as possible, as it is desirable for methods to show as little systematic bias as possible in parameter estimation. Significance of systematic bias (P < 0.05) is shown by coloring: gray indicates bias, white indicates no bias.
Results obtained for the linear two-compartment i.v. model (Fig.4), showed that bias in fixed parameters was very apparent for the “Discard” and “LLOQ/2” method, even at “moderate” censoring levels, except for the estimation of V and BSV in V. As for the one-compartmental PK model, the “All data” method again performed best in all situations for both fixed and random parameters. Although significant systematic bias was observed for the “All data” method for some parameters, RMSE values were much smaller than the other methods.
Figure 4.

Performance of lower limit of quantification (LLOQ) methods for i.v. (intravenous) two-compartment linear model. Performed with NONMEM VI (nonlinear mixed-effects modeling), Laplacian method with interaction.
For the linear one-compartment oral model (Fig.5), at “moderate” and “high” levels of LLOQ censoring, all methods except “Discard” provided reasonable and broadly similar performance for both fixed and random parameters. Again, the “All data” method showed lowest RMSE values. At the highest level of censoring, only the “All data” method could estimate parameters with lower than 10% RMSE. BSV in CL was overestimated at all censoring levels using the LIKE method but not using the “All data” method.
For all PK models that were evaluated, the “LIKE” method produced the lowest number of successful runs and successful performance of a covariance step, as shown in Table3. These were most apparent for the two-compartment i.v. model, for which ≤5% of runs a covariance step could be retrieved, compared to 40–50% for the “LLOQ/2” or the “All data” method. Although a high percentage of model estimations were reported by NONMEM to be unsuccessful, NONMEM did provide final parameter estimates for many of these runs. It was found that in general, bias and precision were similar for runs that were labeled successful compared to unsuccessful ones (data not shown).
Table 3.
Parameter estimates and performance statistics for E7070 real data set
| Discard | LLOQ/2 | LIKE | All data | |
|---|---|---|---|---|
| CL (L/h) | 0.823 | 0.819 | 0.822 | 0.828 |
| V (L) | 5.61 | 5.65 | 5.61 | 5.63 |
| Q (L/h) | 1.90 | 1.89 | 1.9 | 1.88 |
| Vper (L) | 12.4 | 12.5 | 12.4 | 12.6 |
| ηCL | 62.3% | 61.5% | 61.8% | 60.6% |
| σadd (mg/L) | 0.071 | 0.0344 | 0.055 | 0.0364 |
| σprop | 25.8% | 26.6% | 26.1% | 26.7% |
| Successful minimization | 74.1% | 69.7% | 66.7% | 91.5% |
| Successful covariance step | 14.4% | 7.5% | 11.4% | 85.7% |
LLOQ, lower limit of quantification; LIKE, likelihood-based.
Other influences
It was observed that the worst-case scenario (Fig.6), for the “low” and “high” scenarios provided similar RMSE values as to when the realistic analytical error model was used for all methods. However, for the “very high” scenario, the “All data” method performed worse than “LLOQ/2” and “LIKE” in the estimation of V and ka: RMSE values were obtained that were almost double that of the “LIKE” method, and similar to the “Discard” method. The use of SAEM provided very similar results for bias and precision as when the Laplacian estimation method was used. The analysis of the unbalanced data sets did not reveal relevant differences compared to the results of the data sets with equal doses for all patients. The modified “LIKE” method, in which all data above the LOD were used as continuous data, and the likelihood was calculated for points below the LOD (“LIKE_LOD”), did not result in markedly less bias than using the “All data” method or the “LIKE” method. It did, however, lead to increased RMSE values, of similar size to the “LIKE” method. The percentages of points below the LOD in this analysis were 4.4% (CV 15%), 8.4% (CV 12%), and 14.5 (CV 9%), for the “low,” “high,” and “very high” scenarios, respectively.
Figure 6.

Performance of lower limit of quantification (LLOQ) methods for oral one-compartment linear model for the worst-case scenario. Performed with NONMEM VI (nonlinear mixed-effects modeling), Laplacian method with interaction.
Real data sets
PK data were available from 34 patients receiving doses of 250–525 mg/m2. Disregarding samples taken before the first dose, 17 (7.4%) of 231 PK samples were BLOQ. The (extrapolated) concentrations for the BLOQ data could be extracted from raw data files exported by the software of the mass spectrometer (Analyst 1.2, Applied Biosystems, Foster City, CA). It was found that a two-compartment linear model showed a better fit than a linear one-compartment model. Although indisulam is known to exhibit more complex PK, the inclusion of nonlinearity or additional peripheral compartments was not supported by the current data set. Visual predictive checks (not shown) of the current model and data, did, however, not reveal relevant model misspecification.
For all four BLOQ methods that were evaluated, the parameter estimates for this model were very similar, as is shown in Table3. Furthermore, the bootstrap distributions of the fixed and random parameters (Fig.7) showed no sign of differences in mean parameter estimates or precision between the evaluated BLOQ methods. Estimation stability was, however, different between methods in the bootstrap runs. Successful minimization was highest in the “All data” methods, followed by “Discard” and “LLOQ/2.” Similar to what was found in the simulations, the “LIKE” method showed poorest performance in terms of run success. Successful implementation of the covariance step occurred only in adequate percentages in the “All data” method and in very low percentages in the other methods, which could not be improved by, for example, tweaking of initial estimates.
Figure 7.
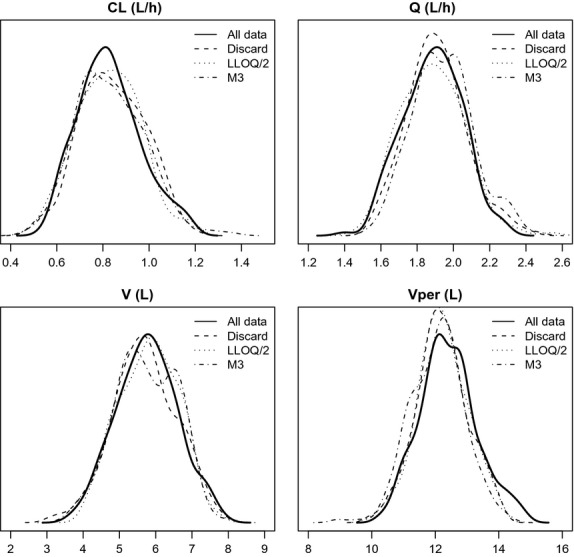
Bootstrap distributions for parameter estimates obtained with different methods.
Discussion
In this article, we investigated the hypothesis that the incorporation of concentration data below the LLOQ is both advantageous, in terms of bias and precision, and feasible. We demonstrated that the proposed “All data” approach provided two distinct advantages over the likelihood-based approach (“LIKE”). The “LIKE” method is often advocated as the most suitable way to handle BLOQ data (Ahn et al. 2008; Bergstrand and Karlsson 2009). In almost all situations evaluated here, the “All data” method gave the lowest RMSE values. The RMSE value is in our opinion the most useful parameter in this analysis, as it is directly related to the probability of obtaining biased parameter estimates when performing a PopPK analysis. We should note, however, that, since the error model contained only random noise, and the correct structural models were used to analyze the data, systematic bias is not expected in the current analysis and it the RMSE most likely is a reflection of random error only.
The “All data” method also has the advantage of more stable model estimation, as it showed much higher percentages of successful runs compared to the “LIKE” method. The joint likelihood function for censored and continuous data employed in the “LIKE” method seemed to induce less a stable estimation than a likelihood function solely defined for continuous data. We have chosen in this analysis to use the Laplacian method also for the analysis of continuous data, since it would allow a direct comparison between the “LIKE” and “All data” approaches. The first-order conditional estimation method with interaction (FOCEI) is a more commonly employed approach in NONMEM analyses for continuous data. We felt, however, the choice for using the Laplacian method in this analysis to be justifiable since initial results for the “All data” approach showed no meaningful differences between analysis with FOCEI and/or Laplacian at any level of censoring (data not shown). Besides being known to be less stable, the Laplacian estimation method is also a slower estimation method than FOCEI. Such nuisances associated with the Laplacian/“LIKE” approach make the model development process and identification of covariates more cumbersome (because results from unsuccessful runs need closer inspection), slower, and potentially less powerful. Limited testing revealed that the “LIKE” method also was much more sensitive to initial estimates and the requested precision of the estimation. Only when the “All data” method was pushed to the limit, that is, the error of the analytical method was just within the FDA specified precision limits, and a high percentage of data (40%) was below the LLOQ, did the “All data” method performed worse than the “LIKE” method. This is not so surprising, given the fact that in this worst-case scenario the interassay variation for the concentration range from the LLOQ to the LOD was between 20% and 40%. When also a high percentage of data is in this range, inclusions of these noisy data will likely lead to increased imprecision (and possibly bias) compared to the “LIKE” method. However, based on our limited literature review, such a “worst-case scenario” is not likely to occur. If such a situation would occur, validation results of the bioanalytical method will likely be available, and alert the analysts and modeler that such a situation is present.
Although we advocate the use of concentration data BLOQ based on the results from the analysis presented here, we do agree with other reports that if these data are truly not available, the “LIKE” likelihood method offers the best alternative to handle BLOQ data points. However, if this method is used, it must be ensured that model estimation is stable, and that consistent parameter estimates are obtained for the model. The simulations also showed that when the percentage of data below the LLOQ is low (≤10%), using the simple “LLOQ/2” method gave adequate results for the PK models that were tested, similar to the “LIKE” method or the “All data” method. It was only at higher levels of censoring that differences between the methods became apparent. It seems therefore reasonable to suggest that when the percentage of censored data is low, using an “LLOQ/2” approach instead of advanced approaches is unlikely to result in biased estimates.
The percentage of BLOQ data per se is, however, not the most meaningful parameter to compare approaches for handling of BLOQ data. For example, even if >40% of concentrations are censored, if enough data points per individual remain to support adequate fitting of the model, removing data might not damage the precision of the estimates relevantly. Conversely, even 5–10% BLOQ censoring could impede the identification of a peripheral compartment or other model features. It is therefore essential to view the problem of BLOQ data in terms of what fraction of the data is censored in relation to the model being fitted and the parameters being estimated. We have therefore labeled the scenarios “low,” “high,” and “very high” to apply a more general classification than referring to the specific percentages BLOQ.
It must also be noted that in the current analysis, it was assumed that the error below the LLOQ was randomly distributed. This might, however, not always be the case for real bioanalytical assays, and the results obtained in this analysis do not necessarily hold in such situations. It was beyond the scope of this article to investigate bias in BLOQ data in addition to the current comparisons, but if for a particular analysis there is evidence (or suspicion) of bias in the data BLOQ, a simulation and reestimation analysis similar to the one presented here could be implemented to evaluate the impact of bias on BLOQ approaches.
In the “All data” approach, concentrations that were below the LOD (defined as 30% of the LLOQ in this analysis) were discarded as these concentrations are based on signals that are hardly distinguishable from signal noise. In theory, one could incorporate these data using the LIKE likelihood method, by maximizing on the likelihood of these data actually being <LOD. This approach was evaluated as well, however, we did not observe a relevant decrease in bias, compared to the “LIKE” or the “All data” method but did notice an increase in imprecision and percentage of unsuccessful runs. This approach therefore does not offer advantages over the “All data” method. The “All data” approach was also shown to perform best in the analysis of unbalanced data sets, such as obtained from dose escalation trials.
The evaluation of the performance of the methods using a real PK data set showed that it is feasible to use the proposed “All data” method. We were able to obtain the necessary (extrapolated) concentrations from the bioanalytical laboratory, and incorporated these. In the resulting data set, only 7.4% of data were BLOQ. Similar to what was seen in the simulations for data sets with low percentages of BLOQ data, no relevant differences were seen between the parameter estimates obtained with the four methods. In a previous PopPK analysis, in which the percentage of BLOQ data was only 5%, we also observed similar parameter estimates when using either the “LIKE” method compared to discarding the BLOQ data (Keizer et al. 2008). These findings confirm the result of the simulation studies that when the percentage of BLOQ is low (<10%), the method for handling BLOQ data is irrelevant. Stability of estimation was, however, better for the “All data” method than for the other methods, judged by the percentages of successful minimization. Surprisingly, successful completion of the covariance steps was markedly different between the “All data” method and the other methods. However, as has been noticed before (Bergstrand and Karlsson 2009), no significant differences in parameter estimates were found between runs with successful and unsuccessful minimizations, or runs with successful and unsuccessful covariance steps.
The feasibility of the proposed approach particularly depends on a good collaboration and understanding between the analytical laboratory and the PK analyst. For example, if the “All data” method is to be used in a PopPK analysis, it must be ensured that BLOQ data are recorded with as much care as data above the LLOQ: integration parameters should provide adequate integration below the LLOQ. Based on the results of the current analysis, we feel that, when the LLOQ data are handled appropriately by the PK analyst, there is no need for the bioanalytical laboratory to censor data below that cutoff level. In fact, solely from a modeling perspective, there is no need for the bioanalytical laboratory to report the LLOQ at all besides as a measure of reliability of data, since all measurable concentration data can be used in the construction of the PK model. However, it must be stressed that the results of the current analysis only apply to model-based population PK analyses, and these findings cannot directly be extrapolated to noncompartmental PK analyses.
Besides the statistical advantages of the “All data” method discussed above, the ethical and regulatory aspects of handling BLOQ data deserve consideration as well. Since concentration data for PK analyses are generally obtained from trials in patients, we feel it is the moral obligation of the bioanalytical and data-analysts to extract as much data from the collected patient samples as possible. This ethical argument may be considered especially important in PK analyses performed in special patients groups such as children or critically ill patients, and handling BLOQ data in the most appropriate way is imperative in such situations. We feel that regulators are often open to accept novel methodology if presented with clear and unambiguous evidence that the new approach is unbiased and reliable. The current paper is a first step to (re-)start discussions around this topic, and subsequent analyses would be useful to investigate its validity further for a wider variety of cases. When using the “All data” approach in a regulatory filing, and especially when concerning model structures outside the scenarios evaluated in this paper, we would advise to provide evidence that the chosen BLOQ method did either not affect the model building in a meaningful way or provided a better approach than current standard approaches. This can, for example, be done with a simulation study similar to the one presented in this article.
In this report, we limited our analysis of performance of the various BLOQ methods to PK examples, as we were able to define credible analytical error models from literature data for bioanalysis of drugs and metabolites for PK data. In the modeling of pharmacodynamic (PD) data, a much wider variety of models and data is encountered, and bioanalytical methods are seldom validated as rigorously as PK assays. However, the conclusions drawn here are likely to apply to PD analyses in a similar fashion, if an LLOQs is defined at all for the bioanalysis of the PD analyte. For PD data and PD modeling analyses, the magnitude of analytical error and model misspecification, are often higher than in PK analyses. Therefore, in the case of specific PD analyses, additional prospective or retrospective simulation and reestimation analyses may be indicated to guide the choice of the BLOQ method.
Conclusion
Using simulation and reestimation analyses, we showed that the use of concentration data under the LLOQ resulted in increased performance in terms of bias and precision especially when the percentage of data BLOQ is above 10%. Also, better performance in terms of model stability and successful minimization were observed compared to a likelihood-based method. We also showed that the approach is feasible by applying it to a population PK analysis of a data set obtained from an actual clinical trial. We therefore advocate the use of extrapolated concentrations below the LLOQ, and would like to advise modelers to establish consent with the bioanalysis contractor to obtain these data.
Author Contributions
R. J. K. wrote the manuscript and performed the simulations and statistical analysis. R. S. J., H. R., and B. T. collected the bioanalytical data. R. J. K., R. S. J., A. D. R. H., J. H. B., and J. H. S. M. S. designed the study. All authors read and commented on the manuscript.
Disclosures
The clinical trial from which the actual PK data set was obtained was sponsored by Eisai Co. All authors have completed the Unified Competing Interest form at http://www.icmje.org/coi_disclosure.pdf (available on request from the corresponding author) and declare: R. J. K. was supported by a grant from the Eisai network of companies; no financial relationships with any organizations that might have an interest in the submitted work in the previous 3 years; no other relationships or activities that could appear to have influenced the submitted work.
Glossary
- BLOQ
below the limit of quantification
- BSV
between-subject variation
- FO
first-order estimation
- FOCEI
first-order conditional estimation method with interaction
- LC-MS
liquid chromatography–mass spectrometry
- LIKE
likelihood-based
- LLOQ
lower limit of quantification
- LOD
limit of detection
- MS
mass spectrometry
- ND
nondetectable
- NONMEM
nonlinear mixed-effects modeling
- PD
pharmacodynamic
- PK
pharmacokinetic
- PopPK
population pharmacokinetic
- QC
quality control
- RMSE
root mean squared error
- SAEM
stochastic approximation expectation maximization
References
- Ahn C. An evaluation of phase I cancer clinical trial designs. Stat Med. 1998;17:1537–1549. doi: 10.1002/(sici)1097-0258(19980730)17:14<1537::aid-sim872>3.0.co;2-f. [DOI] [PubMed] [Google Scholar]
- Ahn J, Karlsson M, Dunne A, Ludden T. Likelihood based approaches to handling data below the quantification limit using NONMEM VI. J Pharmacokinet Pharmacodyn. 2008;35:401–421. doi: 10.1007/s10928-008-9094-4. [DOI] [PubMed] [Google Scholar]
- Beal SL. Ways to fit a PK model with some data below the quantification limit. J Pharmacokinet Pharmacodyn. 2001;28:481–504. doi: 10.1023/a:1012299115260. [DOI] [PubMed] [Google Scholar]
- Beal SL, Sheiner L. NONMEM users guides. Ellicott City, MD: Icon Development Solutions; 1989. [Google Scholar]
- Bergstrand M, Karlsson MO. Handling data below the limit of quantification in mixed effect models. AAPS J. 2009;11:371–380. doi: 10.1208/s12248-009-9112-5. [DOI] [PMC free article] [PubMed] [Google Scholar]
- Beumer JH, Rosing H, Hillebrand MJX, Nan-Offeringa LGAH, Foley K, Yule SM, et al. Quantitative determination of the novel anticancer drug E7070 (indisulam) and its metabolite (1,4-benzenedisulphonamide) in human plasma, urine and faeces by high-performance liquid chromatography coupled with electrospray ionization tandem mass spectrometry. Rapid Commun Mass Spectrom. 2004;18:2839–2848. doi: 10.1002/rcm.1699. [DOI] [PubMed] [Google Scholar]
- Borges NC, Astigarraga RB, Sverdloff CE, Galvinas PR, da Silva WM, Rezende VM, et al. A novel and sensitive method for ethinylestradiol quantification in human plasma by high-performance liquid chromatography coupled to atmospheric pressure photoionization (APPI) tandem mass spectrometry: application to a comparative pharmacokinetics study. J Chromatogr B Analyt Technol Biomed Life Sci. 2009;877:3601–3609. doi: 10.1016/j.jchromb.2009.08.048. [DOI] [PubMed] [Google Scholar]
- Byon W, Fletcher CV, Brundage RC. Impact of censoring data below an arbitrary quantification limit on structural model misspecification. J Pharmacokinet Pharmacodyn. 2008;35:101–116. doi: 10.1007/s10928-007-9078-9. [DOI] [PubMed] [Google Scholar]
- Carli D, Honorat M, Cohen S, Megherbi M, Vignal B, Dumontet C, et al. Simultaneous quantification of 5-FU, 5-FUrd, 5-FdUrd, 5-FdUMP, dUMP and TMP in cultured cell models by LC-MS/MS. J Chromatogr B Analyt Technol Biomed Life Sci. 2009;877:2937–2944. doi: 10.1016/j.jchromb.2009.07.004. [DOI] [PubMed] [Google Scholar]
- Clavijo C, Strom T, Moll V, Betts R, Zhang YL, Christians U, et al. Development and validation of a semi-automated assay for the highly sensitive quantification of Biolimus A9 in human whole blood using high-performance liquid chromatography-tandem mass spectrometry. J Chromatogr B Analyt Technol Biomed Life Sci. 2009;877:3506–3514. doi: 10.1016/j.jchromb.2009.08.020. [DOI] [PMC free article] [PubMed] [Google Scholar]
- Damen CWN, Rosing H, Tibben MM, van Maanen MJ, Lagas JS, Schinkel AH, et al. A sensitive assay for the quantitative analysis of vinorelbine in mouse and human EDTA plasma by high-performance liquid chromatography coupled with electrospray tandem mass spectrometry. J Chromatogr B Analyt Technol Biomed Life Sci. 2008;868:102–109. doi: 10.1016/j.jchromb.2008.04.046. [DOI] [PubMed] [Google Scholar]
- Damen CWN, Rosing H, Schellens JHM, Beijnen JH. Application of dried blood spots combined with high-performance liquid chromatography coupled with electrospray ionisation tandem mass spectrometry for simultaneous quantification of vincristine and actinomycin-D. Anal Bioanal Chem. 2009a;394:1171–1182. doi: 10.1007/s00216-009-2775-z. [DOI] [PubMed] [Google Scholar]
- Damen CWN, Lagas JS, Rosing H, Schellens JHM, Beijnen JH. The bioanalysis of vinorelbine and 4-O-deacetylvinorelbine in human and mouse plasma using high-performance liquid chromatography coupled with heated electrospray ionization tandem mass-spectrometry. Biomed Chromatogr. 2009b;23:1316–1325. doi: 10.1002/bmc.1255. [DOI] [PubMed] [Google Scholar]
- FDA. Guidance for industry: bioanalytical method validation. FDA; 2001. http://www.fda.gov/downloads/Drugs/Guidances/ucm070107.pdf. Accessed Jan 5, 2014. [Google Scholar]
- Gu Y, Si D, Gao J, Zeng Y, Liu C. Simultaneous quantification of psoralen and isopsoralen in rat plasma by ultra-performance liquid chromatography/tandem mass spectrometry and its application to a pharmacokinetic study after oral administration of Haigou Pill. J Chromatogr B Analyt Technol Biomed Life Sci. 2009;877:3137–3143. doi: 10.1016/j.jchromb.2009.07.035. [DOI] [PubMed] [Google Scholar]
- ter Heine R, Alderden-Los CG, Rosing H, Hillebrand MJX, van Gorp ECM, Huitema ADR. Fast and simultaneous determination of darunavir and eleven other antiretroviral drugs for therapeutic drug monitoring: method development and validation for the determination of all currently approved HIV protease inhibitors and non-nucleoside reverse transcriptase inhibitors in human plasma by liquid chromatography coupled with electrospray ionization tandem mass spectrometry. Rapid Commun Mass Spectrom. 2007;21:2505–2514. doi: 10.1002/rcm.3119. [DOI] [PubMed] [Google Scholar]
- ter Heine R, Hillebrand M, Rosing H, van Gorp E, Mulder J, Beijnen J. Quantification of the HIV-integrase inhibitor raltegravir and detection of its main metabolite in human plasma, dried blood spots and peripheral blood mononuclear cell lysate by means of high-performance liquid chromatography tandem mass spectrometry. J Pharm Biomed Anal. 2009;49:451–458. doi: 10.1016/j.jpba.2008.11.025. [DOI] [PubMed] [Google Scholar]
- Jansen RS, Rosing H, Kromdijk W, Ter Heine R, Schellens JH, Beijnen JH. Simultaneous quantification of emtricitabine and tenofovir nucleotides in peripheral blood mononuclear cells using weak anion-exchange liquid chromatography coupled with tandem mass spectrometry. J Chromatogr B Analyt Technol Biomed Life Sci. 2010;878:621–627. doi: 10.1016/j.jchromb.2010.01.002. . Available at http://www.ncbi.nlm.nih.gov/pubmed/20122883 [Internet] [DOI] [PubMed] [Google Scholar]
- Jansen RS, Rosing H, Schellens JHM, Beijnen JH. Simultaneous quantification of 2′,2′-difluorodeoxycytidine and 2′,2′-difluorodeoxyuridine nucleosides and nucleotides in white blood cells using porous graphitic carbon chromatography coupled with tandem mass spectrometry. Rapid Commun Mass Spectrom. 2009;23:3040–3050. doi: 10.1002/rcm.4212. [DOI] [PubMed] [Google Scholar]
- Keizer R, Zamacona M, Jansen M, Critchley D, Wanders J, Beijnen J, et al. Application of population pharmacokinetic modeling in early clinical development of the anticancer agent E7820. Invest New Drugs. 2008;27:140–152. doi: 10.1007/s10637-008-9164-x. Available at http://www.ncbi.nlm.nih.gov/pubmed/18712503 [Internet] [DOI] [PubMed] [Google Scholar]
- Ling Y, Ren C, Mallery SR, Ugalde CM, Pei P, Saradhi UV, et al. A rapid and sensitive LC-MS/MS method for quantification of four anthocyanins and its application in a clinical pharmacology study of a bioadhesive black raspberry gel. J Chromatogr B Analyt Technol Biomed Life Sci. 2009;877:4027–4034. doi: 10.1016/j.jchromb.2009.10.026. [DOI] [PMC free article] [PubMed] [Google Scholar]
- Nirogi R, Kandikere V, Mudigonda K, Komarneni P, Aleti R. Liquid chromatography atmospheric pressure chemical ionization tandem mass spectrometry method for the quantification of pregabalin in human plasma. J Chromatogr B Analyt Technol Biomed Life Sci. 2009a;877:3899–3906. doi: 10.1016/j.jchromb.2009.10.004. [DOI] [PubMed] [Google Scholar]
- Nirogi R, Kandikere V, Mudigonda K, Komarneni P, Boggavarapu R. Liquid chromatography-tandem mass spectrometry method for the quantification of dimebon in rat plasma and brain tissue. J Chromatogr B Analyt Technol Biomed Life Sci. 2009b;877:3563–3571. doi: 10.1016/j.jchromb.2009.08.042. [DOI] [PubMed] [Google Scholar]
- Ptolemy AS, Tzioumis E, Thomke A, Rifai S, Kellogg M. Quantification of theobromine and caffeine in saliva, plasma and urine via liquid chromatography-tandem mass spectrometry: a single analytical protocol applicable to cocoa intervention studies. J Chromatogr B Analyt Technol Biomed Life Sci. 2010;878:409–416. doi: 10.1016/j.jchromb.2009.12.019. [DOI] [PubMed] [Google Scholar]
- Qiao J, Tan Z, Li W, Huang L, Ge M. Liquid chromatography/positive ion electrospray tandem mass spectrometry method for the quantification of hydrochloride meptazinol in human plasma: application to a pharmacokinetic study. J Chromatogr B Analyt Technol Biomed Life Sci. 2009;877:3787–3791. doi: 10.1016/j.jchromb.2009.08.051. [DOI] [PubMed] [Google Scholar]
- Ryan DP, Eder JP, Appleman L, Fidias P, Johnson B, Lucca J. A phase I study of E7070, a chloroindolyl-sulfonamide, in combination with irinotecan in gastrointestinal and thoracic carcinomas. J Clin Oncol (Meeting Abstracts) 2005;23(16 Suppl):2031. [Google Scholar]
- Stanton ML, Joy MS, Frye RF. Validation and application of a liquid chromatography-tandem mass spectrometric method for quantification of the drug transport probe fexofenadine in human plasma using 96-well filter plates. J Chromatogr B Analyt Technol Biomed Life Sci. 2010;878:497–501. doi: 10.1016/j.jchromb.2009.12.022. [DOI] [PMC free article] [PubMed] [Google Scholar]
- Vainchtein LD, Thijssen B, Stokvis E, Rosing H, Schellens JHM, Beijnen JH. A simple and sensitive assay for the quantitative analysis of paclitaxel and metabolites in human plasma using liquid chromatography/tandem mass spectrometry. Biomed Chromatogr. 2006a;20:139–148. doi: 10.1002/bmc.544. [DOI] [PubMed] [Google Scholar]
- Vainchtein LD, Rosing H, Mirejovsky D, Huynh V, Lenaz L, Hillebrand MJX, et al. Quantitative analysis of EO9 (apaziquone) and its metabolite EO5a in human plasma by high-performance liquid chromatography under basic conditions coupled to electrospray tandem mass spectrometry. J Mass Spectrom. 2006b;41:1268–1276. doi: 10.1002/jms.1086. [DOI] [PubMed] [Google Scholar]
- Vainchtein LD, Rosing H, Maier A, Fiebig H, Schellens JHM, Beijnen JH. Quantitative and selective assay of 5-methylindirubine, an inhibitor of cyclin-dependent kinases, in murine plasma using coupled liquid chromatography and electrospray tandem mass spectrometry. J Chromatogr B Analyt Technol Biomed Life Sci. 2007a;856:261–266. doi: 10.1016/j.jchromb.2007.06.006. [DOI] [PubMed] [Google Scholar]
- Vainchtein LD, Rosing H, Thijssen B, Schellens JHM, Beijnen JH. Validated assay for the simultaneous determination of the anti-cancer agent gemcitabine and its metabolite 2′,2′-difluorodeoxyuridine in human plasma by high-performance liquid chromatography with tandem mass spectrometry. Rapid Commun Mass Spectrom. 2007b;21:2312–2322. doi: 10.1002/rcm.3096. [DOI] [PubMed] [Google Scholar]
- Wakefield J, Racine-Poon A. An application of Bayesian population pharmacokinetic/pharmacodynamic models to dose recommendation. Stat Med. 1995;14:971–986. doi: 10.1002/sim.4780140917. [DOI] [PubMed] [Google Scholar]
- Zandvliet AS, Schellens JHM, Copalu W, Beijnen JH, Huitema ADR. A semi-physiological population pharmacokinetic model describing the non-linear disposition of indisulam. J Pharmacokinet Pharmacodyn. 2006;33:543–570. doi: 10.1007/s10928-006-9021-5. [DOI] [PubMed] [Google Scholar]
- Zhang H, Zhong D, Zhang Z, Dai X, Chen X. Liquid chromatography/tandem mass spectrometry method for the quantification of deserpidine in human plasma: application to a pharmacokinetic study. J Chromatogr B Analyt Technol Biomed Life Sci. 2009;877:3221–3225. doi: 10.1016/j.jchromb.2009.06.005. [DOI] [PubMed] [Google Scholar]