

Abstract
Recent studies demonstrate that human blood transcriptional signatures may be used to support diagnosis and clinical decisions for acute respiratory viral infections such as influenza. In this article, we propose to use a newly developed systems biology approach for time course gene expression data to identify significant dynamically response genes and dynamic gene network responses to viral infection. We illustrate the methodological pipeline by reanalyzing the time course gene expression data from a study with healthy human subjects challenged by live influenza virus. We observed clear differences in the number of significant dynamic response genes (DRGs) between the symptomatic and asymptomatic subjects and also identified DRG signatures for symptomatic subjects with influenza infection. The 505 common DRGs shared by the symptomatic subjects have high consistency with the signature genes for predicting viral infection identified in previous works. The temporal response patterns and network response features were carefully analyzed and investigated.
Keywords: Gene regulatory network, Differential equation, ODE modeling, Functional principle component analysis, Dynamic response gene, Variable selection
Introduction
Acute respiratory infection (ARI) is not only one of big threats for public health, but also one of the big burdens for health care systems due to a large number of outpatient visits and heavy needs of medical attention, including hospitalizations [1-3]. In particular, influenza infection usually results in significant seasonal morbidity and mortality each year, and it occasionally causes serious pandemics [4]. Traditionally pathogen-based assays are used for diagnosis and supporting clinical decisions [5]. Recently host gene signatures based on blood samples were identified as a potential marker for diagnosis and discrimination of symptomatic subjects from asymptomatic subjects [6-8]. Pathogenesis of and host immune responses to viral infections could be further understood by exploring host gene responses, so that more biomarkers and diagnostic tools could be developed for disease severity of ARI.
In the study by Huang et al. [7], 17 healthy human subjects were inoculated with a live influenza virus (H3N2/Wisconsin) and frequent peripheral blood samples were collected for gene expression profiling (16 time points over 132 hours). The symptomatic scores and viral shedding were also obtained for each subject during the experimental period. Clinically uninformed factor analysis using Bayesian Linear Unmixing (BLU) [9-11] was employed to identify a gene signature factor (index) to discriminate between symptomatic and asymptomatic subjects, and clinically informed pathway analysis was carried out to identify the differences in temporal gene expression patterns between symptomatic and asymptomatic subjects. Unsupervised sparse Bayesian factor analysis were also applied to data from several other viral infection (H1N1 influenza, RSV and rhinovirus) challenge studies [6, 8]. A limitation of this approach is that it treated the gene expression data at different time points as independent replicates and the dynamic feature of time course gene expression data was not efficiently used.
Another approach that constructs gene regulatory networks from time course gene expression data has been developed for the H1N1 influenza infection of dendritic cells in vitro in Zaslavsky et al. [12]. This Time-Dependent Activity Linker (TIDAL) method uses known binding site information (TRANSFAC matrices) associated to the TF gene temporal activity to construct the regulatory network. This approach defines a temporal-map of networks representing the activity of connected transcription factors, which is quite different from our method that considers a network of the dynamics of gene expressions.
In this article, we propose to use an alternative approach to reanalyze the data from Huang et al.[7] by considering the dynamic gene response features to identify gene signatures to discriminate between symptomatic and asymptomatic subjects, and at the same time, to further investigate dynamic network responses to influenza infection at gene level. We define the “dynamic response genes” (DRGs) as genes that dynamically change their expression levels significantly compared to a flat line (no significant change) during the whole experimental period. Our proposed approach employs a hypothesis testing method based on functional principle component analysis (FPCA) [13] to identify significant genes for each subject separately. The DRGs are different from those differentially expressed genes (DEGs) identified by comparing the gene expression levels to those in a control group of subjects, which was done in the original paper [7]. In our method, no control subject is required and the time course data for each gene from each subject serve as their own control, which is more powerful to detect significant temporal response genes because the within-subject variation is generally smaller than the between-subject variation.
A key advantage of our approach is that we consider the time course gene expression profile as a dynamic response to viral infection from a system perspective so that we could borrow the strength of gene expression data across time, which is more powerful than the analysis based on each time point separately. We have found that the gene expression patterns of the symptomatic and asymptomatic subjects are quite different from each other and some genes of the asymptomatic subjects have quicker responses to viral infection than those of the symptomatic subjects. In addition, the number of significant dynamic response genes (DRGs) can also be used to discriminate the symptomatic subjects from asymptomatic subjects in this study. The ordinary differential equation (ODE) models are used to construct the dynamic response gene networks so that we could better understand the dynamic response mechanisms to viral infection at the gene level.
Materials and methods
Experimental data
In this work, we reanalyze the data from a human influenza challenge study described in Zaas et al. and Huang et al.[6, 7]. In this study, a cohort of 17 healthy human volunteers received intranasal inoculation of influenza H3N2/Wisconsin (four different doses) and 9 of them developed mild to severe symptoms. A total of m = 11961 gene expression profiles were available on whole peripheral blood drawn from all subjects at 16 time points. These time points cover a total of 132 hours of observation, including 15 measurements at 0, 5, 12, 21, 29, 36, 45, 53, 60, 69, 77, 84, 93, 101, 108 hours post inoculation (hpi) and one measurement taken 24 hours before inoculation (-24 hpi). Standardized clinical symptom scores were reported for each subject from 0 to 144 hpi. Nasal washes were taken daily (day 0 to day 7) to determine viral shedding using quantitative PCR. See Huang et al. [7] for more details about the experiment and data.
ODE network construction pipeline
For each of the 17 subjects, we applied the pipeline proposed by Wu et al. [14] for time course gene expression data analysis to identify dynamic response genes (DRGs), group DRGs into co-expressed clusters and construct the gene regulatory network using ordinary differential equation (ODE) models. The pipeline was applied to the time course data for each of the 17 subjects separately. For simplicity of presentation, the pipeline is described for one subject and the subject index is suppressed. D-NetWeaver, a graphical user interface (GUI) software that implements this pipeline is freely available at https://cbim.urmc.rochester.edu/software/d-netweaver/.
We treat the expression profile of each gene Xi (t) as a smooth curve of time and the time course gene expression measurements are discrete observations from Xi (t) that are contaminated by noisy signal, i.e., Yij = Xi (tj) + εij, where εij are assumed to be i.i.d. random variables with mean 0 and variance σ2, i = 1,…, G, j = 1, …, n. We use the functional principle component analysis (FPCA) [15] to approximate Xi (t) from the noisy time course gene expression data through a databased eigen-representation:
| (1) |
where μi is the mean expression of the i-th gene during the experimental period; ϕl are the sequences of orthonormal eigenfunctions that reflect the direction of major shape deviations from the mean expression; and the random coefficients ξil are the corresponding functional principal component scores that indicate how much a gene deviates from the mean expression in the direction of ϕl [15]. The top L eigenfunctions are selected such that the total variation explained exceeds a pre-specified threshold (such as 90%).
The hypothesis of testing dynamic response genes (DRGs) can be written as
| (2) |
Here we test for each gene whether the expression profile is a flat line post inoculation and μi is estimated as the sample mean of the i-th gene, which uses all data of gene i instead of just one single time point. The test statistic that compares the goodness-of-fit of the null model to the alternative model can be written as
| (3) |
where and are the residual sum of squares under the null and the alternative models for the i-th gene, respectively; ρ is a small constant that helps stabilize the variance of Fi and is set as the estimated variance σ̂2 of the noisy signal εij. A permutation test is used to generate the null distribution of Fi and the multiple testing adjustment method proposed by Benjamini and Hochberg [16] is applied to control the false discovery rate (FDR). Here we used the FDR=0.05.
For the selected DRGs, a gene-wise standardization procedure is applied to remove the magnitude differences. This procedure is commonly adopted when the goal is to group genes that are functionally related [17]. We then use the K-means clustering method [18] to group DRGs into co-expressed clusters (DRGs with similar temporal response patterns). The commonly adopted “elbow” rule [19] or the empirical method proposed by [14] for determining the number of clusters K are subjective criteria, because they both depend on visual inspections of the curve of the within-cluster sum of squares against the number of clusters. To keep consistency in objectively determining the number of clusters for all subjects, we select the number of clusters for each subject as the minimum K such that the percentage of variance explained exceeds 75%, i.e., K = argmink {1 – rss(k)/rss(1) > 0.75}, where rss(k) represents the within-cluster sum of squares for k clusters.
Within each cluster, the gene expression patterns are similar, so we can treat the time course data of these genes as longitudinal or repeated measurements of a “supergene” and model them using the following nonparametric mixed-effects model [20]:
| (4) |
where Ck is the collection of gene indices for the k-th cluster; Mk (t) is the mean expression curve for cluster k, k = 1, …, K; and ηi (·) is the random-effects function that quantifies the deviation of the expression level of gene i from the mean expression Mk (t). Applying mixed-effects smoothing splines [20], we can obtain the estimates of the mean expression curve Mk (t) and its first order derivative for each cluster. Following [21], we suggest under-smoothing these curves in this step.
The cluster-based ODE network model with an input function can be written as
| (5) |
where βk0 is the intercept; coefficients {βki}k,i =1,…,K quantify the regulatory effects of the other clusters, including self-regulation, on the rate of expression change of the k-th cluster; V (t) is an input function that can stimulate the gene response; and γk represents the effect of the input function on the k-th cluster. In this work, the input function V (t) is the influenza virus which is measured by viral titers. If βki ≠ 0, genes in the i-th cluster may have an effect on genes in the k-th cluster such that the expression levels for genes in cluster i may affect the change (derivative) of expression levels for genes in cluster k. Similarly, if γk ≠ 0, the influenza virus may potentially have a direct interaction with the change of expression levels for genes in the k-th cluster, and we refer this cluster as the viral interaction node (VIN) in the gene response network. The variable selection approach, described below, is used to determine whether βki = 0 and γk = 0.
The identification of network structure is equivalent to identifying the nonzero coefficients S = {1 ≤ k, i ≤ K : βki ≠ 0, γk ≠ 0}. If βki ≠ 0, there is an edge between clusters k and i, directed from cluster i to cluster k. We plug the estimated mean expression curves and their derivatives M̂k (t) and into (5) to decouple the ODE system to a set of pseudo linear regression models:
| (6) |
where the error term δkj represents the aggregated estimation error of M̂k (t) and and model error due to the substitution of the differential equation variables by M̂k (t) and . The curve of viral titers V (t) can also be replaced by its smoothed curve in order to reduce the measurement noises. For each of these pseudo regression models, we apply the smoothly clipped absolute deviation (SCAD) method [22] to select nonzero βki and γk’s. Note that since M̂k (t) and are estimated continuously as nonparametric functions, we recommend using augmented data from M̂k (t) and at time points , where N can be larger than the original sample size n. This data augmentation strategy has also been used by other investigators before [23, 24]. More technical details can be found in [14, 25].
If more sparsity is desired after the ODE model selection step using the SCAD method, we can apply a best subset GLM approach to further shrink the model size. A discussion of the subset approach against other penalization based methods such as LARS or LASSO can be found in [26]. We used the R package bestglm [27] which employs a simple exhaustive enumeration approach. Since the exhaustive search is known to be computationally intensive, we only use it on the ODE model selected by the SCAD method, which has a moderate number of nonzero coefficients for each differential equation. The method selects the best model out of a set of 10 top best ODE models using a BIC type criterion, where instead of a prior uniform of all possible models, a prior uniform of models of fixed size is used [27]. Once the network structure is determined, we can refine the parameter estimates for the selected ODE model using the nonlinear least squares (NLS) method [28].
Genes within the same cluster may have many biological functions and certain functions may be enriched in this cluster compared to the population of genes in an organism or a biological process. These enriched functions are the key factors to understand the role that the cluster plays in the whole network. We can use DAVID [29] to identify the gene ontology (GO) functional annotations and KEGG/BioCarta/Reactome to identify pathways that are enriched in each cluster. A modified Fisher’s exact test is carried out for each functional term under the null hypothesis that this function is not over-represented in the cluster compared to the background population [29]. The statistical significance of each functional term is adjusted by the multiple testing adjustment method proposed by Benjamini and Hochberg[16].
Network topology feature analysis
After a response network is established using the above pipeline, we employ the Cytoscape [30, 31], a network software tool, to analyze the topological and graphical features of the network. We summarize the network features such as network connectivity, density, and average shortest path as well as other characteristics for each of the gene response networks. In particular, the neighborhood of a given node N is the set of its neighbors. The connectivity of node N, denoted by kN, is the size of its neighborhood. The average number of neighbors for all nodes in a network indicates the average connectivity of a node in a network. A normalized version of this index is the network density. The network density is a value between 0 and 1, which indicates how densely the network is populated with edges (self-loops and duplicated edges are ignored). A network which contains no edges and solely isolated nodes has a density of 0. In contrast, the density of a clique is 1. The shortest path length is also called distance between two nodes. The network heterogeneity reflects the tendency of a network to contain hub nodes (A hub is a node in a graph with much higher number of outward edges than average.)
Results
Significant dynamic response genes for individual subjects
We identified different numbers of significant DRGs for different subjects, controlling the FDR at 0.05 (Table 1). As a by-product of the FPCA-based significant testing for DRGs, we also obtained the functional principle components that could explain over 90% of total variations of dynamic gene expression profiles for each subject (these eigenfunctions for individual subjects are shown in Figure S1 in the electronic supplementary material.) and the accumulated fractions of variations explained by the first three principal components for each subject are also summarized in Table 1. Complete lists of all the DRGs for each subject can be found in the supplementary materials.
Table 1.
The number of significant dynamic response genes (DRGs) (the third column) and the accumulated fractions of variations explained by the first three principal components (last three columns).
| Subject ID | Symptom | # of DRGs | pc1 | pc2 | pc3 |
|---|---|---|---|---|---|
| 1 | Symptomatic | 2622 | 0.48 | 0.90 | 0.98 |
| 5 | Symptomatic | 3869 | 0.79 | 0.94 | 1.00 |
| 6 | Symptomatic | 5954 | 0.62 | 0.89 | 0.99 |
| 7 | Symptomatic | 4693 | 0.67 | 0.97 | 0.98 |
| 8 | Symptomatic | 3339 | 0.88 | 0.97 | 1.00 |
| 10 | Symptomatic | 3314 | 0.87 | 0.95 | 0.98 |
| 12 | Symptomatic | 3901 | 0.68 | 0.95 | 0.98 |
| 13 | Symptomatic | 3890 | 0.73 | 0.93 | 0.99 |
| 15 | Symptomatic | 5097 | 0.65 | 0.96 | 1.00 |
| 2 | Asymptomatic | 13 | 0.77 | 0.99 | 0.99 |
| 3 | Asymptomatic | 3094 | 0.98 | 1.00 | 1.00 |
| 4 | Asymptomatic | 0 | 0.94 | 0.99 | 1.00 |
| 9 | Asymptomatic | 671 | 0.83 | 0.99 | 1.00 |
| 11 | Asymptomatic | 1410 | 0.83 | 0.98 | 1.00 |
| 14 | Asymptomatic | 291 | 0.53 | 0.98 | 1.00 |
| 16 | Asymptomatic | 92 | 0.94 | 0.97 | 0.98 |
| 17 | Asymptomatic | 3197 | 0.98 | 1.00 | 1.00 |
First we can clearly see that the number of significant DRGs for symptomatic subjects (average 4075) is much larger (p = 0.0001) than that of asymptomatic subjects (average 1096). As a matter of fact, the numbers of significant DRGs for all the symptomatic subjects except Subject 1 are larger than 3300 and the numbers of significant DRGs for all the asymptomatic subjects are smaller than 3300. If we use the number of DRGs to discriminate symptomatic subjects from asymptomatic subjects, only one subject is misclassified. Six out of 8 asymptomatic subjects even had 50% fewer significant DRGs than most of the symptomatic subjects. Specifically, the asymptomatic subject 4 had no significant DRGs identified, and Subjects 2 and 16 only had 13 and 92 significant DRGs, respectively. This indicates that the asymptomatic subjects, who also had low viral shedding [7], did not have strong gene-level responses for the whole experimental time period.
The functional principle component analysis (FPCA) shows that the dynamic gene expression response patterns were different for different subjects (Figure S1 in the electronic supplementary material). In particular, after careful examination of the first eigenfunction for individual subjects, we found a trend that, some genes of asymptomatic subjects had a quicker response in early hours than those of the symptomatic subjects. These quick response genes may play an important role in controlling influenza virus replication for the asymptomatic subjects. To confirm this quantitatively, we fitted a linear regression model for each gene of every subject using the gene expression data in the first day and estimated the “first-day response rate” by the slope of the regression. Comparing the magnitude of the response rate for each gene between the symptomatic and asymptomatic subjects, we identified that the first-day response rates of two genes (FGF9 and TLN1) for the asymptomatic subjects were significantly larger (p = 0.004 and 0.006 respectively) than those for the symptomatic subjects. If we use these two genes to distinguish asymptomatic subjects from symptomatic subjects, only one subject is misclassified (see Figure 1). In addition, the first-day response rates of 17 other genes for asymptomatic subjects were also significantly larger than those for the symptomatic subjects and only two subjects are misclassified if these genes are used to distinguish the asymptomatic subjects from the symptomatic subjects (see Figure S2 in the electronic supplementary material).
Fig. 1.
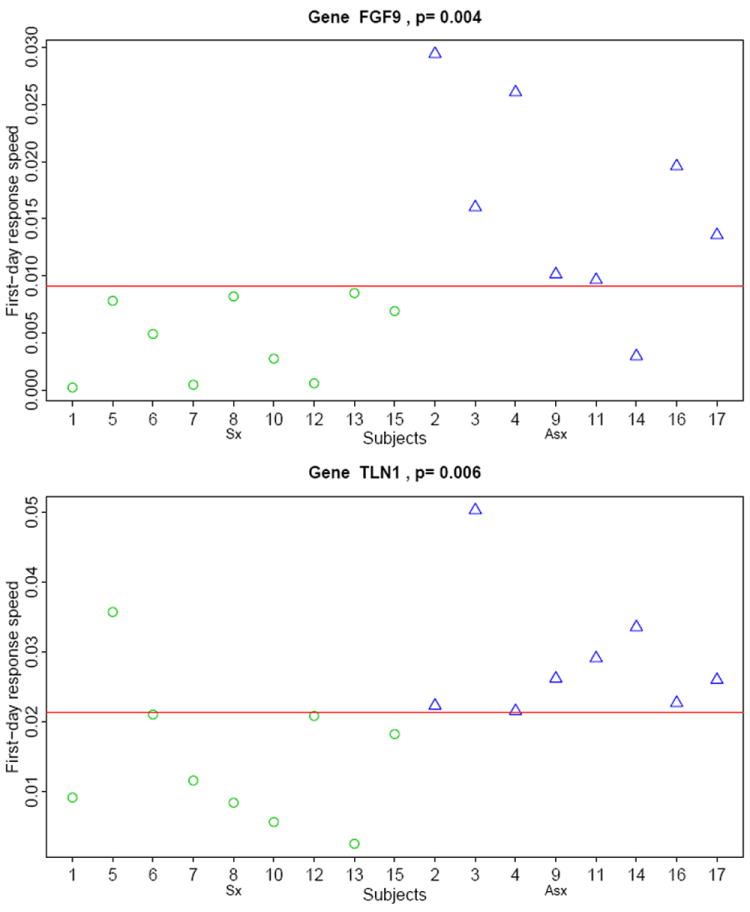
First-day response rates of two genes, FGF9 and TLN1, for symptomatic (circle) and asymptomatic (triangle) subjects.
Common DRGs for symptomatic subjects
We found that 505 DRGs (about 12% of significant DRGs per subject in average) are in common for all the 9 symptomatic subjects. Further exploration of these common DRGs reveals some interesting findings. The expression patterns of these 505 common DRGs were clustered into 8 groups. We found that these expression patterns are all bell-shaped: 4 up-regulated patterns with different peak times (or different response times) and symmetrically 4 down-regulated patterns (Figure 2). Two response patterns (one up-regulated and one down-regulated) were early response patterns and peaked at Day 2; four response patterns (two up-regulated and two down-regulated) were delayed response patterns and peaked at Day 3; and two other response patterns (one up-regulated and one down-regulated) were late response patterns and peaked at Day 4. The peak time was calculated based on the smoothed response curve for each cluster (Figure 2). The common DRGs for different subjects may fall into different response patterns. Figure 3 shows the distribution (percentage) of these common DRGs for each subject over 8 different response patterns. Interestingly the DRGs for each subject are mainly distributed to 2 or 3 patterns instead of spreading out into the 8 patterns. In particular, the DRGs for Subjects 1, 6, 7 and 12 are mainly distributed in early response patterns; the DRGs for Subjects 8, 10, 13, 15 are mainly distributed in late response patterns; and the DRGs for Subject 5 are distributed across both early and delayed response patterns. Another interesting observation is that the number of DRGs for each subject are equally distributed to up-regulated and down-regulated temporal patterns.
Fig. 2.
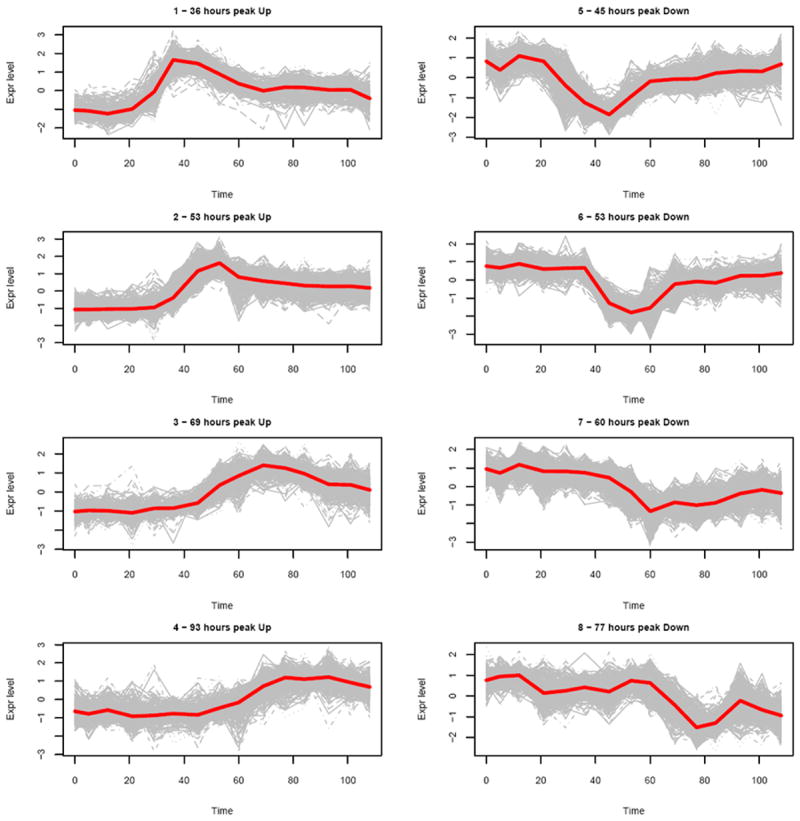
Temporal cluster patterns for the 505 common DRGs from 9 symptomatic subjects (red lines indicate cluster centers).
Fig. 3.
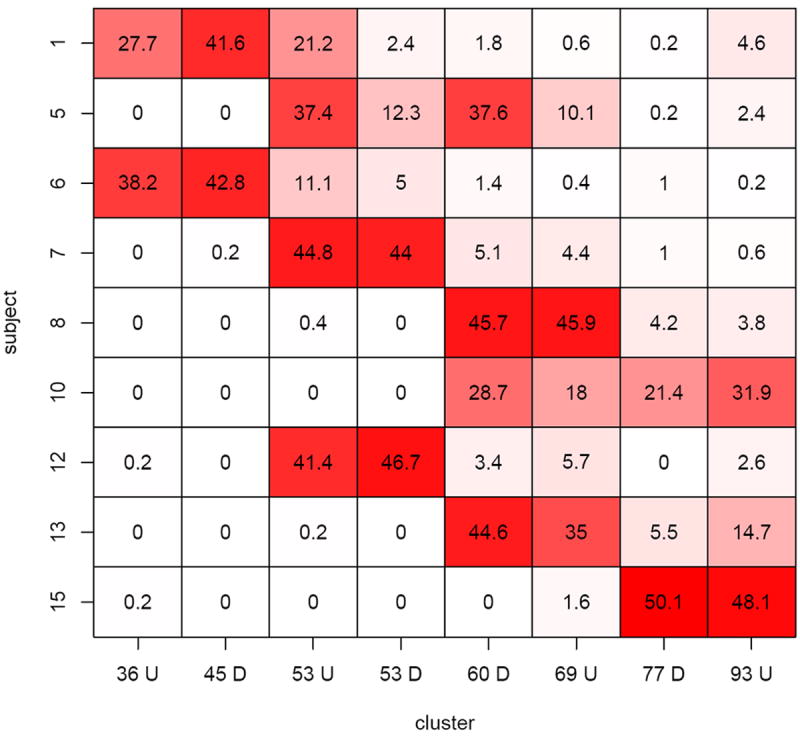
Distribution in percentages of the 505 common DRGs over the 8 clusters for 9 symptomatic subjects. The column indices are clusters, where the number refers to the peak time and the letter refers to either up-regulated or down-regulated patterns. For example, 36U means 36 hours peak up (cluster 1).
The differences (in particular the response times or peak times) in gene response patterns for different subjects may be associated with phenotype responses for influenza infection. To investigate the association, we correlated the peak times of the largest clusters or averaged peak times of the top two largest clusters of the common DRGs with the observed peak times of symptom scores and viral shedding, respectively. We found strong correlations between the gene expression peak times of the common DRGs and the clinical symptom peak times (r = 0.71, p = 0.03), and also between the gene expression peak times of the common DRGs and the observed viral shedding peak times (r = 0.86, p = 0.003) (see Figure 4). We also performed leave-one-out analysis and obtained an average change of 6.2% in the regression co-efficients for the regression between the gene expression peak times of the common DRGs and the clinical symptom peak times, and about 8.5% on average for the regression between the gene expression peak times of the common DRGs and the observed viral shedding peak times. This indicates that the correlations shown in Figure 4 are quite robust. In addition, we observed that the clinical symptom peak was delayed by one day (about 23 hours) on average for the 9 symptomatic subjects, compared to the gene response pattern peak of the common DRGs (see Figure 5). We also observed that the viral shedding peak time was almost the same as the gene response pattern peak, with only a 0.7 hour difference in the peak times on average for 9 symptomatic subjects (see Figure 5).
Fig. 4.
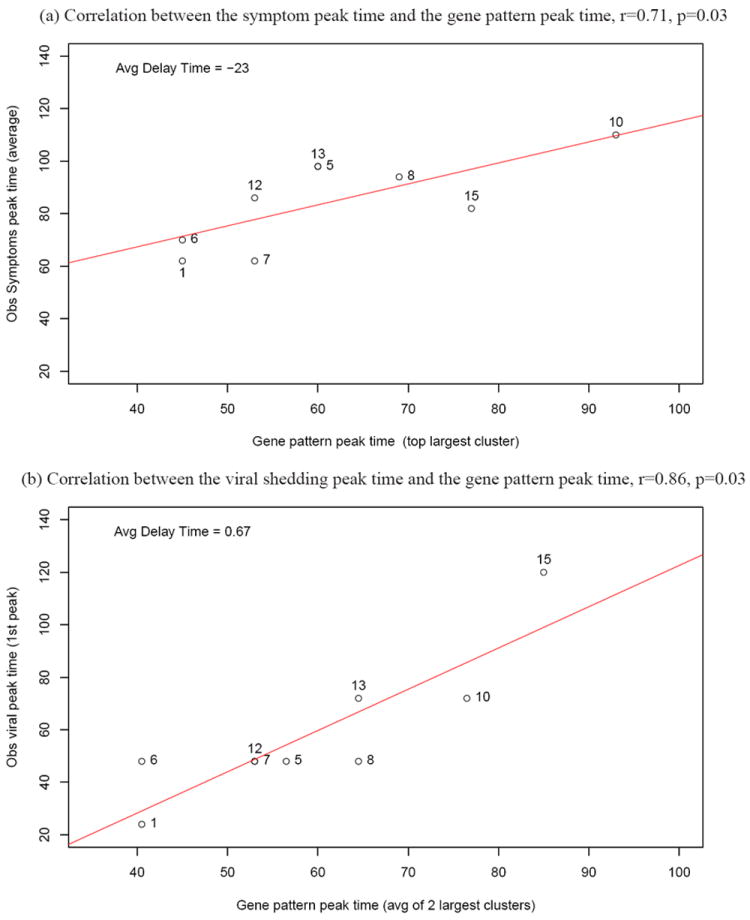
Correlations of the major common DRG response peak time with the symptom peak time and the viral shedding peak time for symptomatic subjects
Fig. 5.
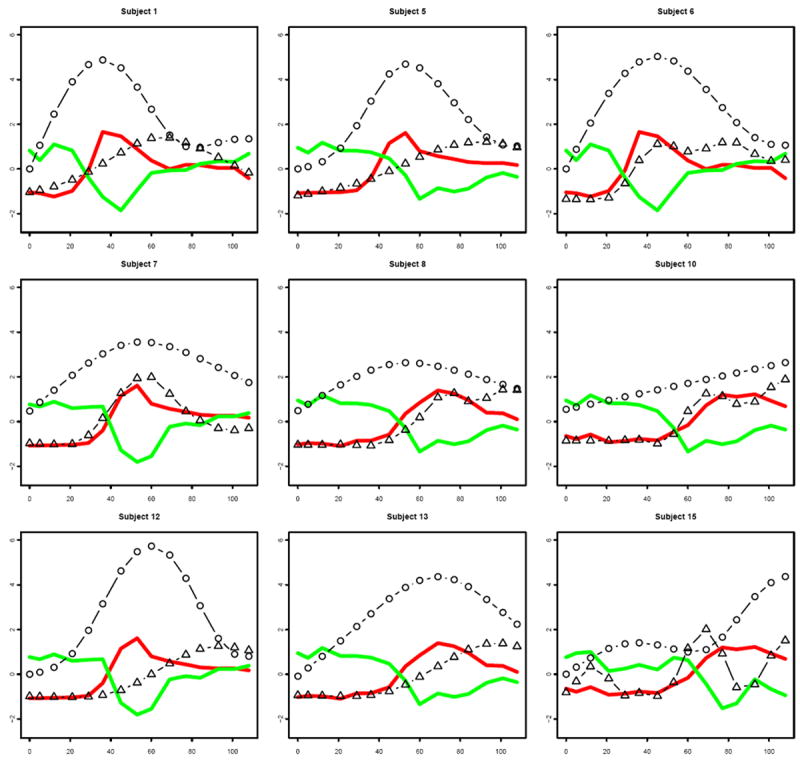
The mean response patterns of the top two largest clusters (green: downregulated; red: up-regulated), smoothed symptom score patterns (solid line with triangle) and viral shedding patterns (solid line with circle) for 9 symptomatic subjects from 0 to 108 hpi.
Dynamic gene response networks using the ODE modeling approach
We explored the dynamic response patterns of all the significant DRGs for each subject separately by grouping the time course expression profiles into different clusters (see Figure S3 in the electronic supplementary material). We then used the ODE modeling pipeline, described in the section of Materials and methods, to construct the cluster-based gene response network for each subject. The detailed model fitting results for individual subjects are presented in the electronic supplementary material (Figure S3 and Tables S1-S17). For Subject 4, who had no significant DRG identified at FDR = 0.05, we relaxed the FDR at 0.25 and obtained 17 significant DRGs so that we could also build a gene response network for this subject.
Table 2 and Table S18 summarize the network topological parameters for each individual subject. The same criterion was used to determine the number of clusters (nodes in the network) for each subject (see Materials and method section). We found that the numbers of clusters or nodes for symptomatic subjects were larger (ranging from 7 to 31) than those for asymptomatic subjects (ranging from 2 to 7), which is probably due to the fact that symptomatic subjects generally had more significant DRGs. The networks for the symptomatic subjects were more sparse. The number of VIN nodes is quite similar for the subjects in the two groups.
Table 2.
Summary of the network topological parameters for each subject. Columns 3-7 display the number of clusters, the number of viral interaction nodes (VIN, clusters with γk ≠ 0 in model (5)), the average shortest path length (AvSpl), the average number of neighbors (AvNeighbor), and the network density, respectively.
| Subject | Symptom | NodeCount | VINCount | AvSpl | AvNeighbor | density |
|---|---|---|---|---|---|---|
| 1 | Sx | 20 | 2 | 2.59 | 5.30 | 0.278 |
| 5 | Sx | 16 | 2 | 2.10 | 5.33 | 0.380 |
| 6 | Sx | 31 | 13 | 2.54 | 6.90 | 0.230 |
| 7 | Sx | 13 | 3 | 1.88 | 2.31 | 0.192 |
| 8 | Sx | 13 | 5 | 1.48 | 4.92 | 0.410 |
| 10 | Sx | 17 | 10 | 2.27 | 6.00 | 0.375 |
| 12 | Sx | 7 | 1 | 1.58 | 3.71 | 0.619 |
| 13 | Sx | 7 | 0 | 1.67 | 2.57 | 0.428 |
| 15 | Sx | 13 | 6 | 2.02 | 5.85 | 0.487 |
|
| ||||||
| 2 | ASx | 5 | 4 | 1.69 | 2.40 | 0.6 |
| 3 | ASx | 3 | 0 | 1.00 | 1.33 | 0.666 |
| 4 | ASx | 3 | 1 | 1.25 | 1.33 | 0.666 |
| 9 | ASx | 7 | 5 | 1.81 | 3.14 | 0.523 |
| 11 | ASx | 6 | 4 | 1.29 | 2.00 | 0.5 |
| 14 | ASx | 6 | 3 | 1.43 | 2.33 | 0.466 |
| 16 | ASx | 2 | 0 | 1.00 | 1.00 | 1.0 |
| 17 | ASx | 7 | 5 | 1.90 | 3.71 | 0.619 |
Discussion and conclusions
We reanalyzed the time course gene expression data from blood samples of human subjects, who were challenged with the live influenza A H3N2 virus [6-8], using a newly developed analysis pipeline [14] by considering the dynamic response feature from a system-approach perspective. This new dynamic systems approach results in new interesting findings which are different from the original analyses based on the gene expression data at each time point separately [6-8].
First we identified significant “dynamic response genes” (DRGs) for each individual subject independently using each gene’s time course data as its own control. We found that the numbers of DRGs for symptomatic subjects are significantly larger than those for asymptomatic subjects (p = 0.0001), which could be simply used to discriminate between the symptomatic subjects and asymptomatic subjects in this study. The symptomatic subjects had significantly higher viral shedding, which might require or stimulate stronger and sustained responses from more genes compared to the asymptomatic subjects during the whole experimental period.
The functional principle component analysis (FPCA) for each individual subject suggested a trend that some genes might have sharper and earlier responses for asymptomatic subjects compared to those for symptomatic subjects, which may allow us to predict the onset of symptoms early. We identified 19 early and quick response genes that could discriminate symptomatic subjects from asymptomatic subjects with only one or two subjects misclassified (Figure 1 and Figure S2). The two best discrimination genes (only one subject misclassified) are FGF9, which encodes fibroblast growth factor 9, and TLN1, which encodes a cytoskeletal protein Talin-1. Although immune cells in human blood do not express any fibroblast growth factor receptors [32], and no evidence shows that FGF9 gene has any function in the immune system, FGF9 plays a very important role in lung development, repair and regeneration [33-37]. Thus, the quicker up-regulation of FGF9 in asymptomatic subjects may result in a faster repair of lung injury in asymptomatic subjects than symptomatic ones.
TLN1 gene plays multiple crucial roles in the immune response. It mediates leukocytes’ entry into lymph nodes or infection sites [38-41] via activation of integrin LFA-1 [42, 43]. Moreover, Talin-1 stabilizes the immune synapses between immune cells and their target cells to facilitate TCR signaling [38, 44-46]. Furthermore, after receiving outside-in signal from LFA-1, Talin-1 can induce actin cytoskeleton reorganization and cytotoxic granule accumulation around immune synapses to kill infected cells [45, 46]. In asymptomatic subjects, the expression level of TLN1 was up-regulated faster than that in symptomatic subjects, so innate immune cells may migrate to the lungs faster and kill infected cells. Thus, virus infection may have been controlled in early time for the asymptomatic subjects. At the same time, adaptive immune cells in asymptomatic subjects might be able to migrate to lymph nodes more efficiently and get fully activated by antigen presenting cells (APCs). Those cells would provide optimal immune response at later time points. Therefore, Talin-1 and the related LFA-1/ICAM pathway may be a new possible target for drug design, i.e., Talin-1 or LFA-1/ICAM pathway agonist may be used as an immune booster during influenza infection, especially in the first several days after infection.
Among 9 symptomatic subjects, we identified 2622 to 5954 significant DRGs with an average of 4075 DRGs per subject, from which 505 DRGs are shared among all 9 subjects. Within these 505 common DRGs, roughly 50% had up-regulated temporal response patterns (the peaks were higher than the baselines) and 50% had down-regulated patterns (the peaks were lower than the baselines) for each subject. But different subjects responded and peaked at different times (ranging from 36 hours to 93 hours after virus inoculation). We annotated the common 505 DRGs for their functions and biological implications using DAVID bioinformatics resources [29] and found 14 gene families with enrichment scores greater than 1.3. The two most enriched annotation groups are the inflammatory and defense response with an enrichment score of 5.89, and the activation of the immune response with an enrichment score of 5.45. Other interesting annotation groups include ribosomal proteins, T-cell kinase, and myxovirus resistance. In particular, the most enriched gene families for the up-regulated gene clusters are influenza virus resistance and the DEAD box polypeptide groups with most significantly enriched functions related to innate immune response and IκB kinase/NF-κB signal transduction cascade. NF-κB pathway is involved in propagating the cellular response to inflammation. Other significant enriched functions for the up-regulated DRGs include inflammatory response and response to cytokine stimulus/production. For the late up-regulated gene cluster (peaked at 93 hours post virus inoculation), response to wounding is also highly enriched.
For the down-regulated gene clusters, enriched gene families are the ribosomal protein group and the T-cell kinase group with significantly enriched functions such as T cell receptor signaling pathway, kinase, atp-binding, cytosolic ribosome, and T cell activation and differentiation. One question is why the T cell response was down-regulated during this 5-day experimental period after viral inoculation. We speculate that this may be due to an artifact of microarray normalization. Since the innate immune response genes were highly up-regulated (up-regulated gene response patterns) during the experimental period, the T cell or other adaptive immune genes may have relatively low proportions although their absolute responses may still be higher than their baseline (time 0). Moreover, we found that these common DRG temporal patterns were strongly correlated with clinical symptom patterns (Figures 4 and 5). So these gene response patterns, similar to the viral shedding, could be used to predict the clinical symptoms one day before the onset of symptoms. But a larger population of test subjects is needed in order to validate this hypothesis.
We also noticed that 48 of the top 50 signature genes that were identified using the Bayesian factor analysis by Woods et al.[8] are among the 505 common DRGs identified from the symptomatic subjects using our time course (dynamic) systems approach. These 48 signature genes are all in the up-regulated patterns and are related to the innate immune response and IκB kinase/NF-κB signal transduction cascade. In addition, 21 of the top 50 signature genes associated with the secondary host response factor identified by Chen et al. [47] are also among our 505 common DRGs (the top 50 genes associated with the principal host response factor are the same as those identified by [8]). These secondary signature genes are associated with toll-like receptor signaling pathway, chemokine signaling pathway and cytokine-cytokine receptor interaction. These comparisons show that our new approach not only captured the most top signature genes discovered by the Bayesian factor analysis, but also identified additional genes that might also reflect other dynamic gene response features of symptomatic subjects. We also found that very few (only 0-40) of these common DRGs for symptomatic subjects (data not shown) were significant for most asymptomatic subjects (except Subjects 3 and 17), since most of the asymptomatic subjects had fewer significant DRGs. Even for Subjects 3 and 17, the two asymptomatic subjects that had similar numbers of significant DRGs to the symptomatic subjects (3094 and 3197 significant DRGs, respectively), only 126 and 134 (25%-27%) of these 505 common DRGs from symptomatic subjects were significant for these two subjects respectively. Thus, these 505 common DRGs may reflect an important common feature for symptomatic subjects, that may warrant further experimental investigation and validation.
Our method of determining DRGs treats each subject as his own control. Ideally, one should collect time course gene expression data for each subject before virus infection and then compare the gene expression patterns before and after infection to determine DRGs. However, due to difficulties such as budget limitation, there are usually very few data collected before virus infection. So in our hypothesis testing for DRGs, we compare the time course gene expression data of each gene to a flat line, which is estimated by the temporal mean of the gene expressions. Despite this limitation, we believe that it is still more powerful to detect significant temporal response genes using each subject as his own control than using other subjects as control, because the within-subject variation is generally much smaller than the between-subject variation. In this analysis, we find 505 common significant dynamic response genes among the symptomatic subjects, but it only accounts for 12% of total significant DRGs on average per subject. The majority of significant DRGs are different for different subjects. The heterogeneity in gene-level response to influenza infection suggests that different subjects may use different genes, possibly redundant genes, to perform similar functions to fight against viral infection.
The ODE network modeling results show that the asymptomatic subjects had fewer significant DRGs with fewer nodes, but denser connections compared to those of symptomatic subjects. Controllability analysis by [48] suggests that the dense network is easier to control than the sparse network. This may indicate that the gene response network for asymptomatic subjects is easier to be controlled back to the normal condition after viral infection. Our ODE modeling approach also allow us to identify the direct virus interaction nodes (VIN) in the host gene response network, which is also important to identify vaccine and antiviral drug targets. Since these networks are data-driven networks, i.e., we let the data determine whether there is an edge or not in the networks, more careful investigation is warranted in order to validate these network connections.
Supplementary Material
Acknowledgments
This work was supported by NIAID/NIH grants HHSN272201000055C (CBIM), HHSN27220201200005C (RPRC), HHSN266200700008C (NYICE), P30AI078498 (CFAR), and R01 AI087135. The authors would like to thank Drs. Martin Zand, Xing Qiu, Michelle Carey and other CBIM investigators for their helpful discussions and suggestions.
Footnotes
Electronic supplementary material The online version of this article contains supplementary material, which is available to authorized users.
References
- 1.Hong CY, Lin RT, Tan ES, Chong PN, Tan YS, Lew YJ, Loo LH. Acute respiratory symptoms in adults in general practice. Family Practice. 2004;21(3):317–323. doi: 10.1093/fampra/cmh319. URL http://fampra.oxfordjournals.org/content/21/3/317.abstract, http://fampra.oxfordjournals.org/content/21/3/317.full.pdf+html. [DOI] [PMC free article] [PubMed] [Google Scholar]
- 2.Johnstone J, Majumdar SR, Fox JD, Marrie TJ. Viral infection in adults hospitalized with community-acquired pneumonia: Prevalence, pathogens, and presentation. CHEST Journal. 2008;134(6):1141–1148. doi: 10.1378/chest.08-0888. URL +http://dx.doi.org/10.1378/chest.08-0888,/data/Journals/CHEST/22079/zcb01208001141.pdf. [DOI] [PMC free article] [PubMed] [Google Scholar]
- 3.Hall CB, Weinberg GA, Iwane MK, Blumkin AK, Edwards KM, Staat MA, Auinger P, Griffin MR, Poehling KA, Erdman D, Grijalva CG, Zhu Y, Szilagyi P. The burden of respiratory syncytial virus infection in young children. New England Journal of Medicine. 2009;360(6):588–598. doi: 10.1056/NEJMoa0804877. URL http://www.nejm.org/doi/full/10.1056/NEJMoa0804877, http://www.nejm.org/doi/pdf/10.1056/NEJMoa0804877. [DOI] [PMC free article] [PubMed] [Google Scholar]
- 4.Miller MA, Viboud C, Balinska M, Simonsen L. The signature features of influenza pandemics — implications for policy. New England Journal of Medicine. 2009;360(25):2595–2598. doi: 10.1056/NEJMp0903906. URL http://www.nejm.org/doi/full/10.1056/NEJMp0903906, http://www.nejm.org/doi/pdf/10.1056/NEJMp0903906. [DOI] [PubMed] [Google Scholar]
- 5.Ramilo O, Mejías A. Shifting the paradigm: Host gene signatures for diagnosis of infectious diseases. Cell Host & Microbe. 2009;6(3):199–200. doi: 10.1016/j.chom.2009.08.007. http://dx.doi.org/10.1016/j.chom.2009.08.007, URL http://www.sciencedirect.com/science/article/pii/S1931312809002868. [DOI] [PubMed] [Google Scholar]
- 6.Zaas AK, Chen M, Varkey J, Veldman T, H AO, III, Lucas J, Huang Y, Turner R, Gilbert A, Lambkin-Williams R, Øien NC, Nicholson B, Kingsmore S, Carin L, Woods CW, Ginsburg GS. Gene expression signatures diagnose influenza and other symptomatic respiratory viral infections in humans. Cell Host & Microbe. 2009;6(3):207–217. doi: 10.1016/j.chom.2009.07.006. http://dx.doi.org/10.1016/j.chom.2009.07.006, URL http://www.sciencedirect.com/science/article/pii/S1931312809002510. [DOI] [PMC free article] [PubMed] [Google Scholar]
- 7.Huang Y, Zaas AK, Rao A, Dobigeon N, Woolf PJ, Veldman T, Øien NC, McClain MT, Varkey JB, Nicholson B, Carin L, Kingsmore S, Woods CW, Ginsburg GS, Hero AO., III Temporal dynamics of host molecular responses differentiate symptomatic and asymptomatic influenza a infection. PLoS Genet. 2011;7(8):e1002,234. doi: 10.1371/journal.pgen.1002234. URL http://dx.doi.org/10.1371%2Fjournal.pgen.1002234. [DOI] [PMC free article] [PubMed] [Google Scholar]
- 8.Woods CW, McClain MT, Chen M, Zaas AK, Nicholson BP, Varkey J, Veldman T, Kingsmore SF, Huang Y, Lambkin-Williams R, Gilbert AG, Hero AO, Ramsburg E, Glickman S, Lucas JE, Carin L, Ginsburg GS. A host transcriptional signature for presymptomatic detection of infection in humans exposed to influenza h1n1 or h3n2. PLoS ONE. 2013;8(1) doi: 10.1371/journal.pone.0052198. URL http://dx.doi.org/10.1371/journal.pone.0052198. [DOI] [PMC free article] [PubMed] [Google Scholar]
- 9.Carvalho CM, Chang J, Lucas JE, Nevins JR, Wang Q, West M. High-dimensional sparse factor modeling: Applications in gene expression genomics. Journal of the American Statistical Association. 2008;103(484):1438–1456. doi: 10.1198/016214508000000869. URL http://www.tandfonline.com/doi/abs/10.1198/016214508000000869, http://www.tandfonline.com/doi/pdf/10.1198/016214508000000869. [DOI] [PMC free article] [PubMed] [Google Scholar]
- 10.Dobigeon N, Moussaoui S, Coulon M, Tourneret JY, Hero A. Joint bayesian endmember extraction and linear unmixing for hyperspectral imagery. Signal Processing, IEEE Transactions on. 2009;57(11):4355–4368. doi: 10.1109/TSP.2009.2025797. [DOI] [Google Scholar]
- 11.Chen B, Chen M, Paisley J, Zaas A, Woods C, Ginsburg G, Hero A, Lucas J, Dunson D, Carin L. Bayesian inference of the number of factors in gene-expression analysis: application to human virus challenge studies. BMC Bioinformatics. 2010;11(1):552. doi: 10.1186/1471-2105-11-552. URL http://www.biomedcentral.com/1471-2105/11/552. [DOI] [PMC free article] [PubMed] [Google Scholar]
- 12.Zaslavsky E, Nudelman G, Marquez S, Hershberg U, Hartmann B, Thakar J, Sealfon S, Klein-stein S. Reconstruction of regulatory networks through temporal enrichment profiling and its application to h1n1 influenza viral infection. BMC Bioinformatics. 2013;14(Suppl 6):S1. doi: 10.1186/1471-2105-14-S6-S1. URL http://www.biomedcentral.com/1471-2105/14/S6/S1. [DOI] [PMC free article] [PubMed] [Google Scholar]
- 13.Wu S, Wu H. More powerful significant testing for time course gene expression data using functional principal component analysis approaches. BMC Bioinformatics. 2013;14:6. doi: 10.1186/1471-2105-14-6. [DOI] [PMC free article] [PubMed] [Google Scholar]
- 14.Wu S, Liu ZP, Qiu X, Wu H. High-dimensional ordinary differential equation models for reconstructing genome-wide dynamic regulatory networks. In: Hu M, Liu Y, Lin J, editors. Topics in Applied Statistics, Springer Proceedings in Mathematics & Statistics. 55, chap 15. Springer; New York: 2013. pp. 173–190. [Google Scholar]
- 15.Yao F, Müller HG, Wang JL. Functional data analysis for sparse longitudinal data. Journal of the American Statistical Association. 2005;100(470):577–590. [Google Scholar]
- 16.Benjamini Y, Hochberg Y. Controlling the false discovery rate: a practical and powerful approach to multiple testing. Journal of the Royal Statistical Society: Series B (Statistical Methodology) 1995;57:289–300. [Google Scholar]
- 17.Eisen M, Spellman P, Brown P, Botstein D. Cluster analysis and display of genome-wide expression patterns. Proceedings of the National Academy of Sciences of the United States of America. 1998;95:14,863–14,868. doi: 10.1073/pnas.95.25.14863. [DOI] [PMC free article] [PubMed] [Google Scholar]
- 18.Hartigan J, Wong M. Algorithm AS 136: A K-means clustering algorithm. Journal of the Royal Statistical Society: Series C (Applied Statistics) 1979;28:100–108. [Google Scholar]
- 19.Milligan G, Cooper M. An examination of procedures for determining the number of clusters in a data set. Psychometrika. 1985;50:159–179. [Google Scholar]
- 20.Wu H, Zhang JT. Nonparametric regression methods for longitudinal data analysis. Wiley; New York: 2005. [Google Scholar]
- 21.Liang H, Wu H. Parameter estimation for differential equation models using a framework of measurement error in regression models. Journal of the American Statistical Association. 2008;103:1570–1583. doi: 10.1198/016214508000000797. [DOI] [PMC free article] [PubMed] [Google Scholar]
- 22.Fan J, Li R. Variable selection via nonconcave penalized likelihood and its oracle properties. Journal of the American Statistical Association. 2001;96:1348–1360. [Google Scholar]
- 23.D’haeseleer P, Wen X, Fuhrman S, Somogyi R. Linear modeling of mRNA expression levels during CNS development and injury. Pacific Symposium on Biocomputing; 1999. pp. 41–52. [DOI] [PubMed] [Google Scholar]
- 24.Bansal M, Gatta GD, di Bernardo D. Inference of gene regulatory networks and compound mode of action from time course gene expression profiles. Bioinformatics. 2006;22(7):815–822. doi: 10.1093/bioinformatics/btl003. [DOI] [PubMed] [Google Scholar]
- 25.Lu T, Liang H, Li H, Wu H. High dimensional ODEs coupled with mixedeffects modeling techniques for dynamic gene regulatory network identification. Journal of the American Statistical Association. 2011;106:1242–1258. doi: 10.1198/jasa.2011.ap10194. [DOI] [PMC free article] [PubMed] [Google Scholar]
- 26.Hastie T, Tibshirani R, Friedman J. The elements of statistical learning: data mining, inference and prediction. 2. Springer; 2008. URL http://scholar.google.com/scholar.bib?q=info:roqIsr0iT4UJ:scholar.google.com/&output=citation&hl=en&ct=citation&cd=0. [Google Scholar]
- 27.McLeod A, Xu C. bestglm: Best Subset GLM. r package version 0.33. 2011 URL http://CRAN.R-project.org/package=bestglm.
- 28.Xue H, Miao H, Wu H. Sieve estimation of constant and time-varying coefficients in nonlinear ordinary differential equation models by considering both numerical error and measurement error. The Annals of Statistics. 2010;38:2351–2387. doi: 10.1214/09-aos784. [DOI] [PMC free article] [PubMed] [Google Scholar]
- 29.Huang D, Sherman B, Lempicki R. Systematic and integrative analysis of large gene lists using david bioinformatics resources. Nature Protocols. 2009;4:44–57. doi: 10.1038/nprot.2008.211. [DOI] [PubMed] [Google Scholar]
- 30.Cline Melissa S, C E, K A, L N, W C, C R, AC I, C M, G B, Smoot Michael. [2014.02.19];Integration of biological networks and gene expression data using cytoscape. 2007 doi: 10.1038/nprot.2007.324. URL http://www.nature.com/nprot/journal/v2/n10/full/nprot.2007.324.html. [DOI] [PMC free article] [PubMed]
- 31.Smoot ME, Ono K, Ruscheinski J, Wang PL, Ideker T. Cytoscape 2.8: new features for data integration and network visualization. Bioinformatics. 2011;27(3):431–432. doi: 10.1093/bioinformatics/btq675. URL http://bioinformatics.oxfordjournals.org/content/27/3/431.abstract, http://bioinformatics.oxfordjournals.org/content/27/3/431.full.pdf+html. [DOI] [PMC free article] [PubMed] [Google Scholar]
- 32.Su AI, Wiltshire T, Batalov S, Lapp H, Ching KA, Block D, Zhang J, Soden R, Hayakawa M, Kreiman G, Cooke MP, Walker JR, Hogenesch JB. A gene atlas of the mouse and human protein-encoding transcriptomes. Proceedings of the National Academy of Sciences of the United States of America. 2004;101(16):6062–6067. doi: 10.1073/pnas.0400782101. URL http://www.pnas.org/content/101/16/6062.abstract, http://www.pnas.org/content/101/16/6062.full.pdf+html. [DOI] [PMC free article] [PubMed] [Google Scholar]
- 33.del Moral PM, De Langhe SP, Sala FG, Veltmaat JM, Tefft D, Wang K, Warburton D, Bellusci S. Differential role of FGF9 on epithelium and mesenchyme in mouse embryonic lung. Developmental biology. 2006;293(1):77–89. doi: 10.1016/j.ydbio.2006.01.020. URL http://www.ncbi.nlm.nih.gov/pubmed/16494859. [DOI] [PubMed] [Google Scholar]
- 34.Okada K, Noda M, Nogawa H. Autocrine growth factors are involved in branching morphogenesis of mouse lung epithelium. Zoological science. 2013;30(1):1–6. doi: 10.2108/zsj.30.1. URL http://www.ncbi.nlm.nih.gov/pubmed/23317359. [DOI] [PubMed] [Google Scholar]
- 35.Warburton D, Perin L, Defilippo R, Bellusci S, Shi W, Driscoll B. Stem/progenitor cells in lung development, injury repair, and regeneration. Proceedings of the American Thoracic Society. 2008;5(6):703–6. doi: 10.1513/pats.200801-012AW. URL http://www.pubmedcentral.nih.gov/articlerender.fcgi?artid=2645263&tool=pmcentrez&rendertype=abstract. [DOI] [PMC free article] [PubMed] [Google Scholar]
- 36.White AC, Lavine KJ, Ornitz DM. FGF9 and SHH regulate mesenchymal Vegfa expression and development of the pulmonary capillary network. Development (Cambridge, England) 2007;134(20):3743–52. doi: 10.1242/dev.004879. URL http://www.pubmedcentral.nih.gov/articlerender.fcgi?artid=2099314&tool=pmcentrez&rendertype=abstract. [DOI] [PMC free article] [PubMed] [Google Scholar]
- 37.Yin Y, Wang F, Ornitz DM. Mesothelial- and epithelial-derived FGF9 have distinct functions in the regulation of lung development. Development (Cambridge, England) 2011;138(15):3169–77. doi: 10.1242/dev.065110. URL http://www.pubmedcentral.nih.gov/articlerender.fcgi?artid=3188607&tool=pmcentrez&rendertype=abstract. [DOI] [PMC free article] [PubMed] [Google Scholar]
- 38.Wernimont SA, Wiemer AJ, Bennin DA, Monkley SJ, Ludwig T, Critchley DR, Huttenlocher A. Contact-dependent t cell activation and t cell stopping require talin1. The Journal of Immunology. 2011;187(12):6256–6267. doi: 10.4049/jimmunol.1102028. URL http://www.jimmunol.org/content/187/12/6256.abstract, http://www.jimmunol.org/content/187/12/6256.full.pdf+html. [DOI] [PMC free article] [PubMed] [Google Scholar]
- 39.Manevich-Mendelson E, Grabovsky V, Feigelson SW, Cinamon G, Gore Y, Goverse G, Monkley SJ, Margalit R, Melamed D, Mebius RE, Critchley DR, Shachar I, Alon R. Talin1 is required for integrin-dependent b lymphocyte homing to lymph nodes and the bone marrow but not for follicular b-cell maturation in the spleen. Blood. 2010;116(26):5907–5918. doi: 10.1182/blood-2010-06-293506. URL http://bloodjournal.hematologylibrary.org/content/116/26/5907.abstract, http://bloodjournal.hematologylibrary.org/content/116/26/5907.full.pdf+html. [DOI] [PubMed] [Google Scholar]
- 40.Lefort CT, Rossaint J, Moser M, Petrich BG, Zarbock A, Monkley SJ, Critchley DR, Ginsberg MH, Fässler R, Ley K. Distinct roles for talin-1 and kindlin-3 in lfa-1 extension and affinity regulation. Blood. 2012;119(18):4275–4282. doi: 10.1182/blood-2011-08-373118. URL http://bloodjournal.hematologylibrary.org/content/119/18/4275.abstract, http://bloodjournal.hematologylibrary.org/content/119/18/4275.full.pdf+html. [DOI] [PMC free article] [PubMed] [Google Scholar]
- 41.Lämmermann T, Bader BL, Monkley SJ, Worbs T, Wedlich-Söldner R, Hirsch K, Keller M, Forster R, Critchley DR, Fassler R, Sixt M. Rapid leukocyte migration by integrin-independent flowing and squeezing. Nature. 2008;453:51–55. doi: 10.1038/nature06887. [DOI] [PubMed] [Google Scholar]
- 42.Petrich BG. Talin-dependent integrin signalling in vivo. Thrombosis and Haemostasis. 2009;101(6):1020–1024. URL http://dx.doi.org/10.1160/TH08-08-0553. [PubMed] [Google Scholar]
- 43.Calderwood DA, Campbell ID, Critchley DR. Talins and kindlins: partners in integrin-mediated adhesion. Nature Reviews Molecular Cell Biology. 2013;14:503–517. doi: 10.1038/nrm3624. [DOI] [PMC free article] [PubMed] [Google Scholar]
- 44.Simonson WTN, Franco SJ, Huttenlocher A. Talin1 regulates tcr-mediated lfa-1 function. The Journal of Immunology. 2006;177(11):7707–7714. doi: 10.4049/jimmunol.177.11.7707. URL http://www.jimmunol.org/content/177/11/7707.abstract, http://www.jimmunol.org/content/177/11/7707.full.pdf+html. [DOI] [PubMed] [Google Scholar]
- 45.Mace EM, Monkley SJ, Critchley DR, Takei F. A dual role for talin in nk cell cytotoxicity: Activation of lfa-1-mediated cell adhesion and polarization of nk cells. The Journal of Immunology. 2009;182(2):948–956. doi: 10.4049/jimmunol.182.2.948. URL http://www.jimmunol.org/content/182/2/948.abstract, http://www.jimmunol.org/content/182/2/948.full.pdf+html. [DOI] [PubMed] [Google Scholar]
- 46.Mace EM, Zhang J, Siminovitch KA, Takei F. Elucidation of the integrin lfa-1?mediated signaling pathway of actin polarization in natural killer cells. Blood. 2010;116(8):1272–1279. doi: 10.1182/blood-2009-12-261487. URL http://bloodjournal.hematologylibrary.org/content/116/8/1272.abstract, http://bloodjournal.hematologylibrary.org/content/116/8/1272.full.pdf+html. [DOI] [PubMed] [Google Scholar]
- 47.Chen M, Zaas A, Woods C, Ginsburg G, Lucas J, Dunson D, Carin L. Predicting viral infection from high-dimensional biomarker trajectories. Journal of the American Statistical Association. 2011;106:1259–1279. doi: 10.1198/jasa.2011.ap10611. [DOI] [PMC free article] [PubMed] [Google Scholar]
- 48.Liu YY, Slotine JJ, Barabasi AL. Controllability of complex networks. Nature. 2011;473:167–173. doi: 10.1038/nature10011. [DOI] [PubMed] [Google Scholar]
Associated Data
This section collects any data citations, data availability statements, or supplementary materials included in this article.