

Abstract
Objectives
To identify genetic associations with hip osteoarthritis (HOA), we performed a meta-analysis of genome-wide association studies (GWAS) of HOA.
Methods
The GWAS meta-analysis included approximately 2.5 million imputed HapMap single nucleotide polymorphisms (SNPs). HOA cases and controls defined radiographically and by total hip replacement were selected from the Osteoporotic Fractures in Men (MrOS) Study and the Study of Osteoporotic Fractures (SOF) (654 cases and 4697 controls, combined). Replication of genome-wide significant SNP associations (P-value ≤ 5x10⁻⁸) was examined in five studies (3243 cases and 6891 controls, combined). Functional studies were performed using in vitro models of chondrogenesis and osteogenesis.
Results
The A allele of rs788748, located 65 kb upstream of the IGFBP3 gene, was associated with lower HOA odds at the genome-wide significance level in the discovery stage (OR = 0.71, P-value = 2x10⁻⁸). The association replicated in five studies (OR = 0.92, P-value = 0.020), but the joint analysis of discovery and replication results was not genome-wide significant (P-value = 1x10⁻⁶). In separate study populations, the rs788748 A allele was also associated with lower circulating IGFBP3 protein levels (P-value = 4x10⁻¹³), suggesting that this SNP or a variant in linkage disequilibrium (LD) could be an IGFBP3 regulatory variant. Results from functional studies were consistent with association results. Chondrocyte hypertrophy, a deleterious event in OA pathogenesis, was largely prevented upon IGFBP3 knockdown in chondrocytes. Furthermore, IGFBP3 overexpression induced cartilage catabolism and osteogenic differentiation.
Conclusions
Results from GWAS and functional studies provided suggestive links between IGFBP3 and HOA.
Keywords: Osteoarthritis of hip, genome-wide association study, functional study, chondrogenesis, IGFBP3
INTRODUCTION
Hip osteoarthritis (HOA) is one of the most common forms of arthritis, with nearly 10% of individuals over the age of 70 suffering from this disease [1]. The degeneration of the hip joint that occurs with osteoarthritis (OA) is characterized by a loss of articular cartilage, an increase in new bone formation at the margins of the bones, and remodeling of the bone that is adjacent to the joint [2]. HOA is associated with pain and disability that often results in total joint replacement [3]. Currently, there are no available treatments that can alter the course of this disease.
Genetic and environmental factors contribute to HOA pathogenesis, and the heritability of HOA in women has been reported to be as high as 60% [4]. A number of genome-wide significant (P-value ≤ 5x10⁻⁸) single nucleotide polymorphism (SNP) associations with HOA and related traits have been identified. Variants at the GDF5 locus and MCF2L locus have been associated with OA of the hip and knee [5–8]. DOT1L SNPs have been associated with cartilage thickness and hip osteoarthritis [9, 10], and SNPs near the gene NCOA3 have been associated with HOA [11]. A recent genome-wide association study (GWAS) of OA that included 24 sub-phenotypes identified five genome-wide significant (GWS) associations [12].
It has been previously noted that heterogeneity of radiographic HOA classification could hinder the identification of genetic risk factors [13]. OA is typically defined using a summary grade score, such as the Kellgren and Lawrence (K/L) score [14] or the Croft score [15], but for a given summary grade score, the radiographic features can vary between studies [13]. In order to minimize phenotype heterogeneity, we selected a total of 654 HOA cases and 4697 HOA controls from two studies, the Osteoporotic Fractures in Men (MrOS) Study and the Study of Osteoporotic Fractures (SOF), that applied the same radiographic scoring methods by a common set of radiograph readers, and we performed a GWAS meta-analysis of HOA. GWS SNP associations were examined for replication in a total of 3243 cases and 6891 controls from five case-control studies. To link HOA-associated SNPs with a potential target gene, we examined whether significantly associated SNPs near IGFBP3 were associated with circulating IGFBP3 through a look-up of results from a GWAS meta-analysis of circulating IGFBP3 [16]. The biological role of the candidate gene IGFBP3 was evaluated through functional studies using model systems of chondrogenesis and osteogenesis.
METHODS
Study populations and case control definitions
In the MrOS and SOF studies, HOA cases were defined using a modified Croft grade score ≥ 2 on either hip or THR [2]. HOA controls were those without THR and meeting the following three criteria on both hips: Croft grade ≤ 1, joint space narrowing (JSN) ≤ 1, and osteophytes ≤ 1. GWS SNP associations were examined for replication using case-control status defined by K/L scores or THR in the Rotterdam study (RS-I and RS-II) and Chingford study, and by THR in the Genetics of Osteoarthritis and Lifestyle (GOAL) study and the Nottingham Study. See online supplementary text for details regarding study descriptions and case-control definitions. All studies were approved by their respective institutional review boards and informed consent was obtained from all participants involved.
Genotyping and statistical analysis
Genome-wide SNPs were genotyped in samples from the MrOS and SOF studies using the Illumina Human Omni1 Quad array. Quality control procedures for SNPs and samples are described in online supplementary Table S1. Principal component analysis was performed to detect evidence for population structure and to generate principal components used to adjust for genetic ancestry [17]. Genotypes were imputed using the HapMap phase II release 22 reference panel using MACH [18]. SNP associations were estimated using logistic regression models adjusted for the effects of age, sex (if applicable), study site (if applicable), and principal components. Genomic control was applied to results from MrOS and SOF, and fixed-effect meta-analysis with inverse variance weights was performed using METAL [19]. The two discovery studies and five replication studies were included in the joint meta-analysis as individual studies. Details regarding genotyping and statistical analysis in discovery and replication studies are presented in online supplementary Table S1 and Text S1.
Cell Culture experiments
Functional studies of chondrogenesis and osteogenesis were performed using the ATDC5 and MC3T3 cell lines, respectively. The ATDC5 cell line exhibits multi-stage chondrogenic differentiation similar to the process that is observed during chondrogenesis and endochondral bone formation [20]. Human articular chondrocytes, isolated from OA patients as previously described [21], were also used in functional studies. Gene knockdown was performed by stable transfection with plasmid overexpressing shmiRNA directed against IGFBP3. Further details are presented in online supplementary Text S1.
RESULTS
Characteristics of the study samples
Average age was significantly higher in MrOS participants (100% male) than SOF participants (100% female). Age and mJSW differed by case-control status in MrOS and SOF, but height and BMI did not (online supplementary Table S2).
Locus associated with hip osteoarthritis
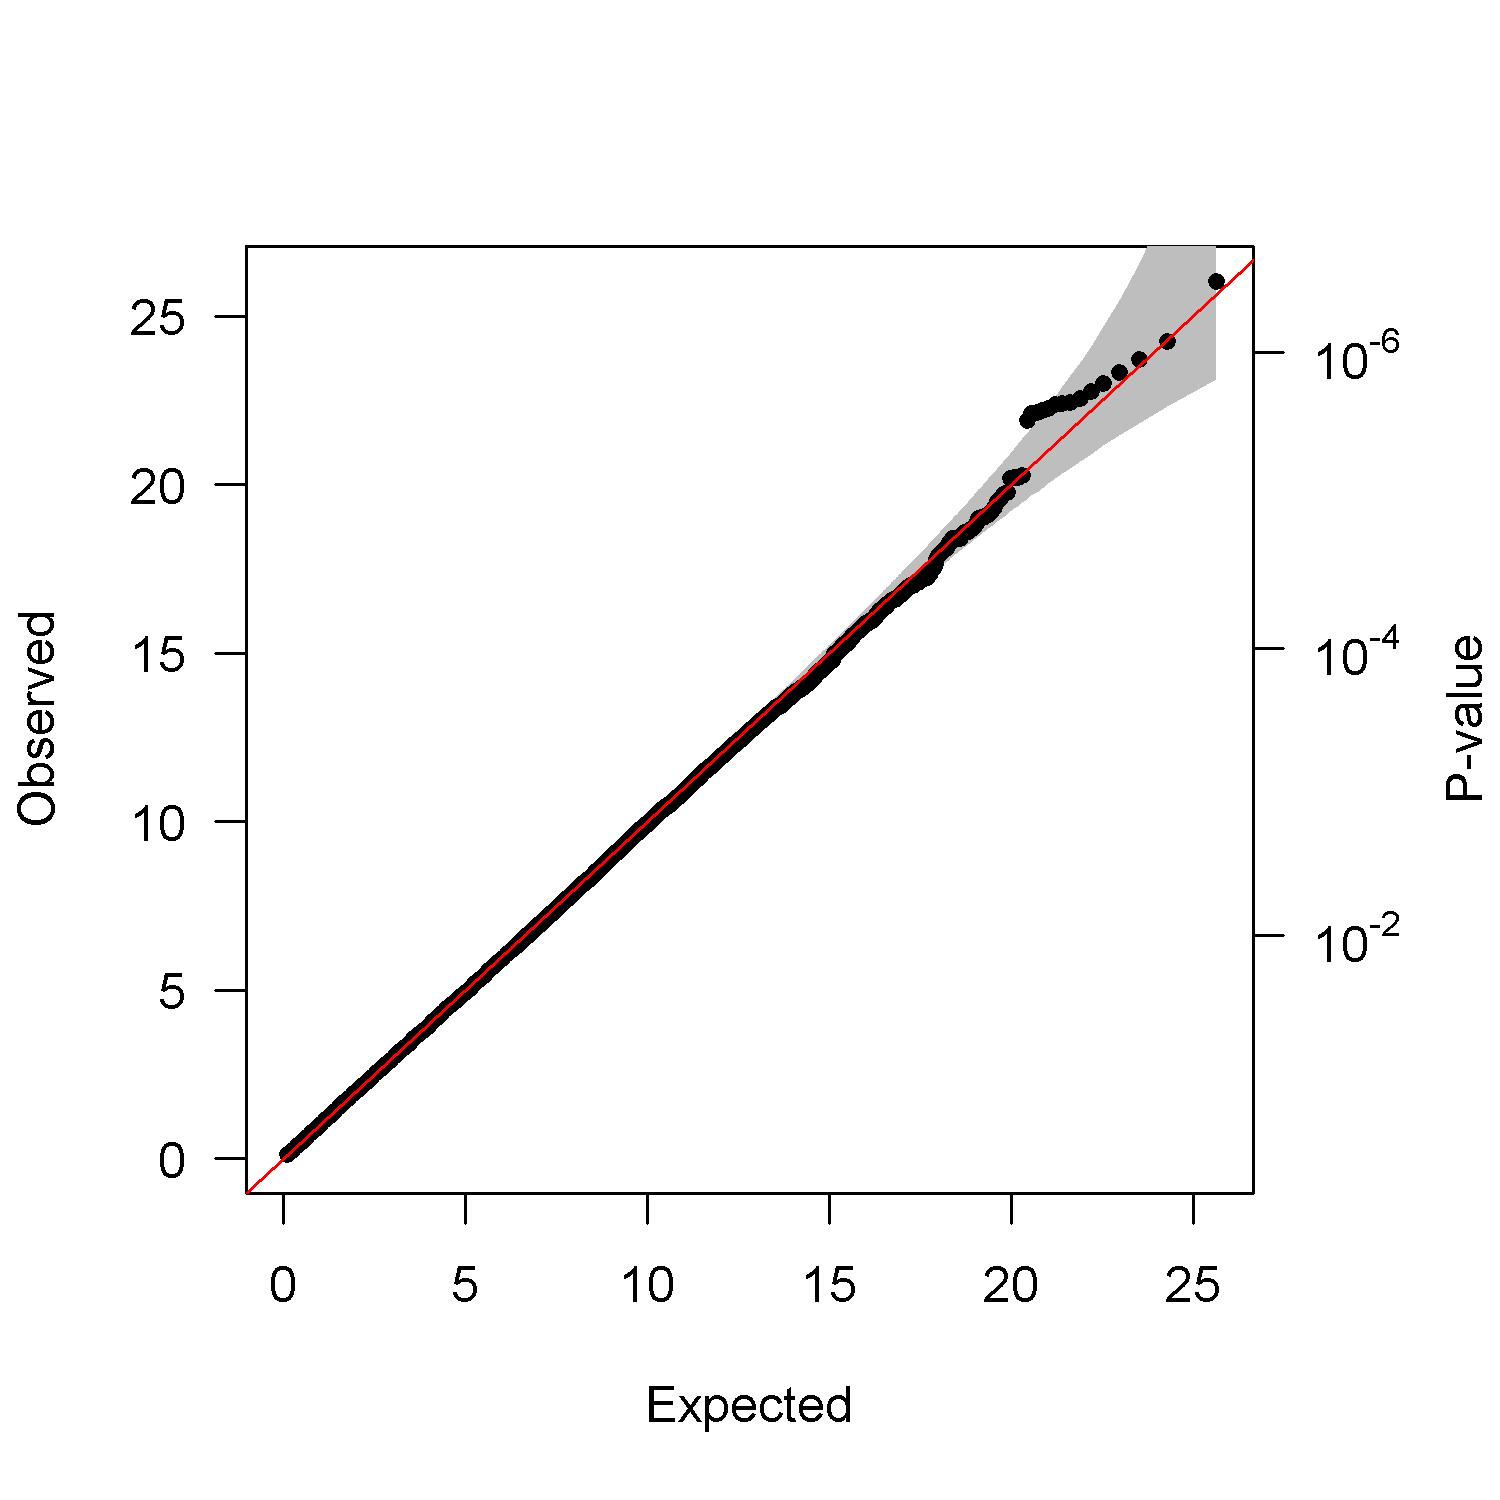
A GWAS of HOA was performed with 2,459,845 genotyped and imputed SNPs that passed quality control. There was little to no evidence of P-value inflation in the individual studies (MrOS λ = 1.01, SOF λ = 1.01) or the meta-analysis (λ = 1.00) (online supplementary Figures S1–S3). GWS SNPs were located at a single locus on chromosome 7 (online supplementary Figure S4). The two GWS SNPs, rs788748 and rs879966, were directly genotyped in both cohorts, were in moderate linkage disequilibrium (LD) (HapMap CEU r2 = 0.54), and the effect alleles were associated with decreased odds of HOA (Table 1 and Figure 1). The nearest gene was IGFBP3 (Figure 1). In conditional analysis, the HOA association P-values were not significant for rs788748 and rs879966 (P-value ≥ 0.05), indicating a strong degree of dependence.
Table 1.
SNP association results in discovery and replication studies.
| rs788748
|
rs879966
|
||||
|---|---|---|---|---|---|
| Chr 7: 45,992,706 * A (0.49) † |
Chr 7: 46,015,992 * G (0.39) † |
||||
|
|
|
||||
| cases/controls | OR (95% CI) | P-value | OR (95% CI) | P-value | |
|
|
|
||||
| MrOS | 411 / 2512 | 0.68 (0.58 – 0.79) | 7x10⁻⁷ | 0.67 (0.57 – 0.78) | 8x10⁻⁷ |
| SOF | 243 / 2185 | 0.76 (0.63 – 0.92) | 5x10⁻³ | 0.74 (0.61 – 0.91) | 4x10⁻³ |
| Meta-analysis | 654 / 4697 | 0.71 (0.63 – 0.80) | 2x10⁻⁸ | 0.70 (0.61 – 0.79) | 1x10⁻⁸ |
|
|
|
||||
| Replication | cases/controls | OR (95% CI) | P-value | OR (95% CI) | P-value |
|
|
|
||||
| GOAL | 1291 / 783 | 0.85 (0.75 – 0.97) | 0.01 | ND | ND |
| Nottingham | 1258 / 758 | 1.01 (0.89 – 1.16) | 0.83 | ND | ND |
| RS-I | 462 / 3428 | 0.86 (0.74 – 0.99) | 0.03 | 0.92 (0.79 – 1.06) | 0.24 |
| RS-II | 149 / 1430 | 0.98 (0.75 – 1.28) | 0.88 | 1.09 (0.83 – 1.44) | 0.54 |
| Chingford | 83 / 492 | 1.11 (0.79 – 1.56) | 0.54 | 1.00 (0.72 – 1.40) | 0.99 |
| Meta-analysis replication | 3243 / 6891 | 0.92 (0.86 – 0.99) | 0.02 | 0.96 (0.85 – 1.08) | 0.48 |
NCBI build 36 chromosome and position
Effect allele (effect allele frequency)
ND = Not determined.
Figure 1. Regional HOA association plot of IGFBP3 locus.

Association P-values plotted against genomic location. Negative log base 10 of the association P-value is shown on the left-hand Y-axis. HapMap-based recombination rate is shown on the right-hand Y-axis and is depicted using light blue peaks. Genomic location on chromosome 7 in megabases is shown on the X-axis. Dashed line marks the genome-wide significance threshold. HapMap CEU LD (r2) relative to the index SNP, rs788748, is shown using filled colors according to the legend. RefSeq genes shown in bottom panel.
Our discovery stage had sufficient power (≥ 0.8) at α = 5x10⁻⁸ to detect OR of 0.68 for SNPs with MAF of 0.5. As sufficient power was nearly achieved to detect the observed rs788748 OR, the winner’s curse [22] adjusted [23] rs788748 OR of 0.75 was similar to the observed OR of 0.71.
Genetic variants in components of the growth hormone/insulin-like growth factor (GH/IGF) axis, which includes IGFBP3, have been associated with human height [24], and genetic associations are shared between OA and height [25]. Rs788748 and rs879966 were in low LD (1000 Genomes phase 1 CEU r2 = 0.09 and 0.16, respectively) with a functional IGFBP3 promoter polymorphism (−202 A/C, rs2854744) [26] associated with GH-dependent growth [27], and adjustment for height or BMI had a minimal effect on rs788748 and rs879966 HOA associations (online supplementary Table S3), indicating that height is unlikely to mediate the SNP associations.
The two GWS SNP associations were examined for replication in five HOA case-control studies (online supplementary tables S4 and S5). In the meta-analysis of replication results, the rs788748 HOA association was significant and in the same direction as the discovery stage (P-value = 0.020), with little evidence for heterogeneity (Q test P-value = 0.20, I2 = 36.67) (Table 1, Figure 2). The rs879966 genotyping assay failed in the two largest replication studies, GOAL and Nottingham, and not surprisingly, it was not significantly associated with HOA among the replication studies (Table 1). In a joint meta-analysis of discovery and replication stage results, the rs788748 OR (95% CI) was 0.86 (0.81 – 0.91) and the P-value was 1x10⁻⁶.
Figure 2. Forest plot of rs788748 HOA association.

Point sizes are proportional to the inverse variance weights, and 95% confidence intervals are shown. Within discovery and replication stages, studies are ordered by the number of cases.
Previously reported SNP associations with OA at rs11177/rs6976 near GNL3/GLT8D1 [12], rs10948172 near SUPT3H and RUNX2 [12], rs11842874 in MCF2L [8], rs12982744 in DOT1L [9, 10], and rs6094710 near NCOA3 [11] were significantly associated (P-value ≤ 0.05) with HOA in study-specific or meta-analysis results, but the direction of effect did not replicate for rs11842874 or rs6094710 (online supplementary Table S6).
Characterization of associated SNPs
ENCODE project data indicated that histone modifications typically associated with enhancers (Histone-3 Lysine-4 mono-methylation and Histone-3 Lysine-27 acetylation) [28] were located near rs788748 and rs879966. In addition, transcription factor binding sites identified using ChIP-Seq and DNase I hypersensitivity sites were located near rs788748 (online supplementary Figure S5).
A GWAS meta-analysis of circulating IGFBP3 and IGF-I levels reported an association region that spanned rs788748 and rs879966, but the association estimates for these two SNPs were not reported [16]. A look-up of the associations for these SNPs revealed that the rs788748 and rs879966 alleles associated with lower odds of HOA were significantly associated with lower circulating IGFBP3 but not circulating IGF-I (R. Kaplan, personal communication) (Table 2). The two reported independent SNPs most significantly associated with circulating IGFBP3 (rs11977526 and rs700752) [16] were not significantly associated with HOA (online supplementary Table S7). Based on HapMap CEU genotypes, rs788748 was in low LD with rs11977526 (r2=0.05), rs700752 (r2=0.04), and a potentially causal SNP related to IGFBP3 levels, rs2854746 (r2=0.05) [29].
Table 2.
SNP association with circulating IGFBP3.
| SNP | EA (Freq) | IGFBP3
|
IGF-I
|
||||
|---|---|---|---|---|---|---|---|
| P-valueGC | Effect Direction* | I2 | P-valueGC | Effect Direction* | I2 | ||
|
|
|
|
|||||
| rs788748 | A (0.49) | 6x10⁻¹³ | ---- | 61.3 | 0.82 | --+- | 0.0 |
| rs879966 | G (0.40) | 4x10⁻⁵ | ---- | 56.2 | 0.80 | -++- | 0.0 |
EA = Effect allele. rs788748 was genotyped in CHS, KORA, and SHIP and imputed in FHS (imputation accuracy = 1.0). rs879966 was genotyped in CHS and imputed in FHS, KORA, and SHIP (imputation accuracy = 0.98, 0.99, and 0.99, respectively).
Study order: KORA, FHS, SHIP, and CHS.
Functional studies of IGFBP3
The function of IGFBP3 was explored in the ATDC5 chondrogenesis model system. Hypertrophic differentiation of chondrocytes, a process associated with cartilage loss, is associated with decreased expression of type II collagen and aggrecan, matrix calcification, and increased expression of the Runx2 transcription factor [30]. Runx2, together with MEF2C, increases the expression of type X collagen, matrix metalloproteinases (MMPs), and Indian Hedgehog (Ihh) [30].
Efficient knockdown of IGFBP3 was achieved in ATDC5 cells (Figure 3a). By day 21, matrix calcification (Alizarin red staining), sulfated proteoglycan synthesis (Alcian blue and Safranin O staining), and collagen content (Sirius red staining) were reduced in IGFBP3− cells compared to controls (all P-values < 0.05) (online supplementary Figure S6), indicating that IGFBP3 knockdown impairs mineralization and the early phase of chondrogenesis.
Figure 3. Impact of IGFBP3 knockdown and overexpression on markers of cartilage homeostasis.

ATDC5 cells stably transfected with a transgene expressing siRNA directed against IGFBP3 marked in red, control cells in blue (a–f). IGFBP3 overexpression (gray bars) and control cells (white bars) in articular cartilage (g, h). Gene expression levels quantified by RT-PCR were IGFBP3 (a), Type II collagen/Col2A1 (b), Type X collagen/Col10A1 (c), Runx2 (d), Tcf1 (e), Ihh (f), Aggrecan (g), and MMP13 (h). * P-value ≤ 0.05 difference with day 1 levels. # P-value ≤ 0.05 difference with control at each day.
IGFBP3 knockdown in ATDC5 cells resulted in a lack of expression of type X collagen and lower expression levels of Runx2 and Ihh, indicating that hypertrophy was largely prevented (Figure 3c,d,f). Expression of type II collagen was also reduced, but to a lesser extent (Figure 3b). WNT signaling is known to activate Runx2 expression and stimulate hypertrophy [30]. Consistent with a prevention of hypertrophy, IGFBP3 knockdown resulted in lower levels of Tcf1, a marker of active WNT signaling (Figure 3e).
The effect of IGFBP3 overexpression was examined in articular cartilage isolated from patients that underwent knee replacement for OA (Figure 3g,h). Overexpression of IGFBP3 in human articular cartilage pellets resulted in lower expression levels of aggrecan (Figure 3g) and increased expression of MMP-13 (Figure 3h), consistent with increased cartilage catabolism.
HOA is a disease of both cartilage and bone, with a significant component involving bone remodeling [31]. The role of IGFBP3 in osteogenic differentiation was examined using the MC3T3-E1 cell-based model, a cell line that exhibits temporal gene expression comparable to the in vivo differentiation process [32]. Knockdown experiments were not performed because IGFBP3 is not expressed in the MC3T3-E1 cell line [33]. IGFBP3 overexpression strongly enhanced extracellular matrix mineralization assayed by Alizarin Red staining and Alkaline Phosphatase activity (online supplementary Figure S7a,b). Expression levels of Osteocalcin and Osteopontin were 2.5 and 22.3 fold higher, respectively, in IGFBP3 overexpressing cells at day 21 (online supplementary Figure S7c,d). At the first day of induced IGFBP3 overexpression, before osteoblastogenesis was induced, Osterix mRNA levels were already 50-fold higher, and they remained 14-fold more expressed at day 21 (online supplementary Figure S7e).
DISCUSSION
In this study, we identified a novel GWS HOA locus near the gene IGFBP3. The genetic variant allele associated with lower odds of HOA was also associated with lower levels of circulating IGFBP3, and experimental knockdown of IGFBP3 prevented chondrocyte hypertrophic differentiation, a deleterious event in OA pathogenesis that results in cartilage loss. Moreover, IGFBP3 overexpression in articular cartilage from OA patients increased expression of genes associated with cartilage catabolism, and IGFBP3 overexpression in a cellular model of osteogenic differentiation resulted in an increase in matrix mineralization, consistent with an activation of osteoblastic differentiation. Our results from GWAS and functional studies indicate that IGFBP3 levels in cartilage are related to cartilage maintenance and HOA.
Understanding molecular mechanisms underlying genetic associations requires the identification of genes impacted by associated genetic variants [34]. Our integration of a GWAS meta-analysis of circulating IGFBP3 [16] with our GWAS of HOA revealed that the HOA-associated SNPs rs788748 and rs879966 were significantly associated with circulating IGFBP3, which indicated that these SNPs or variants in LD could be regulatory variants associated with IGFBP3 expression. Circulating IGFBP3 reflects IGFBP3 gene activity from multiple tissues, and associated SNPs could be regulatory variants associated with IGFBP3 expression in at least one tissue, which is then reflected in circulating protein levels. These results cannot be used to determine the tissue in which associated variants might regulate IGFBP3, but the direction of effect for SNP alleles can be inferred, namely, that the rs788748 A allele associated with lower odds of HOA is also associated with lower levels of IGFBP3 expression in at least one tissue. It is also important to note that even though the SNPs near IGFBP3 previously reported to be the most significantly associated with circulating IGFBP3 [16] are not significantly associated with HOA, these SNPs explain a small percentage of the variance in IGFBP3 levels, thus preventing the meaningful interpretation of the relationship between circulating IGFBP3 and HOA.
IGFBP3 is one of six insulin-like growth factor binding proteins (IGFBPs) in humans [35]. IGFBPs modulate IGF signaling by binding to the two ligands (IGF-I and IGF-II) that primarily signal through the type I IGF-I receptor (IGF-IR) [35]. In articular cartilage from individuals without OA, IGF-I activates anabolic processes and inhibits catabolism of cartilage [36–38]. In OA cartilage, IGF-I’s anabolic activity is greatly diminished, despite the presence of its receptor (IGF-IR) [39, 40]. Higher levels of IGFBPs, in particular IGFBP3, have been observed in OA cartilage, leading to the notion that IGFBPs could decrease IGF-I’s bioavailability and could at least be partially responsible for the reduced responsiveness of OA cartilage to IGF-I [40–45]. Consistent with this notion, an IGFBP-insensitive IGF-I analog exhibited a stronger anabolic effect on cartilage than IGF-I alone [42], and a small molecule that inhibits the binding of IGFBPs to IGF-I restored the anabolic effect of IGF-I on OA chondrocytes [46]. Our experimental results also suggest that lower levels of IGFBP3 could promote cartilage maintenance. Further studies are needed to determine whether the HOA association with rs788748 is mediated through a potential alteration in the role of IGFBP3 in cartilage homeostasis during developmental growth to determine joint morphology or perhaps through a subtle impact on IGFBP3 throughout life to affect the threshold for developing HOA. Furthermore, whether IGFBP3’s effect on cartilage homeostasis depends on IGF-I will need to be explored in future studies, as IGFBP3 possesses a nuclear localization sequence, it has been found to localize to the nucleus in cartilage, and it has been proposed to have IGF-independent effects in other biological processes [35, 47].
The nearly complete elimination of IGFBP3 expression in our knockdown experiments had strong effects on the prevention of chondrocyte hypertrophy, but subtle effects on cartilage maintenance were also observed, arguing for a minimum required level of IGFBP3. The HOA associated variants rs788748 and rs879966 were associated with a reduction, but not elimination, of circulating IGFBP3. We also observed that chondrocyte hypertrophy was stimulated by overexpression of IGFBP3 in OA cartilage, which is already in a diseased state, leaving it unknown whether this same effect would be observed in healthy cartilage. With this caveat in mind, higher levels of IGFBP3 could contribute to cartilage loss in diseased cartilage. Taken together, our cell-based experiments argue for a certain range of IGFBP3 in cartilage that supports healthy cartilage homeostasis. In order for IGFBP3-targeted HOA treatments to potentially be effective, this proposed healthy IGFBP3 range will need to be carefully characterized. Furthermore, IGFBP3-targeted therapies must consider the potential impacts on cancer and other IGFBP3-associated diseases [35].
A number of factors that regulate IGFBP3 expression have been identified, but IGFBP3 transcriptional enhancers that function in chondrocytes are not well characterized [35]. HMGA1 binds to several sites 2 kb upstream of the IGFBP3 promoter and is required for IGFBP3 expression in chondrocytes [48], but DNA near rs788748 and rs879966 has not been experimentally tested for enhancer activity. HMGA1 binding data was not included in the ENCODE project, but there is evidence that C/EBPβ, HMGA1’s binding partner, binds DNA near rs788748 (online supplementary Figure S5). Functional studies of this genomic region could help to elucidate the dynamic role IGFBP3 plays in OA development.
Despite a directionally consistent and significant association in the replication studies, the joint analysis P-value (combined discovery and replication) was less significant than the discovery stage P-value, which is not surprising given that the replication stage sample size was larger and the replication stage effect size was closer to the null, indicating a possible winner’s curse effect [22] even though a correction for this effect had little impact on the discovery stage OR [23]. While joint analysis provides greater power in two-stage designs than replication analysis to identify genome-wide significant associations, even greater power is achieved in one-stage designs where genome-wide SNPs are genotyped in all samples [49]. We performed a one-stage design in the MrOS and SOF cohorts to identify genome-wide significant SNP associations, followed by a standard replication analysis of the two genome-wide significant associations in independent studies. As genome-wide SNPs were tested in the discovery stage, the significance threshold accounting for the multiple testing burden should only be applied to discovery stage results. Furthermore, given our allocation of studies in discovery and replication, a replication stage two-tailed P-value of 1x10⁻³ is required to achieve genome-wide significance in a joint analysis (see online supplementary Text S1), a threshold that exceeds typical significance thresholds for replication. Moreover, the practice of combining discovery and replication stage results to achieve genome-wide significance has been noted to present multiple testing problems [50].
In summary, our results from genome-wide association and functional studies support the role of IGFBP3 in HOA. Further work is needed to determine whether IGFBP3’s effect on cartilage homeostasis requires its interaction with IGF-I. If the IGFBP3 and IGF-I interaction plays a role in HOA, consideration of this interaction could enhance HOA therapies that target the anabolic effect of IGF-I.
Supplementary Material
95% confidence bands shaded in gray.
95% confidence bands shaded in gray.
95% confidence bands shaded in gray.
Filled red circles mark SNPs surrounding genome-wide significant SNPs.
Enhancer-associated histone modifications (Histone-3 Lysine-4 mono-methylation and Histone-3 Lysine-27 acetylation) are shown on the top two tracks. DNase I hypersensitivity sites and transcription factor ChIP-seq are shown on the next two tracks. SNPs from dbSNP build 130 are shown on the bottom track, and the two genome-wide significant SNPs are highlighted in red. Figure was adapted from the UCSC genome browser.
ATDC5 cells stably transfected with a transgene expressing siRNA directed against IGFBP3 marked in red, control cells in blue. ATDC cells stained with Alcian Blue (a), Safranin O (b), Sirius Red (c), and Alizarin Red (d). * P-value ≤ 0·05 difference with day 1 levels. # P-value ≤ 0·05 difference with control at each day.
Cells overexpressing IGFBP3 marked in red, control cells in blue. MC3T3 cells stained using Alizarin Red (a) and stained for Alkaline Phosphatase activity (b). Expression levels of Osteocalcin (c), Osteopontin (d), and Osterix (e) detected using RT-PCR. * P-value ≤ 0·05 difference with day 1 levels. # P-value ≤ 0·05 difference with control at each day.
Table S1. Genotyping methods.
Table S2. Discovery stage study population characteristics.
Table S3. SNP association results adjusted for height and BMI in discovery studies.
Table S4. Study population characteristics from replication studies with radiographic HOA.
Table S5. Study population characteristics from replication studies based on clinical HOA.
Table S6. Look-up of previously reported SNP associations with OA in discovery stage meta-analysis.
Table S7. HOA association with index SNPs previously reported by Kaplan et al. to be associated with circulating IGFBP3.
Text S1. Study descriptions, supplemental methods, and study acknowledgements and funding.
Footnotes
Competing Interest: None declared.
References
- 1.Lawrence RC, Felson DT, Helmick CG, Arnold LM, Choi H, Deyo RA, et al. Estimates of the prevalence of arthritis and other rheumatic conditions in the United States. Part II. Arthritis Rheum. 2008 Jan;58(1):26–35. doi: 10.1002/art.23176. [DOI] [PMC free article] [PubMed] [Google Scholar]
- 2.Nevitt MC, Lane NE, Scott JC, Hochberg MC, Pressman AR, Genant HK, et al. Radiographic osteoarthritis of the hip and bone mineral density. The Study of Osteoporotic Fractures Research Group. Arthritis Rheum. 1995 Jul;38(7):907–916. doi: 10.1002/art.1780380706. [DOI] [PubMed] [Google Scholar]
- 3.Katz JN. Total joint replacement in osteoarthritis. Best Pract Res Clin Rheumatol. 2006 Feb;20(1):145–153. doi: 10.1016/j.berh.2005.09.003. [DOI] [PubMed] [Google Scholar]
- 4.Valdes AM, Spector TD. Genetic epidemiology of hip and knee osteoarthritis. Nat Rev Rheumatol. 2011 Jan;7(1):23–32. doi: 10.1038/nrrheum.2010.191. [DOI] [PubMed] [Google Scholar]
- 5.Miyamoto Y, Mabuchi A, Shi D, Kubo T, Takatori Y, Saito S, et al. A functional polymorphism in the 5′ UTR of GDF5 is associated with susceptibility to osteoarthritis. Nat Genet. 2007 Apr;39(4):529–533. doi: 10.1038/2005. [DOI] [PubMed] [Google Scholar]
- 6.Evangelou E, Chapman K, Meulenbelt I, Karassa FB, Loughlin J, Carr A, et al. Large-scale analysis of association between GDF5 and FRZB variants and osteoarthritis of the hip, knee, and hand. Arthritis Rheum. 2009 Jun;60(6):1710–1721. doi: 10.1002/art.24524. [DOI] [PMC free article] [PubMed] [Google Scholar]
- 7.Valdes AM, Evangelou E, Kerkhof HJ, Tamm A, Doherty SA, Kisand K, et al. The GDF5 rs143383 polymorphism is associated with osteoarthritis of the knee with genome-wide statistical significance. Ann Rheum Dis. 2011 May;70(5):873–875. doi: 10.1136/ard.2010.134155. [DOI] [PMC free article] [PubMed] [Google Scholar]
- 8.Day-Williams AG, Southam L, Panoutsopoulou K, Rayner NW, Esko T, Estrada K, et al. A variant in MCF2L is associated with osteoarthritis. Am J Hum Genet. 2011 Sep 9;89(3):446–450. doi: 10.1016/j.ajhg.2011.08.001. [DOI] [PMC free article] [PubMed] [Google Scholar]
- 9.Castano Betancourt MC, Cailotto F, Kerkhof HJ, Cornelis FM, Doherty SA, Hart DJ, et al. Genome-wide association and functional studies identify the DOT1L gene to be involved in cartilage thickness and hip osteoarthritis. Proc Natl Acad Sci U S A. 2012 May 22;109(21):8218–8223. doi: 10.1073/pnas.1119899109. [DOI] [PMC free article] [PubMed] [Google Scholar]
- 10.Evangelou E, Valdes AM, Castano-Betancourt MC, Doherty M, Doherty S, Esko T, et al. The DOT1L rs12982744 polymorphism is associated with osteoarthritis of the hip with genome-wide statistical significance in males. Ann Rheum Dis. 2013 Jul;72(7):1264–1265. doi: 10.1136/annrheumdis-2012-203182. [DOI] [PMC free article] [PubMed] [Google Scholar]
- 11.Evangelou E, Kerkhof HJ, Styrkarsdottir U, Ntzani EE, Bos SD, Esko T, et al. A meta-analysis of genome-wide association studies identifies novel variants associated with osteoarthritis of the hip. Ann Rheum Dis. 2013 Sep 4; doi: 10.1136/annrheumdis-2012-203114. [DOI] [PMC free article] [PubMed] [Google Scholar]
- 12.Zeggini E, Panoutsopoulou K, Southam L, Loughlin J. Identification of new susceptibility loci for osteoarthritis (arcOGEN): a genome-wide association study. Lancet. 2012 Sep 1;380(9844):815–823. doi: 10.1016/S0140-6736(12)60681-3. [DOI] [PMC free article] [PubMed] [Google Scholar]
- 13.Kerkhof HJ, Meulenbelt I, Akune T, Arden NK, Aromaa A, Bierma-Zeinstra SM, et al. Recommendations for standardization and phenotype definitions in genetic studies of osteoarthritis: the TREAT-OA consortium. Osteoarthritis Cartilage. 2011 Mar;19(3):254–264. doi: 10.1016/j.joca.2010.10.027. [DOI] [PMC free article] [PubMed] [Google Scholar]
- 14.Kellgren JH, Lawrence JS. Radiological assessment of osteo-arthrosis. Ann Rheum Dis. 1957 Dec;16(4):494–502. doi: 10.1136/ard.16.4.494. [DOI] [PMC free article] [PubMed] [Google Scholar]
- 15.Croft P, Cooper C, Wickham C, Coggon D. Defining osteoarthritis of the hip for epidemiologic studies. Am J Epidemiol. 1990 Sep;132(3):514–522. doi: 10.1093/oxfordjournals.aje.a115687. [DOI] [PubMed] [Google Scholar]
- 16.Kaplan RC, Petersen AK, Chen MH, Teumer A, Glazer NL, Doring A, et al. A genome-wide association study identifies novel loci associated with circulating IGF-I and IGFBP-3. Hum Mol Genet. 2011 Mar 15;20(6):1241–1251. doi: 10.1093/hmg/ddq560. [DOI] [PMC free article] [PubMed] [Google Scholar]
- 17.Price AL, Patterson NJ, Plenge RM, Weinblatt ME, Shadick NA, Reich D. Principal components analysis corrects for stratification in genome-wide association studies. Nat Genet. 2006 Aug;38(8):904–909. doi: 10.1038/ng1847. [DOI] [PubMed] [Google Scholar]
- 18.Li Y, Willer CJ, Ding J, Scheet P, Abecasis GR. MaCH: using sequence and genotype data to estimate haplotypes and unobserved genotypes. Genet Epidemiol. 2010 Dec;34(8):816–834. doi: 10.1002/gepi.20533. [DOI] [PMC free article] [PubMed] [Google Scholar]
- 19.Willer CJ, Li Y, Abecasis GR. METAL: fast and efficient meta-analysis of genomewide association scans. Bioinformatics. 2010 Sep 1;26(17):2190–2191. doi: 10.1093/bioinformatics/btq340. [DOI] [PMC free article] [PubMed] [Google Scholar]
- 20.Yao Y, Wang Y. ATDC5: An excellent in vitro model cell line for skeletal development. J Cell Biochem. 2012 Nov 28; doi: 10.1002/jcb.24467. [DOI] [PubMed] [Google Scholar]
- 21.Bobacz K, Gruber R, Soleiman A, Graninger WB, Luyten FP, Erlacher L. Cartilage-derived morphogenetic protein-1 and -2 are endogenously expressed in healthy and osteoarthritic human articular chondrocytes and stimulate matrix synthesis. Osteoarthritis Cartilage. 2002 May;10(5):394–401. doi: 10.1053/joca.2002.0522. [DOI] [PubMed] [Google Scholar]
- 22.Goring HH, Terwilliger JD, Blangero J. Large upward bias in estimation of locus-specific effects from genomewide scans. Am J Hum Genet. 2001 Dec;69(6):1357–1369. doi: 10.1086/324471. [DOI] [PMC free article] [PubMed] [Google Scholar]
- 23.Xiao R, Boehnke M. Quantifying and correcting for the winner’s curse in genetic association studies. Genet Epidemiol. 2009 Jul;33(5):453–462. doi: 10.1002/gepi.20398. [DOI] [PMC free article] [PubMed] [Google Scholar]
- 24.Lango Allen H, Estrada K, Lettre G, Berndt SI, Weedon MN, Rivadeneira F, et al. Hundreds of variants clustered in genomic loci and biological pathways affect human height. Nature. 2010 Oct 14;467(7317):832–838. doi: 10.1038/nature09410. [DOI] [PMC free article] [PubMed] [Google Scholar]
- 25.Elliott KS, Chapman K, Day-Williams A, Panoutsopoulou K, Southam L, Lindgren CM, et al. Evaluation of the genetic overlap between osteoarthritis with body mass index and height using genome-wide association scan data. Ann Rheum Dis. 2012 Sep 6; doi: 10.1136/annrheumdis-2012-202081. [DOI] [PMC free article] [PubMed] [Google Scholar]
- 26.Deal C, Ma J, Wilkin F, Paquette J, Rozen F, Ge B, et al. Novel promoter polymorphism in insulin-like growth factor-binding protein-3: correlation with serum levels and interaction with known regulators. J Clin Endocrinol Metab. 2001 Mar;86(3):1274–1280. doi: 10.1210/jcem.86.3.7280. [DOI] [PubMed] [Google Scholar]
- 27.Costalonga EF, Antonini SR, Guerra-Junior G, Mendonca BB, Arnhold IJ, Jorge AA. The -202 A allele of insulin-like growth factor binding protein-3 (IGFBP3) promoter polymorphism is associated with higher IGFBP-3 serum levels and better growth response to growth hormone treatment in patients with severe growth hormone deficiency. J Clin Endocrinol Metab. 2009 Feb;94(2):588–595. doi: 10.1210/jc.2008-1608. [DOI] [PubMed] [Google Scholar]
- 28.Ong CT, Corces VG. Enhancer function: new insights into the regulation of tissue-specific gene expression. Nat Rev Genet. 2011 Apr;12(4):283–293. doi: 10.1038/nrg2957. [DOI] [PMC free article] [PubMed] [Google Scholar]
- 29.Schumacher FR, Cheng I, Freedman ML, Mucci L, Allen NE, Pollak MN, et al. A comprehensive analysis of common IGF1, IGFBP1 and IGFBP3 genetic variation with prospective IGF-I and IGFBP-3 blood levels and prostate cancer risk among Caucasians. Hum Mol Genet. 2010 Aug 1;19(15):3089–3101. doi: 10.1093/hmg/ddq210. [DOI] [PMC free article] [PubMed] [Google Scholar]
- 30.Studer D, Millan C, Ozturk E, Maniura-Weber K, Zenobi-Wong M. Molecular and biophysical mechanisms regulating hypertrophic differentiation in chondrocytes and mesenchymal stem cells. Eur Cell Mater. 2012;24:118–135. doi: 10.22203/ecm.v024a09. discussion 135. [DOI] [PubMed] [Google Scholar]
- 31.Loeser RF, Goldring SR, Scanzello CR, Goldring MB. Osteoarthritis: a disease of the joint as an organ. Arthritis Rheum. 2012 Jun;64(6):1697–170. doi: 10.1002/art.34453. [DOI] [PMC free article] [PubMed] [Google Scholar]
- 32.Raouf A, Seth A. Ets transcription factors and targets in osteogenesis. Oncogene. 2000 Dec 18;19(55):6455–6463. doi: 10.1038/sj.onc.1204037. [DOI] [PubMed] [Google Scholar]
- 33.Fowlkes JL, Serra DM, Rosenberg CK, Thrailkill KM. Insulin-like growth factor (IGF)-binding protein-3 (IGFBP-3) functions as an IGF-reversible inhibitor of IGFBP-4 proteolysis. J Biol Chem. 1995 Nov 17;270(46):27481–27488. doi: 10.1074/jbc.270.46.27481. [DOI] [PubMed] [Google Scholar]
- 34.Edwards SL, Beesley J, French JD, Dunning AM. Beyond GWASs: illuminating the dark road from association to function. Am J Hum Genet. 2013 Nov 7;93(5):779–797. doi: 10.1016/j.ajhg.2013.10.012. [DOI] [PMC free article] [PubMed] [Google Scholar]
- 35.Jogie-Brahim S, Feldman D, Oh Y. Unraveling insulin-like growth factor binding protein-3 actions in human disease. Endocr Rev. 2009 Aug;30(5):417–437. doi: 10.1210/er.2008-0028. [DOI] [PMC free article] [PubMed] [Google Scholar]
- 36.Tyler JA. Insulin-like growth factor 1 can decrease degradation and promote synthesis of proteoglycan in cartilage exposed to cytokines. Biochem J. 1989 Jun 1;260(2):543–548. doi: 10.1042/bj2600543. [DOI] [PMC free article] [PubMed] [Google Scholar]
- 37.McQuillan DJ, Handley CJ, Campbell MA, Bolis S, Milway VE, Herington AC. Stimulation of proteoglycan biosynthesis by serum and insulin-like growth factor-I in cultured bovine articular cartilage. Biochem J. 1986 Dec 1;240(2):423–430. doi: 10.1042/bj2400423. [DOI] [PMC free article] [PubMed] [Google Scholar]
- 38.Luyten FP, Hascall VC, Nissley SP, Morales TI, Reddi AH. Insulin-like growth factors maintain steady-state metabolism of proteoglycans in bovine articular cartilage explants. Arch Biochem Biophys. 1988 Dec;267(2):416–425. doi: 10.1016/0003-9861(88)90047-1. [DOI] [PubMed] [Google Scholar]
- 39.Schalkwijk J, Joosten LA, van den Berg WB, van de Putte LB. Chondrocyte nonresponsiveness to insulin-like growth factor 1 in experimental arthritis. Arthritis Rheum. 1989 Jul;32(7):894–900. [PubMed] [Google Scholar]
- 40.Dore S, Pelletier JP, DiBattista JA, Tardif G, Brazeau P, Martel-Pelletier J. Human osteoarthritic chondrocytes possess an increased number of insulin-like growth factor 1 binding sites but are unresponsive to its stimulation. Possible role of IGF-1-binding proteins. Arthritis Rheum. 1994 Feb;37(2):253–263. doi: 10.1002/art.1780370215. [DOI] [PubMed] [Google Scholar]
- 41.Morales TI. The insulin-like growth factor binding proteins in uncultured human cartilage: increases in insulin-like growth factor binding protein 3 during osteoarthritis. Arthritis Rheum. 2002 Sep;46(9):2358–2367. doi: 10.1002/art.10482. [DOI] [PubMed] [Google Scholar]
- 42.Morales TI. The quantitative and functional relation between insulin-like growth factor-I (IGF) and IGF-binding proteins during human osteoarthritis. J Orthop Res. 2008 Apr;26(4):465–474. doi: 10.1002/jor.20549. [DOI] [PMC free article] [PubMed] [Google Scholar]
- 43.Olney RC, Tsuchiya K, Wilson DM, Mohtai M, Maloney WJ, Schurman DJ, et al. Chondrocytes from osteoarthritic cartilage have increased expression of insulin-like growth factor I (IGF-I) and IGF-binding protein-3 (IGFBP-3) and -5, but not IGF-II or IGFBP-4. J Clin Endocrinol Metab. 1996 Mar;81(3):1096–1103. doi: 10.1210/jcem.81.3.8772582. [DOI] [PubMed] [Google Scholar]
- 44.Iwanaga H, Matsumoto T, Enomoto H, Okano K, Hishikawa Y, Shindo H, et al. Enhanced expression of insulin-like growth factor-binding proteins in human osteoarthritic cartilage detected by immunohistochemistry and in situ hybridization. Osteoarthritis Cartilage. 2005 May;13(5):439–448. doi: 10.1016/j.joca.2004.12.006. [DOI] [PubMed] [Google Scholar]
- 45.Tardif G, Reboul P, Pelletier JP, Geng C, Cloutier JM, Martel-Pelletier J. Normal expression of type 1 insulin-like growth factor receptor by human osteoarthritic chondrocytes with increased expression and synthesis of insulin-like growth factor binding proteins. Arthritis Rheum. 1996 Jun;39(6):968–978. doi: 10.1002/art.1780390614. [DOI] [PubMed] [Google Scholar]
- 46.De Ceuninck F, Caliez A, Dassencourt L, Anract P, Renard P. Pharmacological disruption of insulin-like growth factor 1 binding to IGF-binding proteins restores anabolic responses in human osteoarthritic chondrocytes. Arthritis Res Ther. 2004;6(5):R393–403. doi: 10.1186/ar1201. [DOI] [PMC free article] [PubMed] [Google Scholar]
- 47.Hunziker EB, Kapfinger E, Martin J, Buckwalter J, Morales TI. Insulin-like growth factor (IGF)-binding protein-3 (IGFBP-3) is closely associated with the chondrocyte nucleus in human articular cartilage. Osteoarthritis Cartilage. 2008 Feb;16(2):185–194. doi: 10.1016/j.joca.2007.06.008. [DOI] [PMC free article] [PubMed] [Google Scholar]
- 48.Gasparini G, Gori MD, Paonessa F, Chiefari E, Brunetti A, Galasso O. Functional relationship between high mobility group A1 (HMGA1) protein and insulin-like growth factor-binding protein 3 (IGFBP-3) in human chondrocytes. Arthritis Res Ther. 2012 Oct 4;14(5):R207. doi: 10.1186/ar4045. [DOI] [PMC free article] [PubMed] [Google Scholar]
- 49.Skol AD, Scott LJ, Abecasis GR, Boehnke M. Joint analysis is more efficient than replication-based analysis for two-stage genome-wide association studies. Nat Genet. 2006 Feb;38(2):209–213. doi: 10.1038/ng1706. [DOI] [PubMed] [Google Scholar]
- 50.Lambert CG, Black LJ. Learning from our GWAS mistakes: from experimental design to scientific method. Biostatistics. 2012 Apr;13(2):195–203. doi: 10.1093/biostatistics/kxr055. [DOI] [PMC free article] [PubMed] [Google Scholar]
Associated Data
This section collects any data citations, data availability statements, or supplementary materials included in this article.
Supplementary Materials
95% confidence bands shaded in gray.
95% confidence bands shaded in gray.
95% confidence bands shaded in gray.
Filled red circles mark SNPs surrounding genome-wide significant SNPs.
Enhancer-associated histone modifications (Histone-3 Lysine-4 mono-methylation and Histone-3 Lysine-27 acetylation) are shown on the top two tracks. DNase I hypersensitivity sites and transcription factor ChIP-seq are shown on the next two tracks. SNPs from dbSNP build 130 are shown on the bottom track, and the two genome-wide significant SNPs are highlighted in red. Figure was adapted from the UCSC genome browser.
ATDC5 cells stably transfected with a transgene expressing siRNA directed against IGFBP3 marked in red, control cells in blue. ATDC cells stained with Alcian Blue (a), Safranin O (b), Sirius Red (c), and Alizarin Red (d). * P-value ≤ 0·05 difference with day 1 levels. # P-value ≤ 0·05 difference with control at each day.
Cells overexpressing IGFBP3 marked in red, control cells in blue. MC3T3 cells stained using Alizarin Red (a) and stained for Alkaline Phosphatase activity (b). Expression levels of Osteocalcin (c), Osteopontin (d), and Osterix (e) detected using RT-PCR. * P-value ≤ 0·05 difference with day 1 levels. # P-value ≤ 0·05 difference with control at each day.
Table S1. Genotyping methods.
Table S2. Discovery stage study population characteristics.
Table S3. SNP association results adjusted for height and BMI in discovery studies.
Table S4. Study population characteristics from replication studies with radiographic HOA.
Table S5. Study population characteristics from replication studies based on clinical HOA.
Table S6. Look-up of previously reported SNP associations with OA in discovery stage meta-analysis.
Table S7. HOA association with index SNPs previously reported by Kaplan et al. to be associated with circulating IGFBP3.
Text S1. Study descriptions, supplemental methods, and study acknowledgements and funding.