

Abstract
A panel of nine hypoxia regulated genes, selected from a previously published fifty gene panel, was investigated for its ability to predict hypoxic ovarian cancer phenotypes. All nine genes including vascular endothelial growth factor A, glucose transporter 1, phosphoglycerate mutase 1, lactate dehydrogenase A, prolyl 4-hydroxylase, alpha-polypeptide 1, adrenomedullin, N-myc downstream regulated 1, aldolase A, and carbonic anhydrase 9 were upregulated in the HEY and OVCAR-3 human ovarian cell lines cultured in vitro under hypoxic compared to normoxic conditions as measured by quantitative reverse transcription polymerase chain reaction (qRT-PCR). The gene panel was also elevated in HEY xenograft tumor tissue compared to HEY cells cultured in normoxia. The HEY xenograft tissue demonstrated heterogeneous positive immunohistochemical staining for the exogenous hypoxia biomarker pimonidazole, and the hypoxia regulated protein carbonic anhydrase IX. A quantitative nuclease protection assay (qNPA) was developed which included the nine hypoxia regulated genes. The qNPA assay provided similar results to those obtained using qRT-PCR for cultured cell lines. The qNPA assay was also evaluated using paraffin embedded fixed tissues including a set of five patient matched primary and metastatic serous cancers and four normal ovaries. In this small sample set the average gene expression was higher in primary and metastatic cancer tissue compared to normal ovaries for the majority of genes investigated. This study supports further evaluation by qNPA of this gene panel as an alternative or complimentary method to existing protein biomarkers to identify ovarian cancers with a hypoxic phenotype.
Electronic supplementary material
The online version of this article (doi:10.1007/s12307-015-0166-x) contains supplementary material, which is available to authorized users.
Keywords: Ovarian cancer, Hypoxia regulated gene panel, Tumor microenvironment
Introduction
In many tumor types, hypoxia is associated with more aggressive disease and increased resistance to both chemotherapy and radiation therapy[1, 2]. The incidence of hypoxia in primary ovarian tissue, metastatic tumor implants, residual disease, and recurrent disease is poorly characterized. However, many studies have reported on expression of the hypoxia regulated transcription factor hypoxia-inducible factor-1 alpha (HIF-1α) in ovarian tumor tissue, with up to 68 % of ovarian cancer tissues investigated showing positive protein staining [3, 4]. We and others have shown that VEGF, another HIF-1α regulated gene, is also highly expressed in ovarian cancers [5]. VEGF is emerging as an important therapeutic target in ovarian cancer and is the primary mediator of angiogenesis in this patient population [6, 7]. Over-expression of carbonic anhydrase IX (note: CA IX will be used to refer to protein and CA9 will be used to refer to gene expression throughout this manuscript), also HIF-1α regulated, has been reported to be an independent poor prognostic factor in endometrioid ovarian cancer [8]. In high-grade serous ovarian carcinomas, co-expression of VEGF and CA IX protein has been correlated with chemotherapy resistance and decreased survival [9].
Hypoxia is difficult to accurately measure directly in tumor tissue and requires utilization of an oxygen microelectrode [10]. However, other methods which may reflect the molecular consequences of hypoxia can be used as hypoxia biomarkers [reviewed in [11, 12]]. Due to the instability of HIF-1α protein and technical problems associated with pre-analytical handling of tissue samples, results in the literature using HIF-1α as a hypoxia biomarker are variable and must be interpreted with caution. CA IX is a more stable protein than HIF-1α and is frequently used as a biomarker of hypoxia. But because CA IX can be regulated by constitutive HIF-1α expression and by other transcription factors, its expression level may not always correlate with hypoxia [13]. To predict efficacy of therapies that are directly impacted by the oxygen content of the tumor microenvironment, including radiation therapy and hypoxia activated prodrugs, there is a need for alternative or complimentary approaches for assessing tumor hypoxia.
Hypoxia gene-expression signatures have been investigated in several tumor types including ovarian cancer. Chi J-T et al., 2006 [14] cultured mammary and renal tubular epithelial cells in hypoxia and using DNA microarray identified a hypoxia responsive signature based on 123 genes. This gene signature was applied to 72 ovarian cancers and found to differentiate the cancers into two distinct groups using hierarchical clustering. The two groups identified demonstrated marked differences in survival and relapse-free survival. A sophisticated meta-analysis of multiple cancer types conducted by Buffa et al. 2010 [15] identified a common prognostic hypoxia 50 gene signature using data from head and neck and breast cancer studies. A recent study performed in head and neck squamous cell carcinoma reported on the technical validation of a TaqMan Low Density Array (TLDA) platform that reliably predicted a hypoxia phenotype and was associated with excellent precision and reproducibility [8].
We performed exploratory quantitative reverse transcription polymerase chain reaction (qRT-PCR) analysis using cell lysates from ovarian cell lines cultured in hypoxia of the top 15 ranked genes in the Buffa et al.[15] analysis plus carbonic anhydrase 9 which was ranked #50 by Buffa et al. [15]. We included carbonic anhydrase 9 because of the wealth of literature on carbonic anhydrase 9 protein expression in ovarian cancers. Of these 16 genes we observed several that showed no hypoxia induction or had poor amplification profiles in the cell culture samples cultured in hypoxia. We chose the top performing 9 genes for further study of the temporal changes in expression in two ovarian cancer cell lines cultured in normoxia or hypoxia using qRT-PCR. We also investigated the same 9 hypoxia regulated gene panel in an ovarian xenograft model and a small set of matched primary and metastatic serous ovarian cancer patient tissues. We also evaluated the expression of these 9 genes in ovarian samples included in the TCGA database. Our study suggests that this small nine gene hypoxia regulated panel may be sufficient to accurately identify hypoxic ovarian tumors and supports the future evaluation of this panel in a larger set of tissues from patients with ovarian cancer.
The large majority of patient ovarian tumor tissues are preserved in formalin and paraffin embedded (formalin-fixed paraffin-embedded; FFPE). Due to the technical challenges involved in performing gene expression studies using qRT-PCR with RNA extracted from FFPE tissue, we sought to identify a more robust analytical method to evaluate the nine hypoxia regulated gene panel. The quantitative nuclease protection assay has been previously demonstrated to perform well using fresh, frozen, or FFPE tissues [16]. We designed a custom multiplex qNPA array containing the 9 hypoxia regulated genes and 4 housekeeper genes. The HEY and OVCAR-3 cell lines grown in hypoxia were analyzed using both qRT-PCR and the qNPA array. FFPE normal ovarian and cancer tissue representative of primary and metastatic sites from five serous carcinoma cases were also analyzed using the qNPA assay. Similar results were observed with both qRT-PCR and qNPA supporting further use of the qNPA assay in larger studies.
Methods
Cell Culture
OVCAR-3 cells were purchased from the American Type Culture Collection (ATCC, Manassas, VA) and HEY cells were purchased from Cedarlane (Burlington, NC). OVCAR-3 were cultured in RPMI 1640 (Cellgro, Manassas, VA) with L-glutamine supplemented with 20 % FBS (HyClone, Logan, UT) and 0.01 mg/ml Bovine Insulin (Sigma-Aldrich, St. Louis, MO). HEY cells were culture in DMEM (CellGro) supplemented with 10 % FBS (HyClone) and 1 % Pen/Strep (Gibco, Carlsbad, CA). Both cell lines were cultured at 37 °C and 5 % CO2. For hypoxic conditions, cells were grown in a humidified Ruskinn Invivo2 Hypoxia Workstation (Ruskinn, Pencoed, Bridgend, UK) controlled by a Gas Mixer Q (Ruskinn). Oxygen concentrations of 1 and 0.2 % were used as indicated with 5 % CO2. For pH studies cells were cultured in media adjusted to pH 6.7 with 20 mM lactic acid and HCl.
Xenograft Models in Experimental Mice
Intraperitoneal (IP) xenografts of HEY cells were grown by the Experimental Mouse Shared Service (EMSS, University of Arizona, Tucson, Arizona) in adherence with Institutional Animal Care and Utilization Committee guidelines. HEY cells (2.5 × 10⁵) were injected IP in 0.2 ml of sterile phosphate buffered saline (PBS) in outbred nude mice (Taconic, Hudson, NY). After an average of 22 days of growth, 60 mg/kg pimonidazole (Hypoxyprobe Inc., Burlington, MA) was injected IP. One hour later, mice were sacrificed by CO2 and tumor implants removed for biomarker analysis. Tissue samples for RNA isolation were placed into Buffer RLT Plus (Qiagen, Valencia, CA) containing 10 μl/ml β-mercaptoethanol (Fisher Scientific, Pittsburgh, PA). For fixation, tissue was immediately placed in 10 % neutral buffered formalin for 24 h, transferred to 70 % EtOH for dehydration and then mounted in paraffin blocks.
Tumor Histology and Staining
Hematoxylin and eosin (H&E) stains were performed on 3-micron sections of tissue cut from the formalin-fixed, paraffin-embedded tissue blocks. Immunohistochemistry (IHC) was performed using anti-pimonidazole mouse monoclonal antibody MAb1, clone 4.3.11.3 diluted 1:50 (Hypoxyprobe Inc, Raleigh, NC). CA IX staining was performed using anti-CA IX antibody from Novus Biologicals (Littleton, CO) diluted 1:2000. VEGF-A staining was performed using anti-VEGF-A antibody (Santa Cruz Biotech # sc-7269) diluted 1:70. Tissue sections were stained on a Discovery XT Automated Immunostainer (Ventana Medical Systems, Inc., Tucson, AZ). All steps were performed with this instrument using VMSI validated reagents, including deparaffinization, cell conditioning (antigen retrieval with a borate-EDTA buffer), primary antibody staining, detection and amplification using a biotinylated-streptavidin-HRP and diaminobenzidine system and hematoxylin counterstaining. Semi-quantitative scoring of CA IX, VEGF-A, and pimonidazole was performed by a Board Certified Pathologist, Dr. Raymond Nagle, as part of the services provided by the University of Arizona Cancer Center Tissue Acquisition and Cellular/Molecular Analysis and Biorepository Shared Service (TACMASS, University of Arizona, Tucson, AZ). Immunoreactivity for VEGF-A and CA IX was categorized as 0 = negative; 1 = weak; 2 = moderate; 3 = strong. The percentage of immunoreactive tumor cells was also evaluated for each intensity level. The overall scores were calculated by multiplying the intensity by the corresponding percentage of immunoreactive cells (scores range between 0 and 300). For pimonidazole staining, only the percentages of immunoreactive tumor cells were evaluated.
Patient Ovarian Tissues
Patient tumor (cancer) samples and normal ovaries were received from the TACMASS Biobank in compliance with local Institutional Review Board Requirements for Human Subject Protection. Paired primary and metastatic frozen ovarian cancer specimens were sectioned directly into Buffer RLT Plus (Qiagen). FFPE tissue was sectioned into tubes and lysed in HTG Lysis Buffer (HTG Molecular Diagnostics, Tucson, AZ).
RNA Isolation
Cell culture samples, xenograft tissue, and patient tumor tissues were homogenized first by pipetting in Buffer RLT Plus (Qiagen) containing 10 μl/ml β-mercaptoethanol (Fisher Scientific). Xenograft tissue was homogenized using Power Gen 125 (Fisher Scientific) tissue grinder. All samples were then sonicated using a Sonic Dismembrator Model 100 (Fisher Scientific). Samples were further homogenized using QIAshredder spin columns (Qiagen) by spinning samples through the column at 16,000×g for 2 min and collecting the flow through. Isolation of RNA from both cultured cells and primary ovarian tissues was performed using the RNeasy Plus Mini Kit (Qiagen) according to manufacturer’s protocol. Final RNA elution was performed using 30 μl of RNase-free water. RNA concentrations were determined using a NanoDrop 2000c (Thermo Scientific, Waltham, MA) micro-volume spectrophotometer.
cDNA Synthesis
cDNA for RT-PCR was synthesized using the qScript cDNA Synthesis Kit (Quanta Biosciences, Gaithersburg, MD) according to manufacturer’s protocol using 200 ng of RNA as template per reaction. Thermal cycler conditions for cDNA synthesis: 1 cycle at 22 °C for 5 min, 1 cycle at 42 ° C for 30 min, 1 cycle at 85 ° C for 5 min. Seven 20 μl cDNA reactions were made for each ovarian tissue sample or ovarian cell line treatment group and combined to ensure homogenous cDNA template for RT-PCR.
qRT-PCR
RT-PCR reactions were performed using 2x TaqMan universal PCR Mastermix (Applied Biosystems, Branchburg, NJ), 20x TaqMan Gene Expression Assays (Applied Biosystems), which contain both the target primers and probe, and 2 μl of cDNA template were used per reaction according to manufacturer’s protocol. Each Fam-labeled gene of interest was analyzed in triplicate and multiplexed with the primer-limited, VIC-labeled control gene beta-2-microglobulin (B2M) as an endogenous control. RT-PCR amplification reactions were performed using an ABI Prism 7000 Sequence Detection System (Applied Biosystems). Cycling conditions for RT-PCR: 1 cycle at 50 ° C for 2 min, 1 cycle at 95 °C for 10 min, 40 cycles at 95 °C for 15 s followed by 60 ° C for 1 min. A triplicate of a bridging sample probed for peptidylprolyl isomerase A (PPIA) was run with every plate to ensure amplification consistency across different PCR plates and runs.
PCR Data Normalization
Relative gene expression was determined using the 2-ΔΔCT method as described by Livak and Schmittgen, 2001 [17]. In each well, the VIC-labeled B2M control was subtracted from the Fam-labeled target gene to generate ΔCT values for each. Triplicate ΔCT values for each target gene were averaged together to yield one ΔCT value and a standard deviation for each target gene. ΔCT values for each gene from the control group were subtracted from the corresponding gene ΔCT values from the experimental group to yield ΔΔCT values for each gene. ΔΔCT values for each gene were then analyzed using the formula 2-ΔΔCT. This formula yields gene expression of the experimental relative to the control group, which is defined as 1 for all genes. For hypoxia treated ovarian cell lines, gene expression of the hypoxia treated group is the experimental group shown relative to normoxic cells for the same time point. Frozen patient ovarian cancer tissue was considered the experimental group and cultured normoxic HEY cells (4 h time point) were designed the control group. The upper and lower limits of error bars for each gene were calculated by adding or subtracting the standard deviation of the experimental group to the corresponding ΔΔCT value for that gene, then using the new values in the 2-ΔΔCT formula. To determine outliers in the triplicate analysis to be removed from final data analysis, several parameters were employed. Genes were flagged if the standard deviations of the target and control genes differed by a value greater than or equal to 0.3. If one value in either the target or control triplicate differed from the next value by 0.5 cycles or more, without the same change seen in the other gene analyzed in that well, the entire replicate (target and control gene) was removed from data analysis. Replicates were also removed from data analysis if both the target and control gene differed from the average of the other 2 values in the triplicate by a value of 0.6 cycles or more, as cDNA loading in this well was considered inaccurate.
Analysis of Hypoxia Regulated Genes in the Ovarian Data Set from the Cancer Genome Atlas
Gene expression datasets with correlated clinical annotation was downloaded from The Cancer Genome Atlas (TCGA) for expression analysis of the nine hypoxia regulated gene panel. Data was analyzed using BioConductor modules (http://www.bioconductor.org). BioConductor affy module was used to perform background subtraction and quantile normalization using the Robust MultiChip Algorithm (RMA). Quality control analysis was done on the chips that included correlation plots, density plots, box plots and RNA degradation analysis. When multiple probes existed for a gene they were averaged. Eight normal ovary tissues and 569 primary serous ovarian cancer (mostly grade 3) samples were analyzed from this dataset for the nine hypoxia regulated genes. Log values for normal and primary cancer samples were plotted to illustrate differential expression between the sets. Further analysis of variance (ANOVA) analysis was done to assess significance of the differential gene expression in the TCGA dataset. Bioconductor limma module was used to estimate variance and p value of ≤0.05 was considered statistically significant. Limma analysis provides an empirical Bayesian technique to improve variance estimation and corrects for multiple hypothesis testing by the Benjamini Hochburg False Discovery Rate method.
qNPA Sample Preparation and Analysis
Cells were cultured in 6-well tissue culture coated plates. Culture media was removed and cells were directly lysed using pre-warmed HTG Lysis buffer (HTG Molecular Diagnostics). Lysis buffer (250 μl) was used to lyse one well of 6-well plate containing cell culture samples and 1000 μl was used to lyse patient tissue samples (an average of ten 5 μm sections were used but number was dependent upon size of the tumor section). Samples were homogenized by micropipetting, vortexing for 10 s, and heating at 95 °C for 15 min. Samples were stored at −80 °C and shipped to HTG Molecular Diagnostics for analysis according to methods previously described [16]] using a custom hypoxia gene array. Housekeeper genes for the custom array were selected by analyzing lysates from HEY and OVCAR-3 cells cultured in normoxia and hypoxia using a qNPA housekeeper array containing 92 potential housekeeper genes. Four housekeeping genes which were stable under hypoxia conditions, (PPIA, ribosomal protein L38 (RPL38), ribosomal protein 19 (RPL19), and ribosomal protein lare P0 (RPLP0), were selected for inclusion on the custom array. Each sample was analyzed in triplicate. Gene intensity values were normalized to housekeeper genes as previously described [16]. Average gene intensity values for each treatment group were divided by average gene intensity values of control treatments to give a relative fold change in expression value.
Statistical Analysis
Statistical analysis of gene changes regulated by culturing in normoxic vs hypoxic conditions was assessed by ANOVA with Tukey adjustment for multiple comparisons.
Results
Hypoxia Regulated Gene Panel Expression in Ovarian Cell Lines Cultured in Normoxic vs Hypoxic Conditions
The nine genes selected for the hypoxia regulated gene panel are described in Table 1. To test the temporal responsiveness of each gene to varying oxygen tension, ovarian cancer cells lines HEY and OVCAR-3 were grown in normoxia, 1 %, or 0.2 % O2 for 4, 16, and 48 h. In general, a greater induction of gene expression was noted with 0.2 % vs 1 % O2. Only modest gene induction was observed for most genes when cells were cultured in hypoxia for 4 h, but significant gene induction was observed for all genes except PGAM1when cells were cultured in hypoxia for 16 and 48 h (Table 2). PGAM1 did not show gene induction after growth for 4, 16, or 48 h in HEY cells cultured in 1 % O2. However, PGAM1 gene induction was observed in OVCAR3 cells cultured in 1 % O2, and in HEY and OVCAR3 cells cultured in 0.2 % O2 for 16 and 48 h. The temporal changes in each gene are illustrated in Fig. 1.
Table 1.
Hypoxia regulated genes investigated
| Gene Name | Gene Symbol | Function | Relevance in ovarian cancer |
|---|---|---|---|
| Vascular endothelial growth factor | VEGF | Mediation of vascular permeability, angiogenesis, promotion of cell growth and migration, and inhibition of apoptosis. | [26–28] |
| Solute carrier family 2, member 1 (glucose transporter 1) | SLC2A1 (GLUT1) | Facilitates glucose transport and other substrates including pentoses and hexoses. | [28–31] |
| Phosphoglycerate mutase 1 | PGAM1 | Catalyzes the conversion of 3-phosphoglycerate to 2-phosphoglycerate in the glycolytic pathway. | |
| Lactate dehydrogenase A | LDHA | Catalyzes the conversion of L-lactate and NAD to pyruvate and NADH in the final step of anaerobic glycolysis. | |
| Prolyl 4-hydroxlase, α-polypeptide 1 | P4HA1 | Catalyzes the formation of 4-hydroxyproline that is critical for protein folding of procollagen chains. | |
| Adrenomedullin | ADM | Peptide hormone with hypotensive and vasodilator activity. In cancer ADM promotes neovascularization and has mitogenic activity. | [32–34] |
| N-myc downstream regulated 1 | NDRG1 | Stress-responsive protein involved in cell growth, differentiation and p53-mediated caspase activation and apoptosis. In cancer it has been reported to regulate tumor invasion, but in other models has demonstrated tumor suppressor activity. | [35, 36] |
| Aldolase A, fructose-bisphosphate | ALDOA | Catalyzes the conversion of fructose-1,6-bisphosphate to glyceraldehyde 3-phosphate and dihydroxyacetone phosphate. | |
| Carbonic anhydrase 9 | CA9 | Catalyzes the reversible hydration of carbon dioxide and functions in multiple biological processes including acid–base balance. | [9, 28] [37, 38] [39] |
Gene function as provided in GeneCards (www.genecards.org) is summarized and selected citations referring to gene protein products in ovarian cancers are referenced
Table 2.
Effect of oxygen levels on hypoxia regulated gene expression by cell line
| Gene | Cell line | Time | p-value for comparison of oxygen conditions | ||
|---|---|---|---|---|---|
| 21 vs 1 % | 21 vs 0.2 % | 1 vs 0.2 % | |||
| 4 h | 0.002 | 0.01 | 0.27 | ||
| HEY | 16 h | 0.04 | 0.0006 | 0.007 | |
| VEGFA | 48 h | 0.001 | <0.0001 | 0.001 | |
| 4 h | 0.37 | 0.02 | 0.09 | ||
| OVCAR-3 | 16 h | 0.0002 | <0.0001 | 0.003 | |
| 48 h | 0.003 | <0.0001 | 0.003 | ||
| 4 h | <0.0001 | <0.0001 | <0.0001 | ||
| HEY | 16 h | <0.0001 | <0.0001 | <0.0001 | |
| SLC2A1 | 48 h | <0.0001 | <0.0001 | 0.003 | |
| 4 h | 0.02 | 0.0003 | 0.006 | ||
| OVCAR-3 | 16 h | 0.0009 | 0.002 | 0.33 | |
| 48 h | <0.0001 | <0.0001 | <0.0001 | ||
| 4 h | 0.39 | 0.008 | 0.002 | ||
| HEY | 16 h | 0.38 | 0.07 | 0.27 | |
| PGAM1 | 48 h | 0.11 | 0.0006 | 0.26 | |
| 4 h | 0.17 | 0.0007 | 0.0002 | ||
| OVCAR-3 | 16 h | 0.0003 | <0.0001 | 0.02 | |
| 48 h | 0.0002 | <0.0001 | <0.0001 | ||
| 4 h | 0.40 | 0.05 | 0.01 | ||
| HEY | 16 h | <0.0001 | <0.0001 | 0.006 | |
| LDHA | 48 h | 0.0003 | <0.0001 | 0.03 | |
| 4 h | 0.04 | <0.0001 | 0.0004 | ||
| OVCAR-3 | 16 h | 0.003 | 0.0003 | 0.01 | |
| 48 h | 0.0004 | <0.0001 | 0.01 | ||
| 4 h | 0.001 | 0.18 | 0.007 | ||
| HEY | 16 h | <0.0001 | <0.0001 | 0.001 | |
| P4HA1 | 48 h | <0.0001 | <0.0001 | <0.0001 | |
| 4 h | 0.001 | 0.002 | 0.68 | ||
| OVCAR-3 | 16 h | <0.0001 | <0.0001 | 0.21 | |
| 48 h | <0.0001 | <0.0001 | 0.25 | ||
| 4 h | 0.002 | 0.16 | 0.009 | ||
| HEY | 16 h | 0.002 | 0.0004 | 0.14 | |
| ADM | 48 h | <0.0001 | <0.0001 | 0.002 | |
| 4 h | 0.02 | <0.0001 | 0.0004 | ||
| OVCAR-3 | 16 h | <0.0001 | <0.0001 | 0.75 | |
| 48 h | <0.0001 | <0.0001 | <0.0001 | ||
| 4 h | 0.0003 | 0.004 | <0.0001 | ||
| HEY | 16 h | <0.0001 | <0.0001 | <0.0001 | |
| NDRG1 | 48 h | <0.0001 | <0.0001 | 0.07 | |
| 4 h | <0.0001 | <0.0001 | 0.02 | ||
| OVCAR-3 | 16 h | <0.0001 | <0.0001 | 0.05 | |
| 48 h | <0.0001 | <0.0001 | 0.71 | ||
| 4 h | 0.006 | 0.0005 | 0.04 | ||
| HEY | 16 h | 0.04 | 0.002 | 0.04 | |
| ALDOA | 48 h | 0.03 | 0.0006 | 0.11 | |
| 4 h | 0.03 | 0.005 | 0.19 | ||
| OVCAR-3 | 16 h | 0.003 | 0.0003 | 0.02 | |
| 48 h | 0.002 | <0.0001 | 0.003 | ||
| 4 h | 0.13 | 0.12 | 0.97 | ||
| HEY | 16 h | 0.008 | <0.0001 | 0.0003 | |
| CA9 | 48 h | 0.01 | <0.0001 | <0.0001 | |
| 4 h | 0.002 | 0.002 | 0.91 | ||
| OVCAR-3 | 16 h | 0.02 | 0.04 | 0.59 | |
| 48 h | <0.0001 | <0.0001 | 0.17 | ||
Fig. 1.

Temporal changes in hypoxia regulated gene expression in ovarian cancer cell lines cultured in hypoxic conditions relative to normoxic conditions. Cells were cultured for 4, 16, and 48 h in normoxia, 1 %, and 0.2 % O2. OVCAR-3 cells 1 % O2 = solid circles; OVCAR-3 cells 0.2 % O2 = solid boxes, HEY cells 1 % O2 = open diamond, and HEY cells 0.2 % O2 = open triangle
Hypoxia Biomarker Assessment in HEY Intraperitoneal Xenograft Tumors
To assess if the HEY ovarian intraperitoneal xenograft tumors have a fraction of cells that are hypoxic, we injected HEY cells into the intraperitoneal cavity of nude mice and hypoxia biomarkers were measured after 21 days of growth (Fig. 2a). One representative tumor implant was examined from each mouse (N = 3). H&E stains were performed on each sample to confirm the tissue studied had measurable tumor cells. To assess the hypoxic fraction in each tumor, pimonidazole was administered to mice 4 h prior to euthanasia. Anti-pimonidazole staining was performed. Pimonidazole (1-[(2-hydroxy-3-piperidinyl)propyl]-2-nitroimidazole), is a well characterized and validated chemical probe for hypoxia in normal and tumor tissue where it is reductively-activated and covalently bound to macromolecules in hypoxic cells. Following intravenous injection pimonidazole distributes throughout the body where it covalently binds to normal and tumor tissue regions that have ≤ 14 micromolar dissolved oxygen concentration which corresponds to a pO2 of ≤ 10 mmHg at 37 °C. Pimonidazole adducts can be detected by specially prepared antibodies [see [18] for a review of bioreductive hypoxia biomarkers]. IHC analysis and scoring of percent area stained demonstrated an average hypoxic fraction of 30 % in xenograft #1, 40 % in xenograft #2, and 15 % in xenograft #3. Staining was heterogenous across each tumor section as shown in Fig. 2a. CA IX is another commonly used protein biomarker for hypoxia since it is regulated by HIF-1α and is more stable than HIF-1α. CA IX is frequently used in conjunction with pimonidazole staining to assess hypoxic status of tumor tissue [19]. CA IX expression was measured by IHC and scored by a board certified pathologist as described in the Methods. Staining for xenograft #1 was 90 % stained with a score of 270, xenograft #2 was 100 % with a score of 250, and xenograft #3 was 90 % stained with a score of 300. Together these studies suggest that HEY xenograft tumors have a high fraction of hypoxic regions.
Fig. 2.

Hypoxia biomarker expression in HEY intraperitoneal xenograft tumors. a. Tumors from three mice with intraperitoneal HEY xenograft tumors were excised and fixed tissue was stained for H&E, pimonidazole adducts, and CA IX protein expression. The picture inserts were taken with a 40X objective lens and the larger pictures were taken with a 10X objective. b. Relative hypoxia gene expression in HEY intraperitoneal xenograft tumors is elevated compared to HEY cells cultured in vitro in normoxia. Fold change of each gene in xenograft vs cells cultured in normoxia for each xenograft tumor is shown using a different symbol: xenograft 1 = closed circle, xenograft 2 = open circle, and xenograft three = triangle. There were statistically significant differences (p=/< 0.05) for all genes in the xeograft tissue vs HEY cells cultured in normoxia in vitro
Hypoxia Regulated Gene Panel Expression in HEY Intraperitoneal Xenograft Tumors
Hypoxia regulated gene expression was compared in HEY xenograft tumor tissue vs HEY cells cultured in normoxia using qRT-PCR (Fig. 2b). When compared to HEY cells cultured in normoxia for 4 h there was a greater expression of all genes in the panel in the xenograft tissue, with the highest expression (xenograft gene expression/cells cultured in normoxia) observed in VEGFA, P4HA1 and CA9.
Hypoxia Regulated Gene Panel Expression Measured by qRT-PCR in Patient Primary and Metastatic Cancers
In order to ensure that the expression of the hypoxia regulated genes investigated in the two cell line models were also detectable in ovarian cancer samples, we isolated RNA from frozen tissue (both primary and metastatic lesions) obtained from five subjects with metastatic high grade serous ovarian cancer. When gene expression from the primary ovary were compared to HEY cells cultured in normoxia for 48 h (Table 3), hypoxia regulated gene expression was increased for 8 of 9 genes, with VEGFA (P = <0.0001), P4HA1 (P = 0.003) and CA9 (P = <0.0001) having the highest elevations. Although SLCA1, PGAM-1, ADM, NDRG1, and ALDOA showed elevated expression in some samples, these gene expression levels were not found to be statistically different from HEY cells cultured in normoxia. Interestingly, LDHA showed lower expression in ovarian samples compared to HEY cells cultured in normoxia. There was no statistical differences observed in gene expression between primary versus metastatic tissue in matched cases. We did not compare expression to normal ovary tissue because we did not have access to frozen normal ovary tissue at the time of this study was conducted. To confirm that VEGF-A and CA IX proteins were expressed in specimens from the same 5 patients from whom frozen tissue samples were obtained, tissue sections were obtained from FFPE tissue blocks and stained by IHC. The frozen tissue used for qRT-PCR analysis was not used for IHC staining due to staining artifacts observed in frozen vs FFPE tissue. No IHC assay was available for the P4HA1. Both VEGF-A and CA IX heterogeneous protein expression was observed in primary and metastatic cancer tissue from all 5 patient cases (data not shown).
Table 3.
Hypoxia regulated gene expression in primary and metastatic ovarian cancer samples
| Gene | Tissue Location | Case 1 | Case 2 | Case 3 | Case 4 | Case 5 |
|---|---|---|---|---|---|---|
| VEGF-A | Primary | 5.02 | 15.89 | 6.71 | 11.47 | 6.93 |
| Met** | 9.36 | 12.01 | 23.21 | 7.62, 15.24 | 8.4, 2.05 * | |
| SLC2A1 | Primary | 0.75 | 2.71 | 0.90 | 1.02 | 1.76 |
| Met | 1.35 | 1.79 | 2.76 | 0.58, 1.23 | 2.34, 0.50* | |
| PGAM-1 | Primary | 0.28 | 0.20 | 1.19 | 0.81 | - |
| Met | 0.23 | 1.07 | 1.09 | 0.94, 2.13 | - | |
| LDH-A | Primary | 0.26 | 0.22 | 0.2 | 0.49 | 0.03 |
| Met | 0.52 | 0.3 | 0.98 | 0.39, 0.78 | 0.20* | |
| P4HA1 | Primary | 2.71 | 1.75 | 5.05 | 7.41 | 1.16 |
| Met | 3.14 | 8.1 | 6.76 | 7.18, 8.21 | 0.41, 0.02 | |
| ADM | Primary | 0.17 | 0.79 | 0.76 | 0.57 | 0.05 |
| Met | 0.59 | 1.33 | 1.58 | 0.49, 1.05 | 0.14, 0.01* | |
| NDRG1 | Primary | 0.95 | 2.85 | 3.47 | 3.10 | 0.83 |
| Met | 2.51 | 4.13 | 4.95 | 1.86, 4.64 | 0.94, 0.08* | |
| ALDOA | Primary | 0.77 | 1.11 | 2.08 | 1.99 | 1.78 |
| Met | 1.66 | 1.96 | 2.58 | 1.40, 2.21 | 1.82, 0.66* | |
| CA9 | Primary | 11.34 | 7.52 | 30.27 | 25.63 | 12.67 |
| Met | 6.03 | 25.69 | 36.00 | 27.54, 39.67 | 2.74* |
Fold difference in gene expression measured by qRT-PCR in patient frozen ovarian tissue compared to HEY ovarian cancer cells grown in normoxia
*denotes values for the contralateral ovary, not metastatic tumor tissue
**met = metastasis
Hypoxia Regulated Gene Panel Expression in the Human TCGA Database
Hypoxia can be heterogeneous and cyclic in nature. To explore the heterogeneity in expression of the nine hypoxia regulated genes in publically available datasets, we used the cDNA microarray data in the TCGA. A broader range of expression values were observed for tumor tissue compared to normal ovary for all nine genes (Supplemental Fig 1). We also investigated whether there was a significant difference in expression values for the nine hypoxia regulated genes in normal ovarian tissue vs ovarian tissue. VEGF-A, SLC2A1, LDHA and CA9 were all significantly different between normal ovary tissue and primary cancer tissue (Table 4). Analysis of variance showed all four of these genes as having a p value <0.05 but VEGFA was the most significantly varying gene among the nine genes. There were only 8 normal ovary tissues reported on in this data set as compared to 569 primary cancer tissues. Therefore, results obtained from this data set must be cautiously considered.
Table 4.
TCGA ANOVA analysis for the 9 hypoxia regulated gene panel
| Symbol | ID | Log Fold Change | Average Expression |
t | P value |
|---|---|---|---|---|---|
| VEGFA | 210512_s_at | 2.01 | 7.76 | 7.43 | <0.0001 |
| LDHA | 200650_s_at | 0.50 | 11.61 | 3.01 | 0.003 |
| SLC2A1 | 201249_at | 0.95 | 7.22 | 2.77 | 0.006 |
| CA9 | 205199_at | 0.88 | 4.74 | 2.10 | 0.04 |
| PGAM1 | 200886_s_at | 0.35 | 10.39 | 1.83 | 0.07 |
| NDRG1 | 200632_s_at | 0.58 | 9.24 | 1.73 | 0.08 |
| ADM | 202912_at | 0.54 | 6.66 | 1.13 | 0.3 |
| P4HA1 | 207543_s_at | 0.25 | 8.06 | 0.96 | 0.3 |
| ALDOA | 200966_x_at | 0.11 | 11.51 | 0.80 | 0.4 |
Evaluation of a Multiplex qNPA Assay to Measure the Hypoxia Regulated Gene Panel
We designed a custom multiplex gene qNPA assay consisting of 38 total genes, including the 9 hypoxia regulated genes, and four housekeeper genes. For the purpose of the current study we only analyzed these 13 genes. The other 25 genes will be reported on in a different study. We compared a subset of ovarian cancer cell line samples for qNPA prepared in parallel with samples used for evaluation by qRT-PCR (the samples reported on in Table 2). Similar changes in gene expression in cells cultured in normoxia compared to hypoxia for 48 h were observed on the qNPA array as for qRT-PCR (Table 5). Similar expression values (data not shown) were also observed at the other timepoints and oxygen conditions evaluated by qRT-PCR in Table 2. It should be noted that gene primer sequences were not the same between assays and relative expression was calculated using different methodology. Therefore, we did not do formal statistical analysis to directly compare values for each gene across platforms. However, confidence intervals were calculated.
Table 5.
Cross-assay comparison of qRT-PCR vs qNPA
| Gene Symbol | OVCAR-3 48 h (0.2 % O2 relative to normoxia) |
HEY 48 h (0.2 % O2 relative to normoxia) |
||
|---|---|---|---|---|
| qRT-PCR | qNPA | qRT-PCR | qNPA | |
| VEGF | 4.26 | 6.97 | 3.3 | 3.35 |
| SLC2A1 | 4.13 | 3.02 | 3.66 | 2.14 |
| PGAM1 | 5.29 | 1.73 | 1.95 | 1.69 |
| LDHA | 8.3 | 3.40 | 5.02 | 2.39 |
| P4HA1 | 5.45 | 11.69 | 5.36 | 3.27 |
| ADM | 20.97 | 20.70 | 1.75 | 2.41 |
| NDRG1 | 6.84 | 11.69 | 5.4 | 5.67 |
| ALDOA | 5.31 | 4.35 | 2.75 | 2.21 |
| CA9 | 3.96 | 5.21 | 7.52 | T/F† |
Cell lines were cultured and in parallel and analyzed by qRT-PCR or qNPA
† Technical failure; CV value >30 % cutoff
Culture in Acidic Media Does not Impact Expression of the Hypoxia Regulated Gene Panel
Growth under hypoxic conditions is often associated with a decreased extracellular pH (pHe) due to an increase in glycolytic metabolism which generates lactic acid [20]. To determine if acidic growth conditions impact the expression of the hypoxia regulated gene panel used for this current study, we cultured HEY and OVCAR-3 cells in neutral (pH 7.3) media and in media 20 mM lactic acid pH’d to 6.7. Using the qNPA assay we investigated the 9 hypoxia regulated genes and as a positive control, we investigated the gene expression changes of thioredoxin interacting protein (TXNIP) (also included on the qNPA array) which has been previously shown to be modulated by acidic conditions [21]. Growth in media at 20 mM lactic acid pH 6.7 resulted in minor, non-significant, changes in gene expression in the hypoxia regulated genes. At isolated time points there were increases in GLUT1, NDRG1, and CA9 gene expression, but were not consistent across all time points or cell lines investigated (data not shown). The positive control gene TXNIP demonstrated modest induction of TXNIP in response to 48 h of culture in hypoxia (1 %) and greater than 3 fold induction following culture in acidic media in both HEY and OVCAR-3 cells (Supplemental Fig 2).
Hypoxia Regulated Gene Panel Expression Measured by the qNPA in Patient Primary and Metastatic Cancers
Using FFPE tissue sections from the same five patient cases analyzed using qRT-PCR described above and FFPE tissue from 4 normal ovaries, we evaluated the expression of the 9 gene hypoxia regulated panel. Intensity values for the normal ovaries compared to primary and metastatic tissues are shown in Fig. 3. Although there was a trend for significance between normal and primary and normal and metastatic tumors, none of the comparisons reached p-values <0.05. Although this data set is too small to draw conclusions regarding the ability of this gene panel to serve as a biomarker for hypoxia in clinical samples, it does demonstrate the feasibility to use FFPE ovarian tissues to analyze gene expression using the qNPA assay.
Fig. 3.
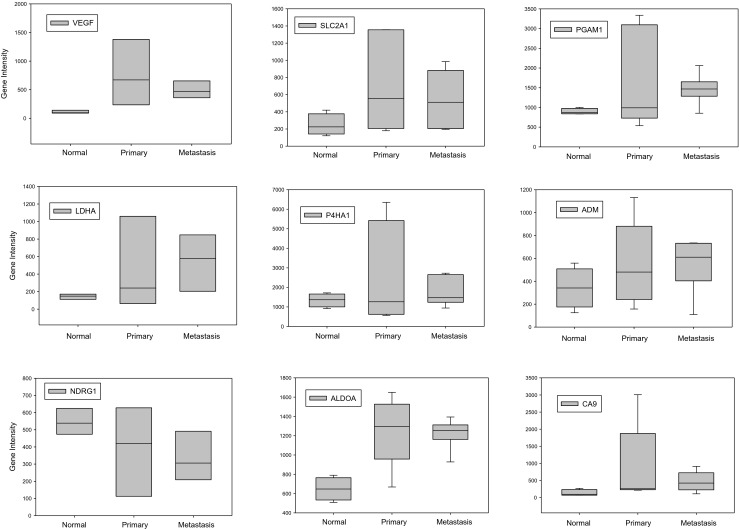
Hypoxia regulated gene panel expression measured by qNPA in normal ovary (n = 4) compared to paired primary and metastatic high grade serous ovarian cancer FFPE tissue (n = 5). Expression is expressed as gene intensity values
Discussion
Modulation of gene expression in response to stress is differentially regulated in normal vs cancer tissue. Stress responses also vary across different tumor types and are context and time dependent. Our current study confirmed the hypoxia inducible expression of a nine gene panel in ovarian cancer cell lines which were previously identified as part of a larger hypoxia gene expression signature evaluated in clinical head and neck and breast cancers [15]. We evaluated a time course for gene induction representing acute (4 h) and chronic (48 h) culture in hypoxic conditions. We also evaluated the changes in gene expression in cells grown in moderate hypoxia (1 %) and severe hypoxia (0.2 %). Although the magnitude of gene expression changes was variable across growth conditions and time, all nine genes were upregulated by growth in hypoxia. The elevation of these genes in HEY xenograft tissue compared relative to HEY cells cultured in normoxia was consistent with expression of the exogenous hypoxia biomarker pimonidazole and expression of CA IX, a hypoxia regulated protein.
In high grade serous ovarian cancer tissues, we observed a heterogeneous range of expression values for the genes evaluated. However, VEGF-A was one of the consistently elevated genes across both primary and metastatic cancer tissues analyzed by qRT-PCR and qNPA. VEGF gene expression was also significantly higher in cancer vs normal tissues including the TCGA data set investigated which included a broad mix of tumor subtypes. Given the multiple studies in the literature demonstrating the prognostic and therapeutic significance of VEGF-A protein expression in ovarian cancers these findings are not surprising. However, VEGF-A gene expression can be regulated by multiple factors in addition to hypoxia and therefore its expression must be considered in context with expression of other hypoxia markers.
Tumor acidosis is a feature of the microenvironment which is commonly spatially and mechanistically related to hypoxia and angiogenesis [22]. The expression of the nine hypoxia regulated genes investigated in this study appears to be regulated independently of lactic acidosis in the HEY and OVCAR-3 cell lines. However, lactate has been shown to activate HIF-1α in cells with oxidative but not Warburg-phenotypes [23]. Therefore, it is possible that the HIF-1α target genes included in our hypoxia gene panel could be regulated in some tumors by lactic acid in addition to hypoxia.
Hypoxia is cyclic and heterogeneous across tumor tissue and is influenced by tumor perfusion and oxygen consumption rates. The differences in hypoxia between primary and metastatic sites are not well characterized in ovarian tumors. Differences in copy number variation and metabolic profiles for matched ovarian primary and peritoneal metastasis [24, 25] have been recently reported. Both of these studies suggest that there are important differences between primary and metastatic tissue that may inform the pathobiology of carcinogenesis and microenvironmental influences. In the small set of patient tissues we analyzed we did not observe significant differences between different metastatic tissues analyzed from individual patients. However, these factors must be considered in future clinical evaluation of hypoxia biomarkers in ovarian cancer, including gene expression signatures. Understanding the potential for variability (tumor heterogeneity) across sampling locations will be important for developing optimal tissue sample collection strategies.
In order to more easily explore the prognostic and predictive potential of this hypoxia regulated gene panel a much larger set of clinical samples will need to be evaluated and compared to traditional protein biomarkers of hypoxia. There are advantages of utilizing a panel composed of only nine genes, including the ease of measurement, analysis, and ability to cross-validate observations with protein expression. Our study demonstrates the technical feasibility of the multiplex qNPA assay for the nine gene hypoxia signature for analysis of clinical samples, which are most frequently formalin fixed and paraffin embedded. The qNPA assay does not require RNA extraction or amplification and can be performed using an automated platform. Our study supports further investigation of the nine gene hypoxia panel measured using the qNPA multiplex assay to explore the hypoxia phenotype in ovarian cancers.
Electronic supplementary material
Figure 3. Box plots of the expression levels (log2) of hypoxia regulated genes in normal ovary and primary ovarian tumor microarray tissue samples from TCGA database. Distribution of data is shown through their quartiles. The box is drawn around the first and third quartile and the median is represented by the bold line in the box. The lines extending from the top and bottom of the box are 1.5 times the interquartile range from the box. The values higher or lower than these limits are plotted as dots. (PPTX 136 kb)
TXNIP expression in ovarian cell lines grown in hypoxia or acidic conditions. Cells were grown for 48 h and gene levels measured by qNPA. Fold change was calculated by dividing intensity values from cells cultured in hypoxia or acidic conditions by intensity values from cells cultured for the same time in normal growth media pH 7.3. (PPTX 47 kb)
Acknowledgments
This publication was made possible by funding from the Women’s Cancers Better Than Ever Program at the University of Arizona Cancer Center and grants R01 CA125627 and P30 CA023074 from the National Cancer Institute. Its contents are solely the responsibility of the authors and do not necessarily represent the official views of the National Cancer Institute. In addition we would like to thank Dr. Ray Nagle, Kathy McDaniel, and Ed Abril at the Tissue Acquisition and Cellular/Molecular Analysis Core at the University of Arizona Cancer Center and Gillian Paine at the Experimental Mouse Shared Service Core at the University of Arizona Cancer Center for their technical assistance in completing this work. We would also like to thank HTG Molecular for their assistance.
Conflict of Interest
A.F. Baker is a paid consultant for HTG Molecular, the company that developed the qNPA hypoxia array. The other authors have nothing to disclose.
References
- 1.Ruan K, Song G, Ouyang G. Role of hypoxia in the hallmarks of human cancer. J Cell Biochem. 2009;107(6):1053–1062. doi: 10.1002/jcb.22214. [DOI] [PubMed] [Google Scholar]
- 2.Harrison L, Blackwell K. Hypoxia and anemia: factors in decreased sensitivity to radiation therapy and chemotherapy? Oncologist. 2004;9(Suppl 5):31–40. doi: 10.1634/theoncologist.9-90005-31. [DOI] [PubMed] [Google Scholar]
- 3.Birner P, Schindl M, Obermair A, Breitenecker G, Oberhuber G. Expression of hypoxia-inducible factor 1alpha in epithelial ovarian tumors: its impact on prognosis and on response to chemotherapy. Clin Cancer Res. 2001;7(6):1661–1668. [PubMed] [Google Scholar]
- 4.Hazelton DA, Hamilton TC. Vascular endothelial growth factor in ovarian cancer. Curr Oncol Rep. 1999;1(1):59–63. doi: 10.1007/s11912-999-0011-9. [DOI] [PubMed] [Google Scholar]
- 5.Chambers SK, Clouser MC, Baker AF, Roe DJ, Cui H, Brewer MA, Hatch KD, Gordon MS, Janicek MF, Isaacs JD, Gordon AN, Nagle RB, Wright HM, Cohen JL, Alberts DS. Overexpression of tumor vascular endothelial growth factor A may portend an increased likelihood of progression in a phase II trial of bevacizumab and erlotinib in resistant ovarian cancer. Clin Cancer Res. 2010;16(21):5320–5328. doi: 10.1158/1078-0432.CCR-10-0974. [DOI] [PMC free article] [PubMed] [Google Scholar]
- 6.Bamias A, Pignata S, Pujade-Lauraine E. Angiogenesis: a promising therapeutic target for ovarian cancer. Crit Rev Oncol Hematol. 2012;84(3):314–326. doi: 10.1016/j.critrevonc.2012.04.002. [DOI] [PubMed] [Google Scholar]
- 7.Khosravi-Shahi P, Cabezon-Gutierrez L. Antiangiogenic drugs in the treatment of advanced epithelial ovarian cancer. Anticancer Agents Med Chem. 2012;12(8):982–987. doi: 10.2174/187152012802650020. [DOI] [PubMed] [Google Scholar]
- 8.Betts GN, Eustace A, Patiar S, Valentine HR, Irlam J, Ramachandran A, Merve A, Homer JJ, Moller-Levet C, Buffa FM, Hall G, Miller CJ, Harris AL, West CM. Prospective technical validation and assessment of intra-tumour heterogeneity of a low density array hypoxia gene profile in head and neck squamous cell carcinoma. Eur J Cancer. 2013;49(1):156–165. doi: 10.1016/j.ejca.2012.07.028. [DOI] [PubMed] [Google Scholar]
- 9.Williams E, Martin S, Moss R, Durrant L, Deen S. Co-expression of VEGF and CA9 in ovarian high-grade serous carcinoma and relationship to survival. Virchows Arch. 2012;461(1):33–39. doi: 10.1007/s00428-012-1252-9. [DOI] [PubMed] [Google Scholar]
- 10.Milosevic M, Fyles A, Hedley D, Hill R. The human tumor microenvironment: invasive (needle) measurement of oxygen and interstitial fluid pressure. Semin Radiat Oncol. 2004;14(3):249–258. doi: 10.1016/j.semradonc.2004.04.006. [DOI] [PubMed] [Google Scholar]
- 11.Le QT, Courter D. Clinical biomarkers for hypoxia targetin. Cancer Metastasis Rev. 2008;27(3):351–362. doi: 10.1007/s10555-008-9144-9. [DOI] [PMC free article] [PubMed] [Google Scholar]
- 12.Ljungkvist AS, Bussink J, Kaanders JH, van der Kogel AJ. Dynamics of tumor hypoxia measured with bioreductive hypoxic cell markers. Radiat Res. 2007;167(2):127–145. doi: 10.1667/RR0719.1. [DOI] [PubMed] [Google Scholar]
- 13.Kaluz S, Kaluzova M, Liao SY, Lerman M, Stanbridge EJ. Transcriptional control of the tumor- and hypoxia-marker carbonic anhydrase 9: a one transcription factor (HIF-1) show? Biochim Biophys Acta. 2009;1795(2):162–172. doi: 10.1016/j.bbcan.2009.01.001. [DOI] [PMC free article] [PubMed] [Google Scholar]
- 14.Chi JT, Wang Z, Nuyten DS, Rodriguez EH, Schaner ME, Salim A, Wang Y, Kristensen GB, Helland A, Borresen-Dale AL, Giaccia A, Longaker MT, Hastie T, Yang GP, van d, V, Brown PO (2006) Gene expression programs in response to hypoxia: cell type specificity and prognostic significance in human cancers. PLoS Med 3(3):e47 [DOI] [PMC free article] [PubMed]
- 15.Buffa FM, Harris AL, West CM, Miller CJ. Large meta-analysis of multiple cancers reveals a common, compact and highly prognostic hypoxia metagene. Br J Cancer. 2010;102(2):428–435. doi: 10.1038/sj.bjc.6605450. [DOI] [PMC free article] [PubMed] [Google Scholar]
- 16.Roberts RA, Sabalos CM, LeBlanc ML, Martel RR, Frutiger YM, Unger JM, Botros IW, Rounseville MP, Seligmann BE, Miller TP, Grogan TM, Rimsza LM. Quantitative nuclease protection assay in paraffin-embedded tissue replicates prognostic microarray gene expression in diffuse large-B-cell lymphoma. Lab Investig. 2007;87(10):979–997. doi: 10.1038/labinvest.3700665. [DOI] [PubMed] [Google Scholar]
- 17.Livak KJ, Schmittgen TD. Analysis of relative gene expression data using real-time quantitative PCR and the 2(−Delta Delta C(T)) Method. Methods. 2001;25(4):402–408. doi: 10.1006/meth.2001.1262. [DOI] [PubMed] [Google Scholar]
- 18.Ljungkvist AS, Bussink J, Kaanders JH, van der Kogel AJ. Dynamics of tumor hypoxia measured with bioreductive hypoxic cell markers. Radiat Res. 2007;167(2):127–145. doi: 10.1667/RR0719.1. [DOI] [PubMed] [Google Scholar]
- 19.Shin KH, Az-Gonzalez JA, Russell J, Chen Q, Burgman P, Li XF, Ling CC. Detecting changes in tumor hypoxia with carbonic anhydrase IX and pimonidazole. Cancer Biol Ther. 2007;6(1):70–75. doi: 10.4161/cbt.6.1.3550. [DOI] [PubMed] [Google Scholar]
- 20.Brahimi-Horn MC, Bellot G, Pouyssegur J. Hypoxia and energetic tumour metabolism. Curr Opin Genet Dev. 2011;21(1):67–72. doi: 10.1016/j.gde.2010.10.006. [DOI] [PubMed] [Google Scholar]
- 21.Chen JL, Merl D, Peterson CW, Wu J, Liu PY, Yin H, Muoio DM, Ayer DE, West M, Chi JT. Lactic acidosis triggers starvation response with paradoxical induction of TXNIP through MondoA. PLoS Genet. 2010;6(9):e1001093. doi: 10.1371/journal.pgen.1001093. [DOI] [PMC free article] [PubMed] [Google Scholar]
- 22.Mayer A, Vaupel P. Hypoxia, lactate accumulation, and acidosis: siblings or accomplices driving tumor progression and resistance to therapy? Adv Exp Med Biol. 2013;789:203–209. doi: 10.1007/978-1-4614-7411-1_28. [DOI] [PubMed] [Google Scholar]
- 23.de Saedeleer CJ, Copetti T, Porporato PE, Verrax J, Feron O, Sonveaux P. Lactate activates HIF-1 in oxidative but not in Warburg-phenotype human tumor cells4. PLoS One. 2012;7(10):e46571. doi: 10.1371/journal.pone.0046571. [DOI] [PMC free article] [PubMed] [Google Scholar]
- 24.Malek JA, Mery E, Mahmoud YA, Al-Azwani EK, Roger L, Huang R, Jouve E, Lis R, Thiery JP, Querleu D, Rafii A. Copy number variation analysis of matched ovarian primary tumors and peritoneal metastasis. PLoS One. 2011;6(12):e28561. doi: 10.1371/journal.pone.0028561. [DOI] [PMC free article] [PubMed] [Google Scholar]
- 25.Fong MY, McDunn J, Kakar SS. Identification of metabolites in the normal ovary and their transformation in primary and metastatic ovarian cancer. PLoS One. 2011;6(5):e19963. doi: 10.1371/journal.pone.0019963. [DOI] [PMC free article] [PubMed] [Google Scholar]
- 26.Yu L, Deng L, Li J, Zhang Y, Hu L. The prognostic value of vascular endothelial growth factor in ovarian cancer: a systematic review and meta-analysis. Gynecol Oncol. 2013;128(2):391–396. doi: 10.1016/j.ygyno.2012.11.002. [DOI] [PubMed] [Google Scholar]
- 27.Bandiera E, Franceschini R, Specchia C, Bignotti E, Trevisiol C, Gion M, Pecorelli S, Santin AD, Ravaggi A (2012) Prognostic significance of vascular endothelial growth factor serum determination in women with ovarian cancer. ISRN Obstet Gynecol 2012:245756 [DOI] [PMC free article] [PubMed]
- 28.Kim K, Park WY, Kim JY, Sol MY, Shin DH, Park DY, Lee CH, Lee JH, Choi KU. Prognostic relevance of the expression of CA IX, GLUT-1, and VEGF in ovarian epithelial cancers. Korean J Pathol. 2012;46(6):532–540. doi: 10.4132/KoreanJPathol.2012.46.6.532. [DOI] [PMC free article] [PubMed] [Google Scholar]
- 29.Cho H, Lee YS, Kim J, Chung JY, Kim JH. Overexpression of glucose transporter-1 (GLUT-1) predicts poor prognosis in epithelial ovarian cancer. Cancer Investig. 2013;31(9):607–615. doi: 10.3109/07357907.2013.849722. [DOI] [PubMed] [Google Scholar]
- 30.Airley R, Evans A, Mobasheri A, Hewitt SM. Glucose transporter Glut-1 is detectable in peri-necrotic regions in many human tumor types but not normal tissues: study using tissue microarrays. Ann Anat. 2010;192(3):133–138. doi: 10.1016/j.aanat.2010.03.001. [DOI] [PMC free article] [PubMed] [Google Scholar]
- 31.Semaan A, Munkarah AR, Arabi H, Bandyopadhyay S, Seward S, Kumar S, Qazi A, Hussein Y, Morris RT, Li-Fehmi R. Expression of GLUT-1 in epithelial ovarian carcinoma: correlation with tumor cell proliferation, angiogenesis, survival and ability to predict optimal cytoreduction. Gynecol Oncol. 2011;121(1):181–186. doi: 10.1016/j.ygyno.2010.11.019. [DOI] [PubMed] [Google Scholar]
- 32.Hata K, Takebayashi Y, Akiba S, Fujiwaki R, Iida K, Nakayama K, Nakayama S, Fukumoto M, Miyazaki K. Expression of the adrenomedullin gene in epithelial ovarian cancer. Mol Hum Reprod. 2000;6(10):867–872. doi: 10.1093/molehr/6.10.867. [DOI] [PubMed] [Google Scholar]
- 33.Baranello C, Mariani M, Andreoli M, Fanelli M, Martinelli E, Ferrandina G, Scambia G, Shahabi S, Ferlini C. Adrenomedullin in ovarian cancer: foe in vitro and friend in vivo? 1. PLoS One. 2012;7(7):e40678. doi: 10.1371/journal.pone.0040678. [DOI] [PMC free article] [PubMed] [Google Scholar]
- 34.Frede S, Freitag P, Otto T, Heilmaier C, Fandrey J. The proinflammatory cytokine interleukin 1beta and hypoxia cooperatively induce the expression of adrenomedullin in ovarian carcinoma cells through hypoxia inducible factor 1 activation 2. Cancer Res. 2005;65(11):4690–4697. doi: 10.1158/0008-5472.CAN-04-3877. [DOI] [PubMed] [Google Scholar]
- 35.Lv XH, Chen JW, Zhao G, Feng ZZ, Yang DH, Sun WW, Fan JS, Zhu GH. N-myc downstream-regulated gene 1/Cap43 may function as tumor suppressor in endometrial cancer. J Cancer Res Clin Oncol. 2012;138(10):1703–1715. doi: 10.1007/s00432-012-1249-4. [DOI] [PMC free article] [PubMed] [Google Scholar]
- 36.Wang B, Li J, Ye Z, Li Z, Wu X. N-myc downstream regulated gene 1 acts as a tumor suppressor in ovarian cancer. Oncol Rep. 2014;31(5):2279–2285. doi: 10.3892/or.2014.3072. [DOI] [PubMed] [Google Scholar]
- 37.Choschzick M, Oosterwijk E, Muller V, Woelber L, Simon R, Moch H, Tennstedt P. Overexpression of carbonic anhydrase IX (CAIX) is an independent unfavorable prognostic marker in endometrioid ovarian cancer. Virchows Arch. 2011;459(2):193–200. doi: 10.1007/s00428-011-1105-y. [DOI] [PubMed] [Google Scholar]
- 38.Hunakova L, Bodo J, Chovancova J, Sulikova G, Pastorekova S, Sedlak J. Expression of new prognostic markers, peripheral-type benzodiazepine receptor and carbonic anhydrase IX, in human breast and ovarian carcinoma cell lines. Neoplasma. 2007;54(6):541–548. [PubMed] [Google Scholar]
- 39.Hynninen P, Vaskivuo L, Saarnio J, Haapasalo H, Kivela J, Pastorekova S, Pastorek J, Waheed A, Sly WS, Puistola U, Parkkila S. Expression of transmembrane carbonic anhydrases IX and XII in ovarian tumours. Histopathology. 2006;49(6):594–602. doi: 10.1111/j.1365-2559.2006.02523.x. [DOI] [PubMed] [Google Scholar]
Associated Data
This section collects any data citations, data availability statements, or supplementary materials included in this article.
Supplementary Materials
Figure 3. Box plots of the expression levels (log2) of hypoxia regulated genes in normal ovary and primary ovarian tumor microarray tissue samples from TCGA database. Distribution of data is shown through their quartiles. The box is drawn around the first and third quartile and the median is represented by the bold line in the box. The lines extending from the top and bottom of the box are 1.5 times the interquartile range from the box. The values higher or lower than these limits are plotted as dots. (PPTX 136 kb)
TXNIP expression in ovarian cell lines grown in hypoxia or acidic conditions. Cells were grown for 48 h and gene levels measured by qNPA. Fold change was calculated by dividing intensity values from cells cultured in hypoxia or acidic conditions by intensity values from cells cultured for the same time in normal growth media pH 7.3. (PPTX 47 kb)