Abstract
Background
Multiple Sclerosis (MS) is a disease with high disabling disorders and considerable social and economic impacts. This study was conducted to analyze the spatial distribution of MS disease in Tehran, Iran during 2001-2012.
Methods
The existing information in the MS patients’ medical files who had registered in Iranian MS Society (IMSS), located in Tehran office, was used for analysis. The relationship between diseases incidences in 22 zones of Tehran based on estimated socio-economic status (SES) of each zone was evaluated. High and low clustering approach was used in order to investigate the disease’s distribution pattern meanwhile, Getis Ord’s Gi test and Hot Spot analysis approach has been used to detect high risk zones of the disease.
Results
A total of 6027 MS patients were registered between 2001- 2012 which 4580 (%75.99) were women. During the study period, zone number 6 figured as the most high risk zone for the disease (P<0.1). A heterogeneous distribution was shown for the disease. Cumulative incidence of the disease in northern zones (101.73 per 100,000 inhabitants) was two times more of Southern zones (53.79 per 100,000 inhabitants). There seems to be a direct linear relationship between estimated incidence rate of the disease in each zones with the level of SES (P<0.001).
Conclusion
Heterogeneous geographical distribution of MS and its higher estimated incidence for northern zones in Tehran may be because of higher SES and other factors in mentioned zones. It is recommended to consider the surveillance with long-term and cost-effective interventional strategies along with disease in high risk zones.
Keywords: Multiple sclerosis, Geographic information system (GIS), Spatial analysis
Introduction
Multiple Sclerosis (MS) is a disease with high disabling disorders and considerable social and economic impact. It is the biggest cause of non-injury related disability in young adults (1). Pathology of the disease is still unknown but environmental, genetic and immunological factors are mentioned as effective agents (2). This disease is characterized with multiple neurological disorders and symptoms including vision, sensory, body weakness, difficulties in walking and abdominal and bladder disorders due to irreversible functional disability. The most common symptom for diagnosis is fatigue along interfering their quality of life and fertility which 80% of the patients experienced it (1). This disease has various clinical courses and almost 85% of patients suffer from relapsing-remitting multiple sclerosis (RRMS) clinical course. Particular feature of this course is acute attacks with new or recent neurological symptoms along with partial and complete recovery (2). Total number of MS patients around the world is estimated to be 2-2.5 million individuals (2). In a systematic review study, the annual cost of multiple sclerosis disease in US was ranged from $8528-$54,244 per patient (3).
In 2010, a study was conducted in Tehran province which calculated MS prevalence to be 51.9 per 100,000 inhabitants(4) and in another study, the periodic prevalence of MS disease from April 2003 to July 2010 was reported to be 73.7 per 100,000 inhabitants and incidence rate of disease was calculated to be 9.1 per 100,000 inhabitants (5). In 2007, in a study in Mazandaran province -northern Iran - the periodic prevalence of MS disease was 20.1 per 100,000 inhabitants (6). Meanwhile, The prevalence and incidence of MS disease has been reported as 13.96 and 2.76 per 100,000 inhabitants in southeastern zone of Sistan and Baluchistan (7).
The place seems to be a key element in the epidemiological studies for a long time. It had no practical use till eventually spatial analysis of data was facilitated by improved access to computer-based geographic information systems(8).
Geographic information system (GIS) is a convenient user-friendly tool with various logical functions and features(9). Spatial modeling with GIS provides a better understanding of the spatial distribution of the disease and evaluates its correlation with environmental agents and health care system(10).
So far, as there have not been any studies on spatial distribution of the MS disease in Iran, this study was conducted in order to analyze the spatial distribution of MS disease in Tehran. The distribution of the MS cases including high risk zones of the disease and the reported incidence trend of the disease in northern and southern zones of Tehran were investigated.
Materials and Methods
Data collection
In this ecological study, medical records of MS patients who had registered in IMSS’s Tehran office were investigated from 2001 to 2012. The data of the patients who were residents of Tehran was included in this study as well.
IMSS’s is a non-governmental organization established in 1999 and has several offices all over Iran. Each patient should have an approval letter confirming MS from a neurologist in order to be registered in this society. Since 2001 all of the patients were diagnosed based on MacDonald criteria(11). Each patient in the society has a unique ID and they receive a magazine monthly. Patients were asked to inform the society in case of changing their addresses. The society offers several services in the three fields of educational, social and research, including monthly classes about the disease, rehabilitation, and psychological and economical support. Medical and demographical records of the patients, including age of disease onset, current age, sex, address, date of disease diagnose (year), disease’s type, education level and marital status were recorded in medical files. Some information about Tehran was also collected from Iranian Statistical Centre.
Study area
Tehran is a metropolitan city with 594 km2 located in the center of Tehran county province with height of 1700 m in north, 1200 m in center and 1100 in south. This city has 22 zones (12) (Fig. 1).
Fig. 1.
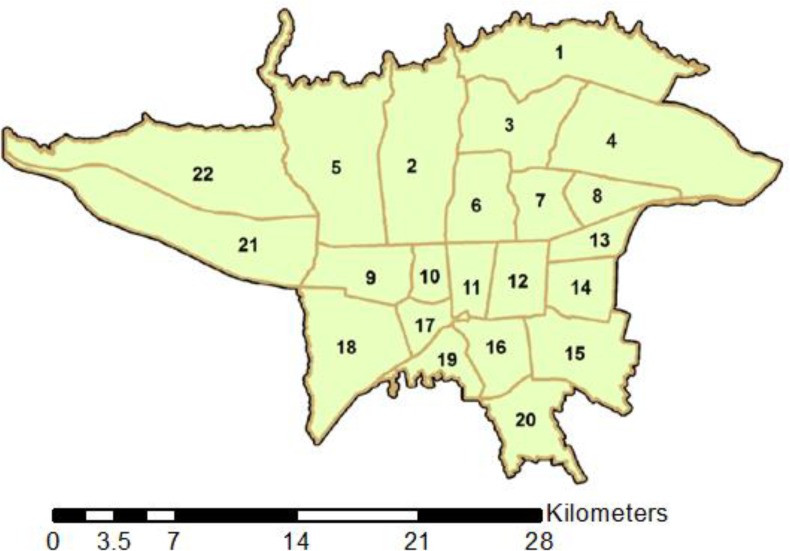
Map of the 22 zones of Tehran
Tehran is located at 35°30’ to 35° 51’N and 51° to 51° 40’ E (13).
Population at risk
Based on the national census issued by Iranian statistical centre, total population of the city in 2006 was 7’803’883, which 3, 986, 419 were male and 3, 817, 464 were female.
Statistics
The descriptive information of patients was analyzed by STATA version 12. Geographic information system was used by means of Arc GIS in order to conduct spatial analysis to perform the analysis, first spatial data were overlaid on Tehran’s digitized map using geo-coding. All logged coordinates were converted fromWGS-1984geographic coordinates toUTMCartesian coordinates (UTM, Zone38N). The relationship between disease incidence in 22 zones of Tehran and estimated socioeconomic status (SES) of each zone was evaluated by means of negative binomial regression approach. SES index included income, education, ethnicity, job and asset variables(14) to compare the overall trend of annually incidence rate between northern and southern zones Random-effect Poisson regression approach was used where zones 1 to 8 and zone number 22 were considered as “northern zones” while the other zones were considered as “southern zones” (Fig. 2). The intervals for defining temporal closeness were arbitrary chosen as 1, 2, 3, 5, 11 years. High and low clustering approach was used in order to investigate the disease’s distribution pattern and where P-value was less than 0.05, the distribution was considered clustering. Getis Ord’s Gi test and Hot Spot analysis approach was used in order to detect high risk zones of the disease. The conceptualization of spatial analysis was calculated using the fixed-distance band. The Euclidian distance was used as the distance method. Hot spot (the densest cluster) is a cluster of cases in spatial distribution which represents high risk zones of the disease. Hot spots define as the geographical places where the disease occurrence is more than the other geographical places and points around this spot show the density of disease’s cases (15). The output of the analysis was a z-score and P-value for each zone in Tehran. The zones with high z-scores and small P-values indicated a spatial clustering of high level hot spots; and the zones with low z-scores and small P-values indicated a spatial clustering of low level hot spots (15).
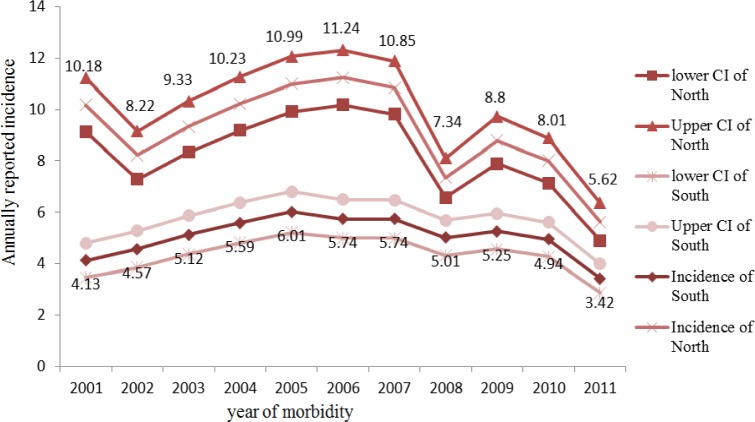
Fig. 2.
Annually reported incidence trend (per100, 000 inhabitants) in northern and southern zones of Tehran between 2001 to 2012
Where xj is the attribute value for feature j, wi, j is the spatial weight between i and j, and n is equal to the total number of features(16).
In epidemiology, cluster is defined as number of health-related events situated altogether at the same place and/or in the same time (17).
Smoothing values and surrounding zones of each zone are both taken into account for calculations (18) to detect high risk zones of the disease, A smoothed map of patients was demonstrated by inverse distance weighting (IDW) method. This method is commonly used GIS (geographical information systems) to make raster surface (19) In this method optimum power is calculated based on lowest Root Mean Square Prediction Error (RMSPE)(15) that power was 6.17 and neighborhood search was standard in this study. Weight was a function of the inverse of the distances to each known point (15).
Results
The cumulative incidence of MS disease was estimated to be 77.23 per 100,000 inhabitants between 2001 and 2012. This rate was 119.97 per 100,000 inhabitants for women and 36.3 per 100,000 inhabitants for men during 2001 to 2012. Male- to- female sex ratio was 0.31 in this study. Total number of subjects was 6027 with 4580(75.99%) women and 1447(24.01%) men. Majority of the patients were literate (98.82%) aging 30-39 years old (38.93%) which suffered from relapsing-remitting MS type (78.97%). The mean (SD) onset age was 29.08 (9.11). Mean (SD) age of the patients was 35.11(9.5). Most of the patients (57.22%) were married and (67.73%) were born in Tehran. Most of the reported cases of disease were from northern zones of Tehran (zones 5, 4, 2, 1, 3, 7, 8, and 6 respectively) during the study period (Fig. 3).
Fig. 3.
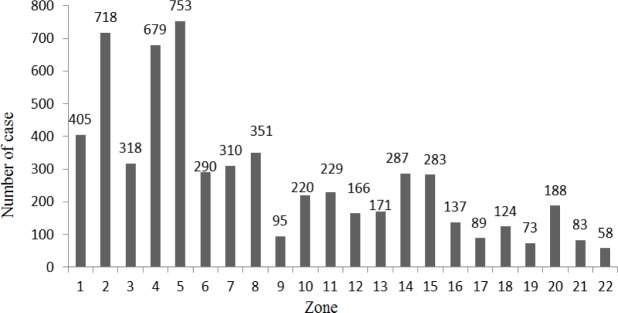
Number of MS patients based on the Tehran’s 22 zones during 2001-2012
Annually reported incidence rate in northern zones of Tehran was higher than southern zones and the difference was statistically significant at 0.05 for each year (Fig. 2). The trend of MS disease was statistically different in northern and southern zones (x2(2) =11.88, P=0.002).
Linear and quadratic coefficients’ estimations for time variable showed that the maximum incidence rate of disease has occurred before 2006 in northern zones and gradually reduced whereas disease trend in southern zones of Tehran was flat (Table 1). High and low clustering analysis results show that the data pattern was distributed randomly during the study period. Based on calculated rates for both each year separately and the combination of several years (for each 2, 3, 5, and 11 years), high risk zones (clustered pattern) were located in northern zones. High risk zones of disease were in zones number 2 and 6 during 2001-2006 (Fig. 4) while the only high risk zone of the disease was zone number 5 during 2007-2012(Fig.5). During all the periods of study, the only high risk zone of disease was zone number 6 (P<0.1) (Fig.6). Additionally most reported cases of the disease were around zone number 6.
Table 1.
Linear and quadratic regression coefficients (random-effect Poisson) for northern and southern zones during the study period
| Zones | Linear and quadratic terms | Estimated Coefficient | Standard Error(SE) | P-value |
|---|---|---|---|---|
| Northern zones** | Time* | -0.036 | 0.005 | <0.001 |
| Time2 | -0.013 | 0.002 | <0.001 | |
| Southern zones*** | Time* | -0.006 | 0.007 | 0.42 |
| Time2 | -0.016 | 0.003 | <0.001 |
Dependent variable: Time/* Trend terms were centered on the midyear 2006/** zones 1to 8 and 22 of Tehran /*** Zones 9 to 21 of Tehran
Fig. 4.
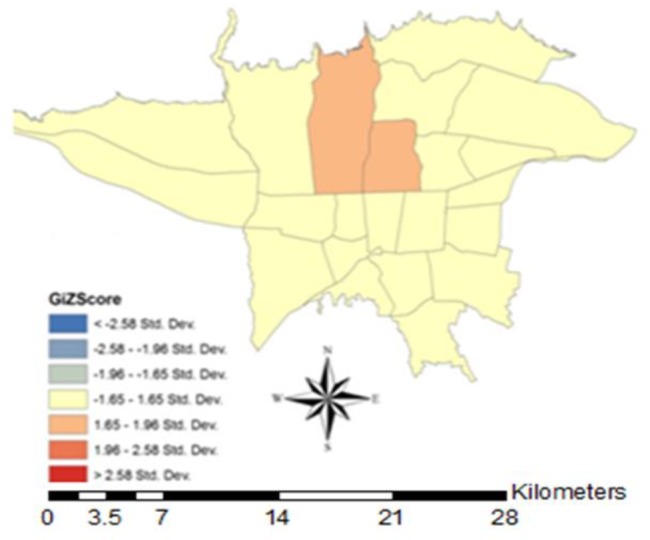
Map of hot spot analysis in 22 zones of Tehran during 2001-2006
Fig. 5.
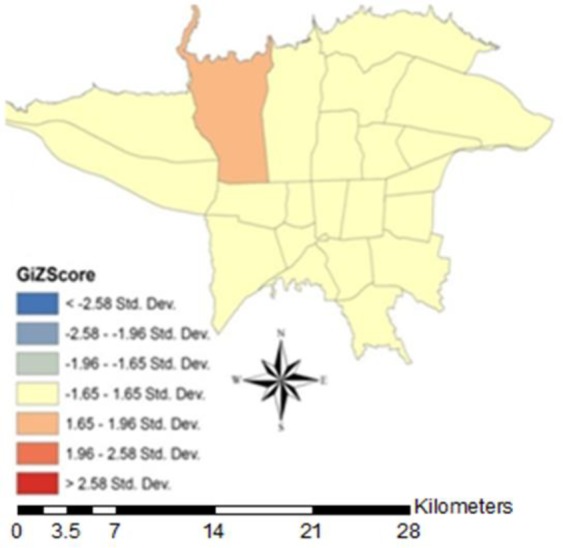
Map of hot spot analysis in 22 zones of Tehran city during 2007-2012
Fig. 6.
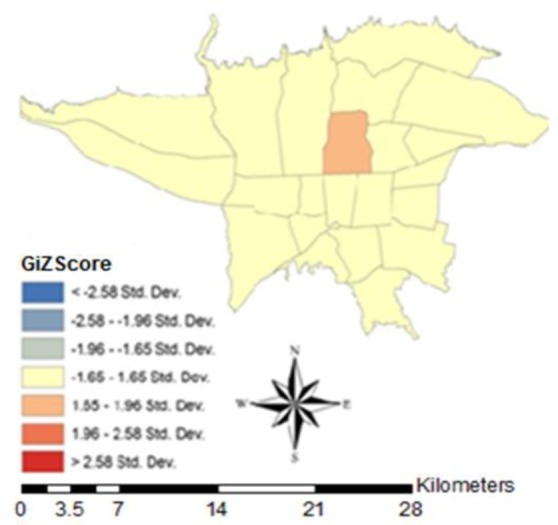
Map of hot spot analysis in the 22 zones of Tehran during the 2001-2012
Smoothed maps of MS cases were illustrated using inverse distance weighting method with an optimum power of 6.17 and the neighborhood included a minimum number of 4 points and maximum points of 6. Maps based on these analyses show a higher MS incidence in northern zones and a lower incidence in southern zones. Purple and green zones in the map represent higher and lower annually estimated incidence, respectively (Fig. 7). Overall, the estimated cumulative incidence of MS disease was 101.73 per 100,000 inhabitants in northern zones and 53.79 per 100,000 inhabitants in southern zones during the study period. In the smoothed map of MS disease, zones 2 and 6 (northern zones) were high risk zones where the average of annual incidence was 11.1 per 100,000 inhabitants and in zones 17 and19 (southern zones) the average of annual incidence of MS disease was 2.65 per 100,000 inhabitants during the study period (Fig. 7).
Fig. 7.
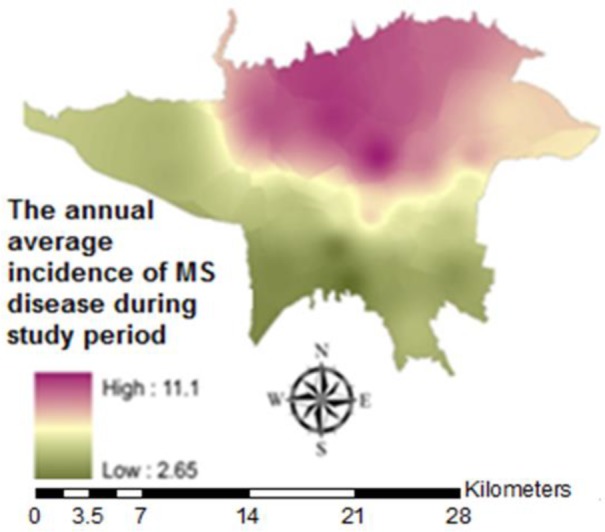
Smoothed map of annual average incidence of MS disease in the 22 zones of Tehran during the 2001-2012
In this study, a direct linear association was observed between SES and reported incidence of disease for different zones. For each unit increasing by SES, the reported incidence of disease increases 1.92 per 100,000 inhabitants (P<0.001).
Discussion
The results of our study show heterogeneity of MS disease in Tehran. The reported cumulative incidence was estimated to be about 2 times higher in northern zones (101.73 per 100,000) than southern zones (53.78 per 100,000) during the study. Other studies have also mentioned such heterogeneous patterns. In a study investigating spatial distribution and autocorrelation of MS based on Bayesian approach in France, the overall incidence of disease from 2003 to 2004 was 7.5 per 100,000 inhabitants and MS prevalence was higher in north-east and lower in Mediterranean and Parish zones (20). In another study in Horda-land county, Norway incidence and prevalence of MS disease was investigated using Knox’s method and a lower incidence and prevalence was observed in coastal zone rather than inland zone(21). In a study in Finland, 1866 MS cases were investigated and highest prevalence (52.3 per 100,000 inhabitants) was in southwestern zone of Pori and Turku and the geographical distribution of MS disease was heterogeneous (22).
In the current study, the relationship between estimated incidence and SES index was investigated for every zone and the results claimed as increasing per one unit in SES, the reported MS incidence increased 1.92 per 100,000 inhabitants (P<0.001). As northern zones in Tehran have a higher SES comparing the southern zones, this result is in parallel with our previous finding that northern zones have higher cumulative incidence of MS. As MS disease diagnosis is in accordance with the medical care standards, diagnostic criteria’s sensitivity, community’s awareness of the disease, access to diagnostic procedures and health care (23), so subjects with a higher SES will afford and will easily have access to high quality diagnostic procedures and several MRIs and CSFs. This makes the disease detection more probable in these zones and as a result, the disease incidence will be higher. In a case-control study investigating the risk factors of MS, SES had no significant relationship with multiple sclerosis risk (24). Perhaps, this controversy was because of the small sample size of the study.
Another reason for high MS incidence in northern zones may be due to deficiency of vitamin D in these patients. An association was reported among low levels of vitamin D and incidence of MS disease (25).
Other possible factors causing heterogeneity in Tehran may be difference in age distribution (20), exposure to environmental factors like water, soil, air, nutrition, lifestyle, infection (EBV), stress (23) and smoking (26); genetic factors; and interaction between genetic and environmental agents. Environmental agents may affect the severity and the nature of the symptoms and the overall process of the disease. These impacts may be multiple, complementary or even controversial (27).
Another result of our study was existence of high risk zones in various northern zones of Tehran. Zone number 6 was repeatedly detected as high risk zone in different years, therefore requires close monitoring of the relevant authorities and organizations.
Women were the majority patients in this study. Cumulative Incidence of the disease in women was three times more than men. In another studies it was also shown that MS is more frequent in women (28). Potential changes in lifestyle (smoking, obesity and hormone therapy) especially in women can be a risk factor for MS. There were some other reasons for higher incidence of MS in women, one may be the fact that women pay more attention to health care than men and they are more sensitive to the symptoms, this also explains numerous mild cases of MS in women(28). In a study it was mentioned that higher level of 25-hydroxy vitamin D is correlated with lower incidence and disability of MS in women (29). So vitamin D deficiency is another possible reason.
The high risk zones can indicate presence of localized risk factors (23). In a study in Hordaland county, Norway 381 MS patients were followed during 1953 to 1987 and Patients within significantly similar birth cohort lived close to each other at the age of 13-20 (P=0.002) (30). In another study simultaneous clustering of birth place and birth date of MS cases was performed but data didn’t provided any evidence for rejecting the null hypothesis that distribution of MS cases by birth place and date joint was random (31).
In spite of relatively large sample size, this study had several limitations. This study was an ecological study and the assessment of risk factors at individual level was impossible. Moreover, our results were limited to Tehran. As registration in IMSS has been compulsory since 2007 the incidence of MS disease may have been underestimated for years before 2007. Perhaps, patients with mild MS haven’t registered in IMSS. Other limitations include flaws in patients’ records and registration system, bias due to information error, lack of necessary secondary information about age and smaller geographical zones to conduct a more specific estimate.
The results of our study confirm the necessity of further investigations on women’s lifestyle in a population-based design as well as analytical studies with large sample sizes to assess environmental and genetic risk factors of MS disease and to identify individual level confounding variables. GIS-based studies in micro-geographical levels with rich methodologies are also suggested. Generally, studies based on cooperation of researcher from other fields such as genetics, health sciences, virology, and immunology it is crucial to provide clues to resolve complexities involved in MS etiology.
Conclusion
Cost-effective and long-term interventional strategies along with close monitoring of the disease in high risk zones should be taken into consideration.
Ethical considerations
Ethical issues (Including plagiarism, Informed Consent, misconduct, data fabrication and/or falsification, double publication and/or submission, redundancy, etc.) have been completely observed by the authors.
Acknowledgment
The authors would like to thank Iranian Society of Multiple Sclerosis for their cooperation in providing the MS patients data. The authors declare that there is no conflict of interests.
References
- Pugliatti M, Rosati G, Carton H, Riise T, Drulovic J, Vécsei L, et al. (2006). The epidemiology of multiple sclerosis in Europe. Eur J Neurol, 13(7): 700–722. [DOI] [PubMed] [Google Scholar]
- Milo R, Kahana E (2010). Multiple sclerosis: Geoepidemiology, genetics and the environment. Autoimmun Rev, 9:A387–A94. [DOI] [PubMed] [Google Scholar]
- Adelman G, Rane SG, Villa KF (2013). The cost burden of multiple sclerosis in the United States: a systematic review of the literature. J Med Econ, 16(5): 639–647. [DOI] [PubMed] [Google Scholar]
- Sahraian MA, Khorramnia S, Ebrahim M, Moinfar Z, Lotfi J, Pakdaman H(2010). Multiple sclerosis in Iran: a demographic study of 8,000 patients and changes over time. Eur Neurol, 64: 331–336. [DOI] [PubMed] [Google Scholar]
- Etemadifar M, Abtahi SH(2012). Multiple Sclerosis in Isfahan: past, present and future. Int J Prev Med, 3(5): 301–302. [PMC free article] [PubMed] [Google Scholar]
- Abedini M, Zarvani A, Farahmand M(2008). Epidemiologic study of multiple sclerosis in Mazandaran, Iran,2007. J Mazandaran Univ Med Sci, 18(66): 82–86. [Google Scholar]
- Maghzi AH, Sahraian MA, Maghzi H, Shaygannejad V(2013). Multiple sclerosis in Sistan and Baloochestan, South East Iran. Clin Neurol Neurosurg, 115(6): 847–848. [DOI] [PubMed] [Google Scholar]
- Auchincloss AH, Gebreab SY, Mair Ch, DiezRoux AV (2012). A Review of Spatial Methods in Epidemiology, 2000–2010. Annu Rev Public Health, (33): 107–122. [DOI] [PMC free article] [PubMed] [Google Scholar]
- Sedighi M(2003). Application of Geographic Information System(GIS). J Inform Sci, 182(20): 29–49. [Google Scholar]
- Tanser FC, Sueur DlE(2002). The application of geographical information systems to important public health problems in Africa. Int J Health Geogr, 1: 4. [DOI] [PMC free article] [PubMed] [Google Scholar]
- McDonald WI, Compston A, Edan G, Goodkin D, Hartung HP, Lublin FD, et al. (2001). Recommended diagnostic criteria for multiple sclerosis: guidelines from the International Panel on the Diagnosis of Multiple Sclerois. Ann Neurol, 50: 121–127. [DOI] [PubMed] [Google Scholar]
- Statistical center of Iran (2009). General Census of Population and Housing, 2006, the overall result of Tehran city, 22 zones.. Available from: www.amar.org.ir. [Google Scholar]
- Sohrabinia M, Khorshiddoust AM. Application of satellite data and GIS in studying air pollutants in Tehran. Habitat International, 31(2007): 268–275. [Google Scholar]
- Rohani-Rasaf M, Moradi-Lakeh M, Ramezani R, Asadi-Lari M(2012). Measuring Socioeconomic Disparities in Cancer Incidence in Tehran, 2008. Asian Pacific J Cancer Prev, 13: 2955–2960. [DOI] [PubMed] [Google Scholar]
- Mostafavi E. Spatial and temporal analysis of Crimean-Congo hemorragic fever in Iran [Phdthesis]. Tehran University of Medical Sciences, Tehran, Iran; 2009. [Google Scholar]
- Khormi HM, Kumar l (2011). Identifying and visualizing spatial patterns and hot spots of clinically-confirmed dengue fever cases and female Aedesaegypti mosquitoes in Jeddah, Saudi Arabia. Dengue Bulletin, 35. [Google Scholar]
- Moore DA, Carpenter TE (1999). Spatial analytical methods and geographic information systems: use in health research and epidemiology. Epidemiol Rev, 21(2): 143–161. [DOI] [PubMed] [Google Scholar]
- Olsen SF, Martuzzi M, Elliott P(1996). Cluster analysis and disease mapping-why, when, and how? A step by step guide. BMJ, 313(7061): 863. [DOI] [PMC free article] [PubMed] [Google Scholar]
- Azpurua M, Ramos KD (2010). A comparison of spatial interpolation methods for estimation of average electromagnetic field magnitude. Electromagnetics Research M, 14: 135–145. [Google Scholar]
- Fromont A, Binquet Ch, Sauleau EA, Fournel I, Bellisario A, Adnet J, et al(2010). Geographic variations of multiple sclerosis in France. Brain, 133(7): 1889–1899. [DOI] [PubMed] [Google Scholar]
- Larsen JP, Riise T, Nyland H, Kvale G, Aarli JA(1985). Clustering of multiple sclerosis in the county of Hordaland, Western Norway. Acta Neurol Scand, 71(5): 390–395. [DOI] [PubMed] [Google Scholar]
- Wikstrom J(2009). Studies on the clustring of multiple sclerosis in Finland II: Microepidemiology in one high‐risk county with special reference to familial cases. Acta Neurol Scand, 51(3): 173–183. [DOI] [PubMed] [Google Scholar]
- Pugliatti M. Epidemiological studies of multiple sclerosis in a Sardinian population, insular Italy: cluster studies and health status [Phdthesis]. The University of Bergen; 2007. [Google Scholar]
- Zorzon M, Zivadinov R, Nasuelli D, Dolfini P, Bosco A, Bratina A, et al. (2003). Risk factors of multiple sclerosis: a case-control study. Neurol Sci, 24(4): 242–247. [DOI] [PubMed] [Google Scholar]
- Summerday NM, Brown SJ, Allinqton DR(2012). Vitamin D and Multiple Sclerosis : Review of a Possible Association. J Pharm Pract, 25(1): 75–84. [DOI] [PubMed] [Google Scholar]
- Wingerchuk DM(2011). Environmental Factors in Multiple Sclerosis: Epstein‐Barr Virus, Vitamin D, and Cigarette Smoking. Mt Sinai J Med, 78(2): 221–230. [DOI] [PubMed] [Google Scholar]
- Poser CM(2007). The environment and the nervous system. J Neurol Sci, 262(1–2): 98–99. [DOI] [PubMed] [Google Scholar]
- Sellner J, Kraus J, Awad A, Milo R, Hemmer B, Stüve O (2011). The increasing incidence and prevalence of female multiple sclerosis—A critical analysis of potential environmental factors. Autoimmun Rev, 10(8): 495–502. [DOI] [PubMed] [Google Scholar]
- Kragt J, van Amerongen B, Killestein J, Dijkstra C, Uitdehaag B, Polman Ch, Lips P (2009). Higher levels of 25-hydroxyvitamin D are associated with a lower incidence of multiple sclerosis only in women. Mult Scler, 15(1): 9–15. [DOI] [PubMed] [Google Scholar]
- Riise T, Grønning M, Klauber MR, Barrett-Connor E, Nyland H, Albrektsen G(1991). Clustering of residence of multiple sclerosis patients at age 13 to 20 years in Hordaland, Norway. Amj epidemiol, 133(9): 932–939. [DOI] [PubMed] [Google Scholar]
- van Buuren S, Zaadstra BM, Zwanikken CP, Buljevac D, van Noort JM(1998). Space‐time clustering of multiple sclerosis cases around birth. Acta Neurol Scand, 97(6): 351–358. [DOI] [PubMed] [Google Scholar]


