

Abstract
Hepatitis B virus X protein (HBx) is involved in the pathogenesis of hepatocellular carcinoma (HCC). Overexpression of the transcripts from the P3 and P4 promoters of the insulin-like growth factor-II (IGF-II) gene is observed in HCC. The present study investigated the involvement of HBx in IGF-II overexpression and its epigenetic regulation. Firstly, the effects of HBx on P3 and P4 mRNA expression, the methylation status of the P3 and P4 promoters, and MBD2 expression were analyzed in human HCC cells and HCC samples. Next, interaction between HBx and MBD2 or CBP/p300 was assessed by co-immunoprecipitation, and HBx-mediated binding of MBD2 and CBP/p300 to the P3 and P4 promoters and the acetylation of the corresponding histones H3 and H4 were evaluated by quantitative chromatin immunoprecipitation. Finally, using siRNA knockdown, we investigated the roles of MBD2 and CBP/p300 in IGF-II overexpression and its epigenetic regulation. Our results showed that HBx promotes IGF-II expression via inducing the hypomethylation of the P3 and P4 promoters, and that HBx increases MBD2 expression, directly interacts with MBD2 and CBP/p300, and elevates their recruitment to the hypomethylated P3 and P4 promoters with increased acetylation levels of the corresponding histones H3 and H4. Further results showed that endogenous MBD2 and CBP/p300 are necessary for HBx-induced IGF-II overexpression and that CBP/p300 presence and CBP/p300-mediated acetylation of histones H3 and H4 are partially required for MBD2 binding and its demethylase activity. These data suggest that HBx induces MBD2-HBx-CBP/p300 complex formation via interaction with MBD2 and CBP/p300, which contributes to the hypomethylation and transcriptional activation of the IGF-II-P3 and P4 promoters and that CBP/p300-mediated acetylation of histones H3 and H4 may be a rate-limiting step for the hypomethylation and activation of these two promoters. This study provides an alternative mechanism for understanding the pathogenesis of HBx-mediated HCC.
Keywords: Hepatitis B virus X protein, hepatocellular carcinoma, insulin-like growth factor II, hypomethylation, MBD2-HBx-CBP/p300 complex
Introduction
Chronic hepatitis B virus (HBV) infection is a leading cause of human cirrhosis and hepatocellular carcinoma (HCC) [1]. HBV has four open reading frames that encode seven types of viral proteins. Among these proteins, the hepatitis B virus X protein (HBx) is essential for virus replication [2] and is thought to contribute to the pathogenesis of HCC [3]. HBx is a 17-kDa multifunctional regulatory protein that alters gene expression by binding to nuclear transcription factors, and by stimulating cytoplasmic signaling pathways [4]. In addition, recent data suggest that HBx is involved in epigenetic modifications during hepatocarcinogenesis [5,6]. In spite of these encouraging progresses, the mechanisms of HBx-induced hepatocarcinogenesis remain largely unknown.
The human insulin-like growth factor-II (IGF-II) is a fetal growth factor that is involved in fetal growth and development [7]. The gene encoding IGF-II is on chromosome 11p15.5 containing nine exons and four promoters (P1-P4) [8]. IGF-II is expressed predominantly in fetal liver under physiological conditions through the activation of the P2-P4 promoters; however, its expression is significantly downregulated shortly after birth because of a remarkable decrease or loss of the activity of the P2-P4 promoters [9]. IGF-II overexpression has been observed in many human malignancies, such as pediatric tumors, gastric cancer, colon cancer, and HCC [10-13]. There is compelling clinical and experimental evidence that IGF-II plays an important role in the pathogenesis of HCC [14]. Indeed, IGF-II expression is elevated in human HCCs [10], HCC cell lines [15,16], and HCC animal models [17]. The increased level of IGF-II in HCC results from the transcriptional reactivation of the fetal P3 and P4 promoters [18,19]. However, the reasons and mechanisms responsible for the reactivation of the two fetal transcripts are not well clarified.
IGF-II overexpression has been observed in HCC from HBV-infected patients but not uninfected patients [20]. Another study demonstrated that IGF-II expression is closely related to HBx expression in HCC tissues [21]. Similarly, in a previous study, we found that significantly increased expression of IGF-II transcripts from the fetal P3 and P4 promoters was observed in a large majority of HBV-associated HCC samples [19]. The above findings suggest that HBV or its product HBx may stimulate IGF-II expression.
One of the hallmarks of cancer is aberrant DNA methylation that is involved in altering gene transcription [22], mainly including the hypermethylation of tumor suppressor genes as well as the hypomethylation of unique genes and repetitive sequences [23,24]. The methyl-CpG binding domain protein 2 (MBD2) was previously shown to cause gene silencing of a methylated promoter [25]; however, other studies have recently shown that MBD2 could activate and cause the demethylation of certain promoters [26,27]. In contrast, histone acetylation mediated by histone acetyltransferases (HATs) promotes the active demethylation of ectopically methylated genes [28] and activates gene transcription [29]. The CREB-binding protein (CBP) and its paralog p300 are two members of the KAT3 subfamily of HATs and are ubiquitously expressed in mammals. Both proteins interact with over 400 different proteins and have diverse functions related to transcription activation and regulation [30,31]. Because the epigenetic modulation of IGF-II overexpression in HCC has not yet been studied, the present study was performed to explore the involvement of HBx in P3-and P4-driven mRNA overexpression and the underlying epigenetic mechanisms with respect to MBD2 and CBP/p300.
Materials and methods
Expression vectors and retrovirus-pBABE-puro-HBx
The pCMV-tag2B-HBx plasmid expressing HBx (HBx gene, GenBank Accession No. AF223955.1) and the pCMV-tag2B control blank plasmid were kindly provided by Dr. Ming Liang (Southern Medical University, Guangzhou, China). The pGL3-P3 and pGL3-P4 vectors were constructed by inserting the P3 promoter (-1251/+123) and the P4 promoter (-1129/+117), respectively, of the human IGF-II gene (GenBank Accession No. NT_009308) into the luciferase reporter vector pGL3-Basic (Promega, Madison, WI, USA). The pBABE-puro-HBx plasmid was constructed by inserting the HBx gene into the retrovirus vector pBABE-puro (Addgene, Cambridge, MA, USA). The pBABE-puro-HBx and the control vector pBABE-puro were transfected into 293FT package cells to generate retrovirus-pBABE-puro-HBx and retrovirus-pBABE-puro, respectively. All the constructs were verified by sequencing.
Cell lines and tissue specimens
The human HCC cell lines HepG2 (ATCC, HB-8065, Manassas, VA, USA) and Huh-7 (JCRB Cell Bank, Osaka, Japan) were cultured in Dulbecco’s modified Eagle medium (Gibco BRL, Rockville, MD, USA) supplemented with heat-inactivated 10% fetal bovine serum (Gibco BRL). The retrovirus-pBABE-puro-HBx was transfected into HepG2 cells to establish the stable HBx-expressing cell line HepG2-HBx. HepG2 cells transfected with empty retrovirus-pBABE-puro vector were used as the control cells and named HepG2-Mock. Tumor tissue specimens were obtained from 48 patients with HBV infection-positive/hepatitis C virus (HCV) infection-negative HCC (BNC-HCC) (36 men, 12 women) and 11 patients with both HBV and HCV infection-negative HCC (NBNC-HCC) (9 men, 2 women) who underwent curative resection at the First Affiliated Hospital of Jinan University (Guangzhou, China) (Table 1). HBV infection was defined as the positive detection of serum HBs-Ag and HBV DNA, and no HCV infection was defined as the negative detection of serum anti-HCV and HCV RNA. This study was approved by the medical ethics committee of the First Affiliated Hospital of Jinan University, and written informed consent was obtained from each participant.
Table 1.
Clinicopathological characteristics of HCC patients
| Case | Sex | Age (yrs.) | Tumor diameter (cm) | TEPV | Etiology | Diagnosis (Edmondson grade) |
|---|---|---|---|---|---|---|
| 1 | F | 42 | 4.5 | + | HBV | HCC (III) |
| 2 | M | 63 | 6.5 | + | HBV | HCC (IV) |
| 3 | M | 39 | 4.2 | - | HBV | HCC (I) |
| 4 | M | 46 | 8.5 | + | HBV | HCC (IV) |
| 5 | M | 56 | 3.5 | - | HBV | HCC (II) |
| 6 | F | 50 | 5.5 | - | HBV | HCC (III) |
| 7 | M | 45 | 4.8 | + | HBV | HCC (III) |
| 8 | M | 41 | 6.8 | + | HBV | HCC (IV) |
| 9 | M | 37 | 3.6 | - | HBV | HCC (II) |
| 10 | M | 68 | 12.5 | + | HBV | HCC (IV) |
| 11 | M | 72 | 7.6 | - | HBV | HCC (II) |
| 12 | M | 61 | 9.5 | + | HBV | HCC (III) |
| 13 | M | 74 | 7.8 | + | HBV | HCC (IV) |
| 14 | M | 52 | 11.8 | + | HBV | HCC (IV) |
| 15 | M | 38 | 10.5 | + | HBV | HCC (I) |
| 16 | F | 65 | 4.5 | - | HBV | HCC (III) |
| 17 | M | 78 | 4.7 | - | HBV | HCC (IV) |
| 18 | M | 43 | 7.8 | - | HBV | HCC (II) |
| 19 | M | 42 | 11.5 | + | HBV | HCC (III) |
| 20 | M | 56 | 7.5 | + | HBV | HCC (III) |
| 21 | F | 49 | 4.8 | - | HBV | HCC (II) |
| 22 | M | 56 | 4.6 | + | HBV | HCC (IV) |
| 23 | F | 78 | 15.8 | + | HBV | HCC (IV) |
| 24 | M | 55 | 5.5 | + | HBV | HCC (III) |
| 25 | F | 73 | 3.7 | + | HBV | HCC (III) |
| 26 | M | 41 | 4.5 | - | HBV | HCC (I) |
| 27 | F | 47 | 7.5 | + | HBV | HCC (III) |
| 28 | M | 38 | 10.5 | + | HBV | HCC (IV) |
| 29 | M | 35 | 11.7 | - | HBV | HCC (IV) |
| 30 | M | 39 | 4.8 | - | HBV | HCC (III) |
| 31 | M | 71 | 5.5 | + | HBV | HCC (IV) |
| 32 | F | 62 | 3.5 | + | HBV | HCC (III) |
| 33 | F | 53 | 11.3 | + | HBV | HCC (III) |
| 34 | M | 46 | 4.7 | + | HBV | HCC (II) |
| 35 | M | 42 | 3.8 | - | HBV | HCC (II) |
| 36 | M | 36 | 7.8 | + | HBV | HCC (IV) |
| 37 | F | 39 | 3.5 | - | HBV | HCC (III) |
| 38 | M | 34 | 2.5 | + | HBV | HCC (III) |
| 39 | M | 53 | 6.8 | + | HBV | HCC (IV) |
| 40 | M | 51 | 16.5 | + | HBV | HCC (III) |
| 41 | M | 45 | 8.5 | + | HBV | HCC (IV) |
| 42 | M | 40 | 4.8 | - | HBV | HCC (III) |
| 43 | M | 47 | 8.5 | + | HBV | HCC (III) |
| 44 | F | 41 | 4.6 | - | HBV | HCC (II) |
| 45 | M | 60 | 7.8 | - | HBV | HCC (IV) |
| 46 | M | 71 | 10.3 | + | HBV | HCC (IV) |
| 47 | M | 39 | 5.8 | + | HBV | HCC (I) |
| 48 | F | 56 | 6.5 | + | HBV | HCC (III) |
| 49 | M | 64 | 8.7 | - | Alcohol | HCC (II) |
| 50 | F | 78 | 6.8 | - | Cryptogenic | HCC (II) |
| 51 | M | 55 | 10.7 | - | Alcohol | HCC (II) |
| 52 | M | 49 | 5.8 | - | Alcohol | HCC (III) |
| 53 | M | 57 | 4.2 | - | Alcohol | HCC (I) |
| 54 | M | 58 | 4.5 | - | Cryptogenic | HCC (IV) |
| 55 | M | 66 | 7.9 | - | Alcohol | HCC (I) |
| 56 | M | 73 | 13.5 | + | Alcohol | HCC (II) |
| 57 | M | 47 | 15.8 | + | Alcohol | HCC (III) |
| 58 | M | 52 | 7.6 | - | Alcohol | HCC (II) |
| 59 | F | 55 | 6.8 | + | Cryptogenic | HCC (II) |
Abbreviations: M, Male; F, Female; TEPV, Tumor embolus of portal vein; HCC, Hepatocellular carcinoma.
Quantitative RT-PCR
Total RNA was extracted from HCC tissue specimens and HCC cell lines using TRIzol reagent (Invitrogen, Carlsbad, CA, USA) according to the manufacturer’s instructions. RNA (2 μg) was reversely transcribed to obtain cDNA using 10 units of Reverse Transcriptase XL (AMV) (TaKaRa, Kyoto, Japan). Real-time quantitative RT-PCR was carried out using Power SYBR Green PCR Master Mix (Applied Biosystems, Foster City, CA, USA). The data were analyzed as described previously [32]. The primers used for the PCRs were as follows: P3 transcript (P3 mRNA) sense 5’-ATT ACA CGC TTT CTG TTT CTC TCC-3’ and antisense 5’-AAA TGA GGT CAG CTG TTG TAT CAA G-3’ (172 bp) [33]; P4 transcript (P4 mRNA) sense 5’-TCT CCT GTG AAA GAG ACT TCC AG-3’ and antisense 5’-CAA GAA GGT GAG AAG CAC CAG-3’ (137 bp) [33]; MBD2 mRNA sense 5’-AAC CCT GCT GTT TGG CTT AAC-3’ and antisense 5’-CGT ACT TGC TGT ACT CGC TCT TC-3’ (101 bp) [34].
Western blot analysis
Protein extraction from tumor tissues or cultured HCC cells was performed as described previously [35]. Equal amounts of protein were subjected to SDS-PAGE, followed by transfer of protein to nitrocellulose membranes (Bio-Rad, Hercules, CA, USA). The membranes were first incubated with antibodies against HBx (Abcam, Cambridge, UK), IGF-II (Abcam), MBD2 (sheep polyclonal antibody, Millipore-Upstate, Billerica, MA, USA), and β-actin (Abcam), then followed by incubation with HRP-conjugated secondary antibodies. The results were visualized using an enhanced chemiluminescence detection system (Amersham Biosciences, Piscataway, NJ, USA).
Bisulfite sequencing
DNA (2 μg) isolated from the HCC cells and the HCC tissue samples underwent sodium bisulfite modification using the CpGenome DNA Modification kit (Serologicals Corp., Norcross, GA, USA) according to the manufacturer’s protocols. The modified DNA samples were subjected to PCR amplification using sense and antisense primers for the P3 promoter (amplified fragment of 250 bp, P3 amplification region of -540/-290 bp), which were 5’-TTT TTT GTT GGG GTA GGT G-3’ and 5’-AAA TTC AAA AAC CCC ATC C-3’ and for the P4 promoter (amplified fragment of 307 bp, P4 amplification region of -555/-248 bp), which were 5’-GTA GAA GTT TAT TTT GGT ATG TTG A-3’ and 5’-AAT CTC CTT CCC ACC TCC TTA TAT A-3’. The above primer pairs for PCR were designed using CpG Ware Primer Design Software (Serologicals). The PCR products were subcloned into the vector pMD19-T (TaKaRa, Kyoto, Japan) for DNA sequencing (Invitrogen, Shanghai, China). Eight positive clones of each sample were sequenced to ascertain the methylation patterns of each CpG locus.
In vitro methylation of pGL3-P3 and pGL3-P4 vectors
pGL3-P3 and pGL3-P4 plasmids were methylated in vitro by incubating 10 μg of plasmid DNA with 20 units of SssI CpG methyltransferase (New England BioLabs Inc., Ipswich, MA, USA) in the recommended buffer containing 160 μM S-adenosylmethionine for 3 h at 37°C. The above procedure was repeated once again and complete methylation was confirmed by observing full protection from HpaII digestion [36].
Transient transfection and dual luciferase assay
Huh-7 cells were plated at a density of 2 × 10⁵/well in a 24-well dish and transiently cotransfected with 0.5 μg luciferase reporter vectors (0.455 μg premethylated pGL3-P3 or pGL3-P4 vector and 0.045 μg pRL-TK vector) and 0.5 μg pCMV-tag2B-HBx or pCMV-tag2B control plasmid using TransFast transfection reagent (Promega, Madison, WI, USA). The luciferase assays were performed according to the manufacturer’s instructions at 48 h after transfection.
Co-immunoprecipitation (co-IP) assay
Cells were lysed in 1 ml lysis buffer (150 mM NaCl, 50 mM Tris-HCl (pH 7.4), 0.5% (v/v) Nonidet P-40, and protease inhibitor mixture (Roche Applied Science, Indianapolis, IN, USA). The cell lysates containing 500 μg of total proteins were immunoprecipitated with anti-HBx antibody (Abcam) or anti-MBD2 (Millipore-Upstate), anti-CBP (Abcam), anti-p300 (Abcam) antibodies and protein G Sepharose beads (GE Healthcare, Uppsala, Sweden) overnight at 4°C. Protein binding was detected by Western blotting with the respective antibodies.
Quantitative chromatin immunoprecipitation (qChIP) assay
qChIP assays were performed using a ChIP assay kit (Upstate Biotechnology, Charlottesville, VA, USA) according to the manufacturer’s specifications. Briefly, cells were cross-linked with 1% formaldehyde for 10 min at 37°C. The cross-linking was stopped by incubation with glycine at room temperature for 5 min. The collected cells were washed twice with ice-cold PBS containing a protease inhibitor cocktail (Roche Applied Science) and resuspended in SDS lysis buffer (Upstate Biotechnology). The cell lysates were then subjected to sonication. Each sample was precleared with protein G agarose and divided into three subsamples. One subsample was used as an input control, the second subsample was incubated with anti-HBx (Abcam), anti-MBD (Millipore-Upstate), anti-CBP (Abcam), anti-p300 (Abcam), anti-acetyl histone H3 (Lys18) (Thermo Scientific Pierce, Rockford, IL, USA), and anti-acetyl histone H4 (Lys 5/8/12/16) (Thermo Scientific Pierce) antibodies, and the third subsample was incubated with normal rabbit IgG non-specific antibody (negative control, Santa Cruz Biotechnology, Inc, Dallas, TX, USA) overnight at 4°C. DNA purified from both the immunoprecipitated and the preimmune (input) samples was subjected to real-time PCR amplification using Power SYBR Green PCR Master Mix (Applied Biosystems). The following primers were used: P3 promoter sense (P3 amplification region of -491/-331 bp) 5’-CCC CCT CAG CCG CAA CAA CC-3’ and antisense 5’-GCC TGT GCT CGT GAG CTG GG-3’ (160 bp); P4 promoter sense (P4 amplification region of -523/-398 bp) 5’-CCA GCG AGA CCG CGA GAG GA-3’ and antisense 5’-CGG ACA GAG CCA GAG GGG GT-3’ (125 bp). Amplifications were performed using the following protocol: 95°C for 5 min, and 40 cycles of 95°C for 15 s, 60°C for 15 s, and 72°C for 32 s.
Small interfering RNA (siRNA) knockdown
Huh-7 cells were transfected with siRNA oligonucleotides by using Lipofectamine RNAiMAX (Invitrogen). The following siRNAs were obtained from Dharmacon (Lafayette, IN, USA). The sequences of the siRNAs used in the present study were as follows: CBP siRNA (siCBP), antisense strand 5’-GCG GCU GUU GAU UCC UCA ATT-3’ [37]; p300 siRNA (sip300), antisense strand 5’-CUA AUC CAG GAC UGC UCU GTT-3’ [37]; MBD2 siRNA (siMBD2), antisense strand 5’-UUA CUA GGC AUC AUC UUU CUU T-3’ [38]. Negative control siRNA (siControl) was purchased from Dharmaco. The cells were harvested at 72 h after transfection, and then the endogenous CBP, p300, and MBD2 protein levels were determined by Western blotting.
Statistical analysis
Categorical data were evaluated by x2 or Fisher’s exact tests, depending on the absolute numbers included in the analysis, quantitative data were analyzed by independent sample t-test followed by Mann-Whitney U test, and linear correlation was evaluated by Pearson correlation coefficient. The results were considered statistically significant at P < 0.05.
Results
HBx promotes the expression of the IGF-II gene via inducing the hypomethylation of the P3 and P4 promoters in hepatoma cells and HCC specimens
To investigate the potential role of HBx in regulating IGF-II expression, we examined the expression of IGF-II at the mRNA and protein levels, and the methylation profiles of the IGF-II-P3 and P4 promoters in HepG2-HBx cells with stable HBx expression and HepG2-Mock cells (control cells). Quantitative RT-PCR and Western blot analyses showed that P3 and P4 mRNA expression, and IGF-II protein expression were significantly upregulated in HepG2-HBx cells compared with the control cells (Figure 1A-C). Meanwhile, bisulfite sequencing results revealed that the methylation levels of the 17 CpG sites in the P3 promoter fragment of -540/-290 bp and of the 18 CpG sites in the P4 promoter fragment of -555/-248 bp were lower in HepG2-HBx cells than those in the control cells (Figure 1D and 1E). The similar deregulated results of P3 and P4 mRNA expression, IGF-II protein expression, and the methylation profiles of the P3 and P4 promoters were also observed in Huh7 cells transiently transfected with the HBx-expressing plasmid pCMV-tag2B-HBx (Huh7-HBx) and with the control blank plasmid pCMV-tag2 (Huh7-Mock) (Figure 2). Next, the luciferase assays were performed using in vitro premethylated P3 and P4 promoter-luciferase constructs (pGL3-P3 and pGL3-P4) in Huh-7 cells transiently cotransfected with increasing amounts of HBx expression plasmid (pCMV-tag2B-HBx) or control plasmid (pCMV-tag2B). Consistent with the above results, the ectopic expression of HBx increased the activity and transcription of the P3 and P4 promoters in a dose-dependent manner (Figure 3).
Figure 1.
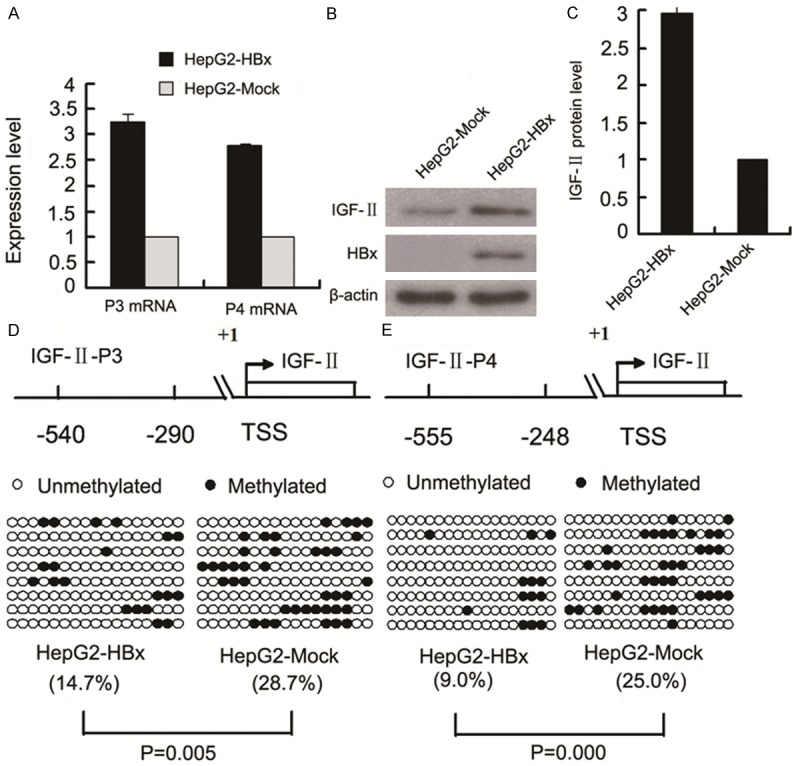
Effects of HBx on P3 and P4 mRNA expression, IGF-II protein expression, and the methylation status of the P3 and P4 promoters in HCC cells. A. P3 and P4 mRNA levels were higher in HepG2-HBx cells with stable HBx expression than in HepG2-Mock cells (p = 0.000, p = 0.000). B. Representative Western blot results of IGF-II protein expression in HepG2-HBx and HepG2-Mock cells. C. Signal densitometric quantitative results (AU) of IGF-II protein expression by Western blot analysis. IGF-II protein level in HepG2-HBx cells is higher than in HepG2-Mock cells (p = 0.000). The above each experiment was repeated thrice and all reactions were carried out in triplicate. D and E. Bisulfite sequencing results of the methylation levels of P3 promoter fragment (-540/-290 bp) and P4 promoter fragment (-555/-248 bp) in HepG2-HBx and HepG2-Mock cells. Each row of circles represents sequencing results of a clone, filled circles are methylated CpG dinucleotides, and empty circles are unmethylated CpG dinucleotides. The percentage of methylated CpG dinucleotides is indicated in parentheses. TSS, transcription start site; AU, arbitrary units.
Figure 2.
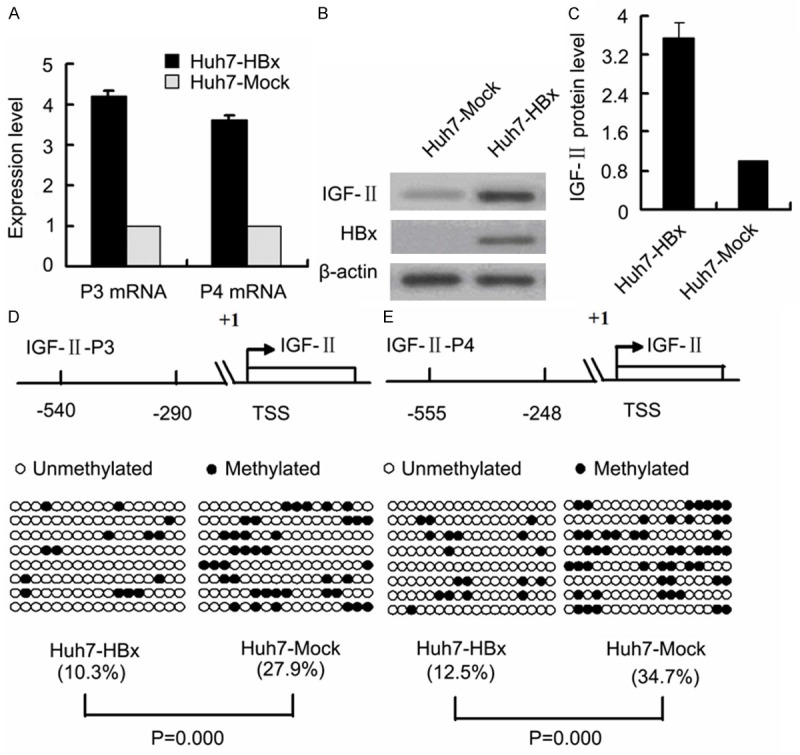
Effects of HBx on P3 and P4 mRNA expression, IGF-II protein expression, and the methylation status of P3 and P4 promoters in HCC cells. A. P3 and P4 mRNA levels were higher in Huh7-HBx cells with transient HBx expression than in Huh7-Mock cells (p = 0.000, p = 0.000). The transfected quantities of HBx expression plasmid were 1.0 μg per 1 × 10⁶ cells. B. Representative Western blot results of IGF-II protein expression in Huh7-HBx and Huh7-Mock. C. Signal densitometric quantitative results (AU) of IGF-II protein expression by Western blot analysis. IGF-II protein level in Huh7-HBx cells is higher than in Huh7-Mock cells (p = 0.000). The above each experiment was repeated thrice and all reactions were carried out in triplicate. D and E. Bisulfite sequencing results of the methylation levels of P3 promoter fragment (-540/-290 bp) and P4 promoter fragment (-555/-248 bp) in Huh7-HBx and Huh7-Mock cells. Each row of circles represents sequencing results of a clone, filled circles are methylated CpG dinucleotides, and empty circles are unmethylated CpG dinucleotides. The percentage of methylated CpG dinucleotides is indicated in parentheses. TSS, transcription start site; AU, arbitrary units.
Figure 3.
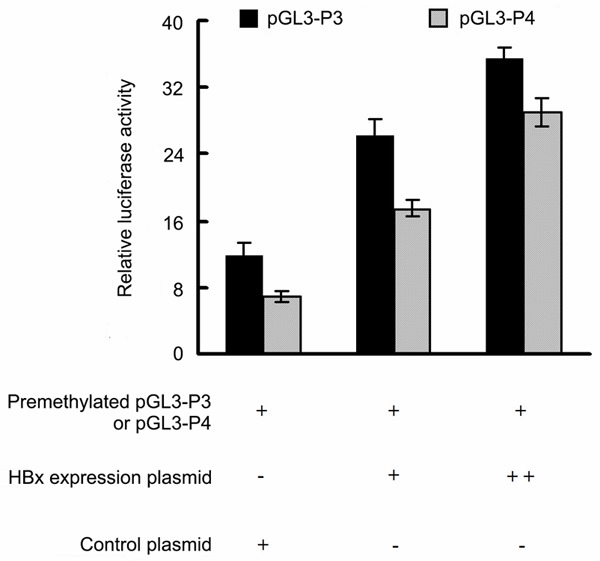
The ectopic expression of HBx increases the activity and transcription of IGF2-P3 and P4 promoters in vitro. Huh-7 cells were transiently cotransfected with increasing amounts of HBx expression plasmid or control plasmid and premethylated pGL3-P3 or premethylated pGL3-P4 vectors. The observed firefly luciferase activity was normalized to Renilla luciferase activity and the results were the average of three independent experiments carried out in triplicate. The transfected quantities of HBx expression plasmid were 0.25 μg (+) and 0.5 μg (++) per 1 × 10⁶ cells. *indicates that the mean values in Huh-7 cells cotransfected with control plasmid are significantly different from those cotransfected with HBx expression plasmid (P = 0.000).
Further, our results revealed that P3 and P4 mRNA levels were higher in BNC-HCC specimens than those in NBNC-HCC specimens (Figure 4A and 4B) and that P3 and P4 mRNA abundances were positively correlated to HBx protein level (Figure 4C and 4D). On the other hand, bisulfite sequencing of the 17 CpG sites in the P3 promoter fragment of -540/-290 bp and of the 18 CpG sites in the P4 promoter fragment of -555/-248 bp indicated that the mean methylation levels of the 17 CpG sites in the P3 promoter and of the 18 CpG sites in the P4 promoter in BNC-HCC specimens were lower than those in NBNC-HCC specimens (Figure 5A and 5B) and that the methylation levels of the two promoter fragments were negatively correlated to HBx protein level (Figure 5C and 5D). Moreover, the P3 and P4 mRNA levels were negatively correlated to the methylation levels of the P3 and P4 promoters, respectively (Figure 5E, 5F and Table 2). The above findings indicate that HBx expression may promote IGF-II expression via inducing DNA hypomethylation of the IGF-II-P3 and P4 promoters.
Figure 4.
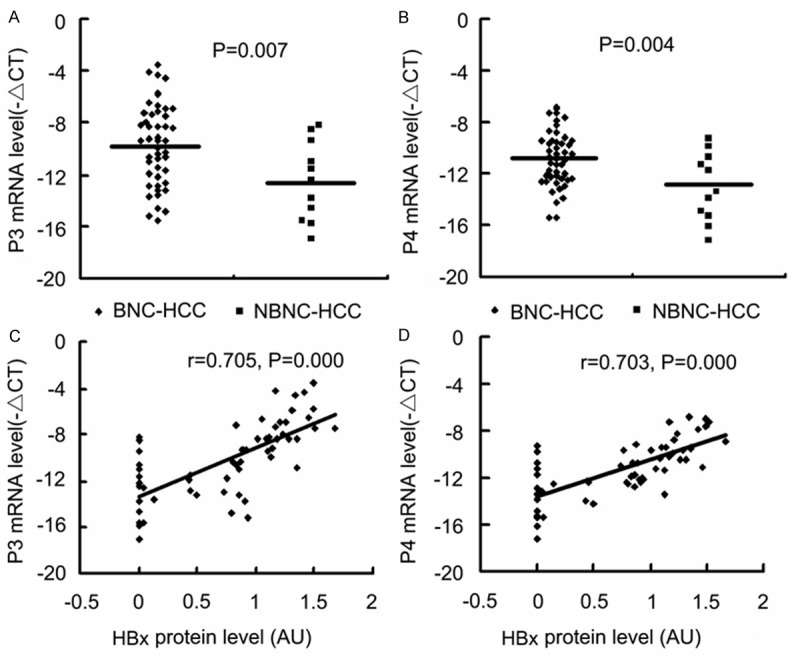
Effects of HBx expression on P3 and P4 mRNA in HCC specimens. P3 and P4 mRNA levels, and HBx protein levels were measured in BNC-HCC and NBNC-HCC specimens. The -ΔCT method was used to quantify quantitative RT-PCR results and the signal densitometric ratio (AU) of HBx versus β-actin Western blot results was used to quantify HBx protein level. A and B. P3 and P4 mRNA levels in BNC-HCC and NBNC-HCC samples. C and D. The results of Pearson linear correlation analyses of correlation between P3 and P4 mRNA levels and HBx protein levels in HCC specimens. BNC-HCC, HBV infection-positive/HCV infection-negative HCC; NBNC-HCC, Both HBV and HCV infection-negative HCC; AU, arbitrary units.
Figure 5.
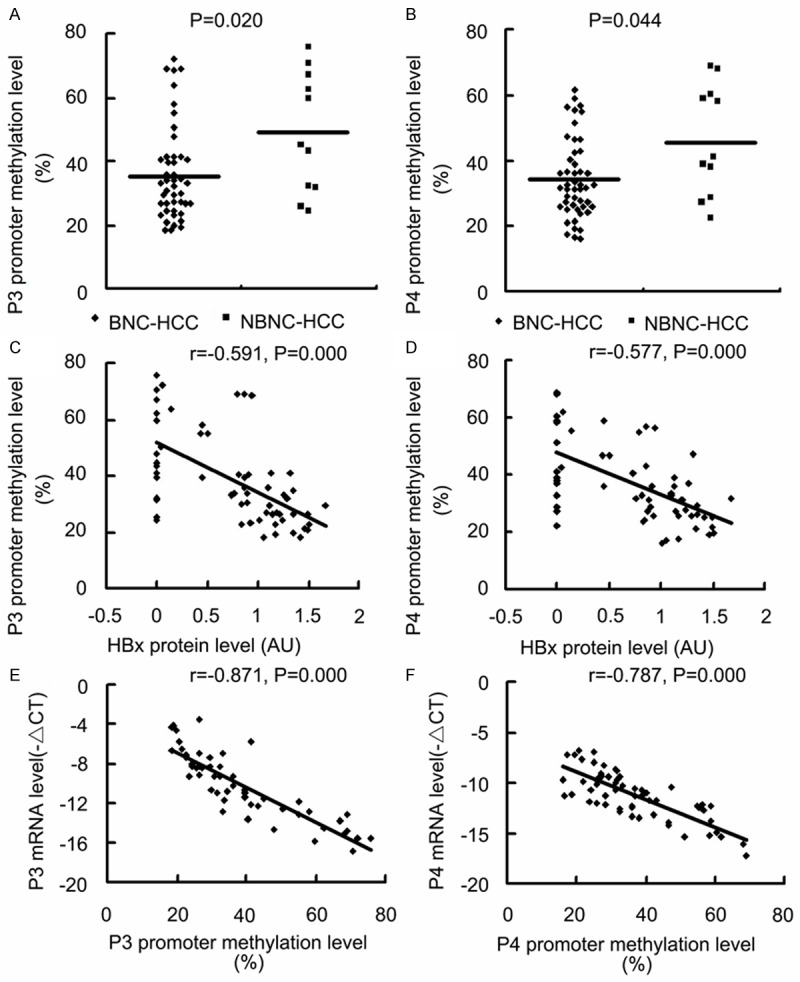
Effects of HBx expression on the methylation levels of P3 and P4 promoters in HCC specimens. The -ΔCT method was used to quantify quantitative RT-PCR results and the signal densitometric ratio (AU) of HBx versus β-actin Western blot results was used to quantify HBx protein level. The methylation level of P3 promoter fragment (-540/-290 bp) and P4 promoter fragment (-555/-248 bp) were analyzed using bisulfite sequencing. A and B. The methylation levels of the P3 and P4 promoter fragments in BNC-HCC and NBNC-HCC samples. C and D. The results of Pearson linear correlation analyses of correlation between the methylation levels of the P3 and P4 promoter fragments and HBx protein level in HCC specimens. E and F. The results of Pearson linear correlation analyses of correlation between P3 and P4 mRNA levels and the methylation levels of the P3 and P4 promoter fragments in HCC specimens. BNC-HCC, HBV infection-positive/HCV infection-negative HCC; NBNC-HCC, Both HBV and HCV infection-negative HCC; AU, arbitrary units.
Table 2.
Experimental data in HCC samples
| Case | P3 mRNA level (-ΔCT) | P4 mRNA level (-ΔCT) | HBx protein level (AU) | MBD2 protein level (AU) | P3 promoter methylation level (%) | P4 promoter methylation level (%) |
|---|---|---|---|---|---|---|
| 1 | -9.89 | -11.34 | 1.13 | 1.24 | 41.2 | 38.9 |
| 2 | -10.38 | -12.56 | 0.81 | 1.05 | 40.4 | 32.6 |
| 3 | -13.57 | -12.53 | 0.14 | 0.82 | 64.0 | 55.6 |
| 4 | -9.25 | -12.16 | 0.90 | 0.87 | 33.8 | 28.5 |
| 5 | -12.17 | -12.93 | 0 | 0.47 | 41.2 | 32.6 |
| 6 | -12.86 | -12.27 | 0.44 | 0.62 | 58.1 | 59.0 |
| 7 | -7.27 | -10.21 | 1.17 | 1.07 | 22.8 | 25.7 |
| 8 | -6.89 | -8.72 | 1.21 | 0.93 | 26.5 | 31.3 |
| 9 | -11.47 | -12.37 | 0.45 | 0.74 | 39.7 | 36.1 |
| 10 | -4.54 | -6.83 | 1.34 | 1.19 | 19.9 | 20.8 |
| 11 | -11.89 | -13.92 | 0.43 | 0.39 | 55.1 | 46.5 |
| 12 | -5.78 | -7.62 | 1.49 | 1.62 | 20.6 | 21.5 |
| 13 | -10.62 | -11.85 | 0.83 | 0.91 | 30.1 | 23.6 |
| 14 | -9.38 | -9.37 | 1.10 | 0.87 | 36.0 | 32.6 |
| 15 | -14.83 | -12.34 | 0.79 | 1.14 | 69.1 | 54.9 |
| 16 | -9.12 | -9.36 | 1.14 | 0.96 | 26.5 | 27.1 |
| 17 | -13.18 | -14.18 | 0.50 | 0.71 | 55.1 | 46.5 |
| 18 | -10.95 | -11.76 | 0.86 | 1.12 | 39.7 | 43.1 |
| 19 | -8.35 | -9.69 | 1.29 | 1.36 | 32.4 | 25.7 |
| 20 | -10.79 | -9.52 | 1.35 | 1.56 | 34.6 | 26.4 |
| 21 | -8.34 | -9.95 | 1.19 | 0.89 | 27.2 | 31.3 |
| 22 | -4.13 | -7.26 | 1.17 | 1.16 | 19.1 | 17.4 |
| 23 | -7.95 | -8.23 | 1.24 | 1.03 | 24.3 | 27.8 |
| 24 | -3.49 | -6.97 | 1.49 | 1.25 | 26.5 | 25.0 |
| 25 | -7.13 | -10.68 | 0.84 | 1.08 | 22.8 | 24.3 |
| 26 | -13.67 | -12.42 | 0.91 | 0.74 | 40.4 | 36.1 |
| 27 | -6.49 | -11.14 | 1.46 | 0.98 | 21.3 | 18.8 |
| 28 | -6.89 | -10.51 | 1.26 | 1.41 | 33.1 | 36.8 |
| 29 | -6.68 | -11.28 | 1.05 | 1.24 | 18.4 | 16.7 |
| 30 | -14.61 | -15.36 | 0 | 0.68 | 47.8 | 51.4 |
| 31 | -11.73 | -9.71 | 0.76 | 0.49 | 33.8 | 31.9 |
| 32 | -8.43 | -10.32 | 1.09 | 0.82 | 27.2 | 33.3 |
| 33 | -13.24 | -12.75 | 0.86 | 1.01 | 69.1 | 56.9 |
| 34 | -4.32 | -7.91 | 1.42 | 1.44 | 18.4 | 25.0 |
| 35 | -15.52 | -15.41 | 0.05 | 0.21 | 72.1 | 61.8 |
| 36 | -7.39 | -7.28 | 1.51 | 1.68 | 22.8 | 19.4 |
| 37 | -15.16 | -12.17 | 0.94 | 1.13 | 68.4 | 56.3 |
| 38 | -12.58 | -13.12 | 0.04 | 0.25 | 50.5 | 42.4 |
| 39 | -8.32 | -9.66 | 1.01 | 0.63 | 24.3 | 16.0 |
| 40 | -7.47 | -8.84 | 1.67 | 1.78 | 29.4 | 31.9 |
| 41 | -5.84 | -10.43 | 1.31 | 1.72 | 41.2 | 47.2 |
| 42 | -10.63 | -11.26 | 0 | 0.55 | 39.7 | 36.8 |
| 43 | -9.34 | -11.96 | 0.93 | 0.75 | 23.5 | 25.7 |
| 44 | -9.31 | -10.77 | 0.89 | 1.52 | 30.9 | 31.3 |
| 45 | -12.88 | -10.96 | 0.73 | 0.96 | 33.1 | 40.3 |
| 46 | -8.34 | -9.41 | 1.35 | 1.12 | 26.5 | 29.2 |
| 47 | -10.27 | -9.15 | 0.87 | 1.61 | 36.0 | 27.1 |
| 48 | -8.23 | -13.37 | 1.12 | 1.25 | 29.4 | 36.1 |
| 49 | -13.78 | -13.83 | 0 | 0.89 | 66.9 | 59.0 |
| 50 | -14.59 | -15.27 | 0 | 0.35 | 62.5 | 58.3 |
| 51 | -16.94 | -17.21 | 0 | 0.26 | 70.6 | 68.8 |
| 52 | -8.18 | -9.83 | 0 | 0.78 | 24.3 | 22.2 |
| 53 | -15.51 | -14.89 | 0 | 0.69 | 75.7 | 60.4 |
| 54 | -11.62 | -10.72 | 0 | 0.93 | 44.9 | 38.9 |
| 55 | -15.84 | -16.15 | 0 | 0.28 | 59.6 | 68.1 |
| 56 | -10.94 | -11.29 | 0 | 0.56 | 31.6 | 28.5 |
| 57 | -9.36 | -13.47 | 0 | 0.81 | 32.4 | 38.2 |
| 58 | -12.37 | -11.74 | 0 | 0.61 | 43.4 | 41.0 |
| 59 | -8.48 | -9.31 | 0 | 0.91 | 25.7 | 27.1 |
MBD2 is involved in the HBx-induced hypomethylation and transcriptional activation of the P3 and P4 promoters
To determine if MBD2 is involved in the HBx-induced hypomethylation and transcriptional activation of the P3 and P4 promoters, we first examined MBD2 expression in HCC cells and HCC samples. Quantitative RT-PCR and Western blot analyses indicated that the MBD2 mRNA and protein levels were significantly upregulated in HepG2-HBx (stably expressing HBx) and Huh-7-HBx (transiently expressing HBx) cells compared with the control cells (Figure 6), and that MBD2 protein level was higher in BNC-HCC specimens than that in NBNC-HCC specimens (Figure 7A). Linear correlation analysis revealed that the MBD2 protein level was positively correlated to the HBx protein level in HCC samples (Figure 7B). These results suggest that HBx may enhance MBD2 expression in HCC. Next, we analyzed the association of MBD2 expression with the transcriptional activation of the P3 and P4 promoters. Linear correlation analysis revealed that P3 and P4 mRNA abundances were positively correlated to the MBD2 protein level (Figure 8A and 8B) and that the methylation levels of the 17 CpG sites in the P3 promoter and the 18 CpG sites in the P4 promoter were negatively correlated to the MBD2 protein level (Figure 8C and 8D), suggesting that MBD2 may reduce the methylation levels of the P3 and P4 promoters and then upregulate P3 and P4 mRNA expression at the tissue level (Table 2). Taken together, the above data indicate that MBD2 overexpression by HBx may be implicated in the hypomethylation and transcriptional activation of the IGF-II-P3 and P4 promoters.
Figure 6.
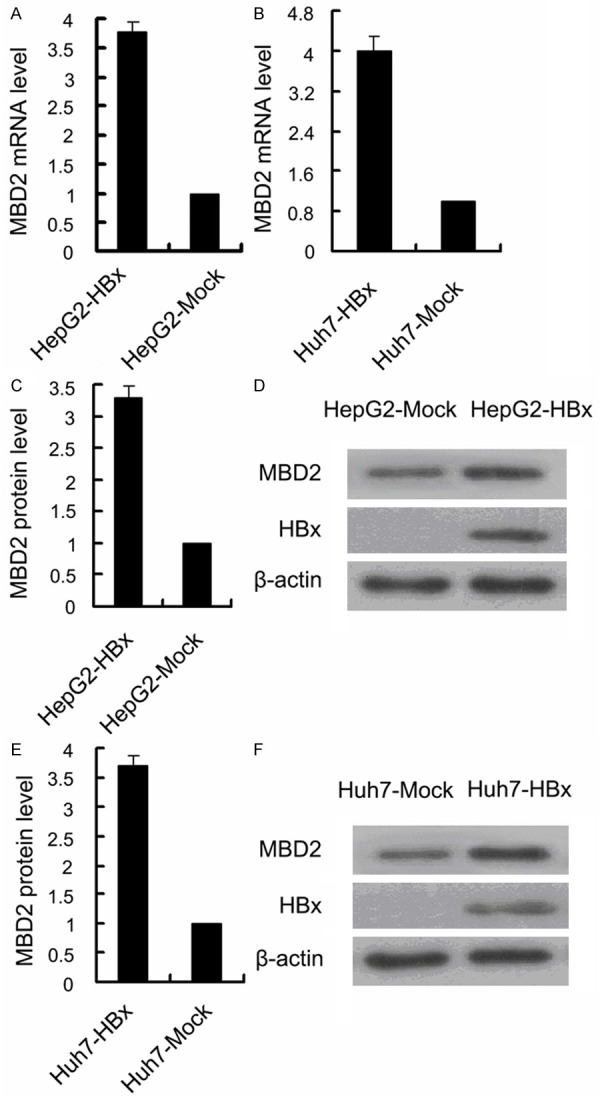
Effects of HBx on MBD2 expression in HCC cells. A and B. MBD2 mRNA level was higher in HepG2-HBx cells with stable HBx expression and Huh7-HBx cells with transient HBx expression than in HepG2-Mock (p = 0.000) and Huh7-Mock cells (p = 0.000), respectively. The transfected quantities of HBx expression plasmid were 1.0 μg per 1 × 10⁶ cells. C and E. The quantitative results (AU) of signal densitometry of MBD2 protein expression by Western blot analysis in HepG2-HBx and Huh7-HBx cells and in HepG2-Mock (p = 0.000) and Huh7-Mock cells (p = 0.000). D and F. Representative Western blot results of MBD2 protein expression in HepG2-HBx and Huh7-HBx cells and in HepG2-Mock and Huh7-Mock cells.
Figure 7.
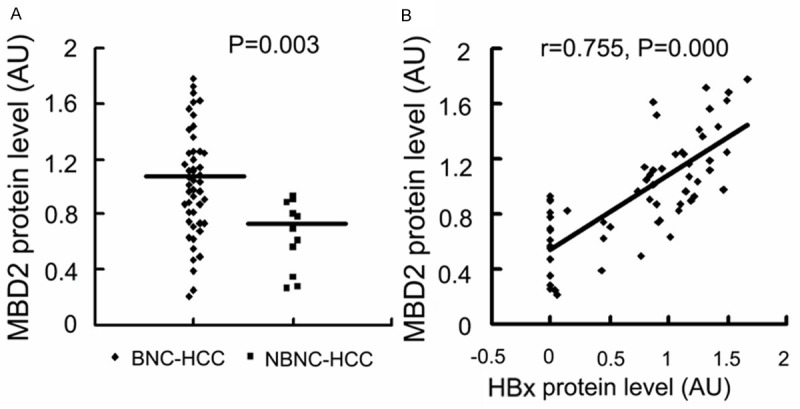
Effects of HBx expression on MBD2 expression in HCC specimens. MBD2 protein and HBx protein levels were measured in BNC-HCC and NBNC-HCC specimens. The signal densitometric ratio (AU) of MBD2 or HBx versus β-actin Western blot results was used to quantify MBD2 or HBx protein level. A. MBD2 protein level in BNC-HCC and NBNC-HCC samples. B. The results of Pearson linear correlation analysis of correlation between MBD2 protein level and HBx protein level in HCC specimens. BNC-HCC, HBV infection-positive/HCV infection-negative HCC; NBNC-HCC, Both HBV and HCV infection-negative HCC; AU, arbitrary units.
Figure 8.
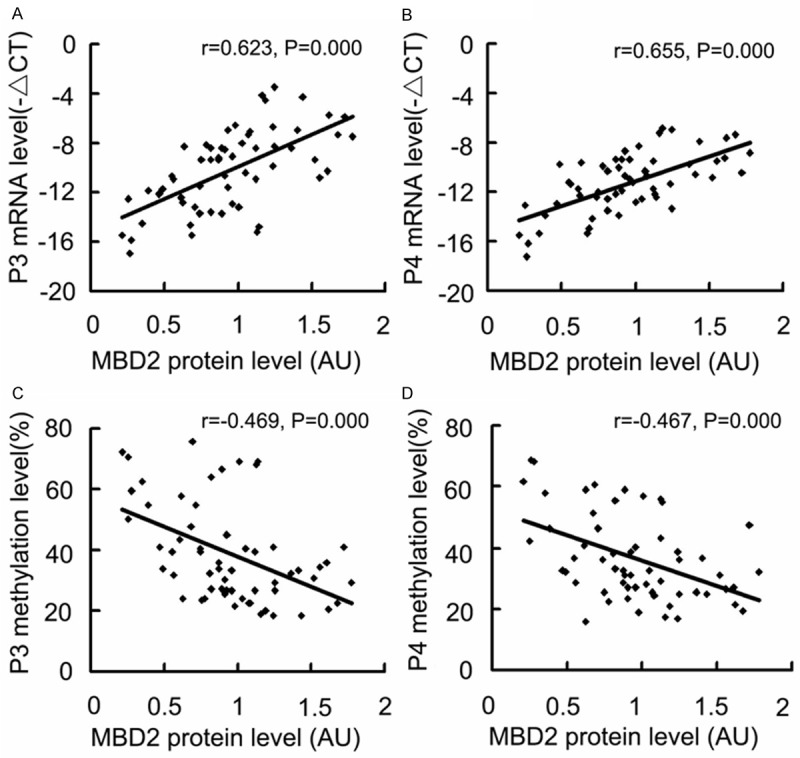
Effects of MBD2 expression on P3 and P4 mRNA expression levels and P3 and P4 promoter methylation levels in HCC specimens. The -ΔCT method was used to quantify quantitative RT-PCR results and the signal densitometric ratio (AU) of MBD2 versus β-actin Western blot results was used to quantify MBD2 protein level. The methylation levels of P3 promoter fragment (-540/-290 bp) and P4 promoter fragment (-555/-248 bp) were analyzed using bisulfite sequencing. A and B. The results of Pearson linear correlation analysis of correlation between P3 and P4 mRNA expression levels and MBD2 protein level. C and D. The results of Pearson linear correlation analysis of correlation between P3 and P4 promoter methylation levels and MBD2 protein level. AU, arbitrary units.
HBx interacts with MBD2 and CBP/p300 in vivo
Next, we investigated whether HBx could directly interact with MBD2 and CBP/p300. HepG2-HBx and HepG2-Mock cells were used for co-immunoprecipitation in which endogenous MBD2 and CBP/p300 proteins were expressed at detectable levels, as evidenced by Western blot analysis (Figure 9A). The cell lysates were immunoprecipitated with anti-HBx antibody, followed by Western blotting with anti-MBD2 or anti-CBP/p300 antibody (Figure 9B). Reverse co-immunoprecipitation was performed with anti-MBD2 or anti-CBP/p300 antibody, followed by Western blotting with anti-HBx antibody (Figure 9C-E). The results showed that HBx co-immunoprecipitated with endogenous MBD2 and CBP/p300. These findings suggest that HBx may directly interact with MBD2 and CBP/p300 and that a multi-protein complex MBD2-HBx-CBP/p300 may be induced by HBx in vivo.
Figure 9.
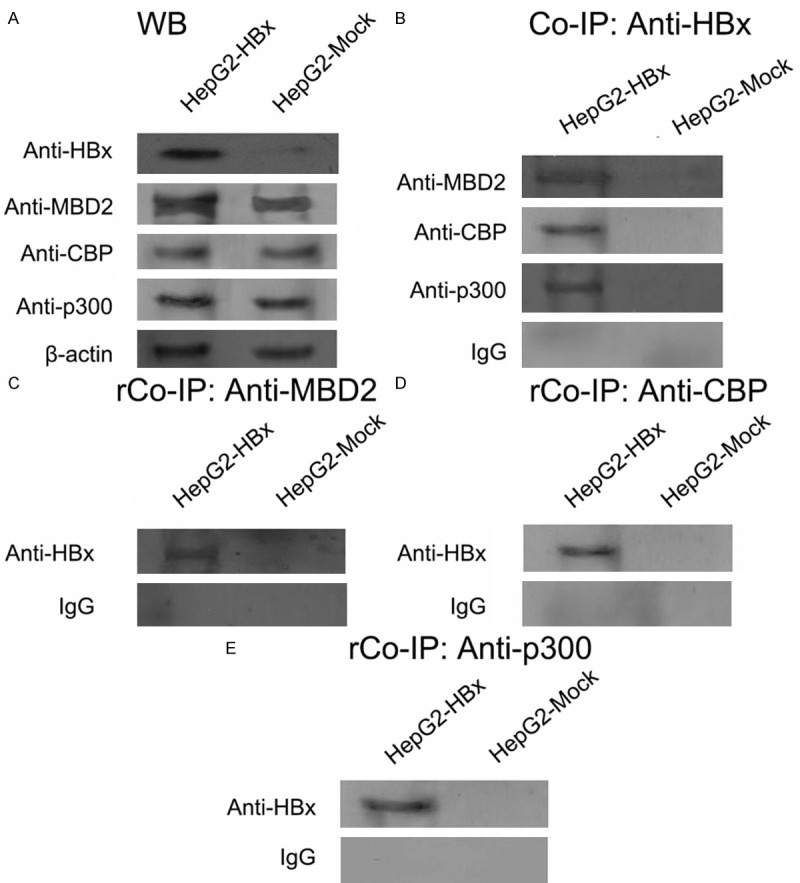
HBx interacts with MBD2 and CBP/p300 in HepG2-HBx and HepG2-Mock cells. (A) Western blot results (WB) of MBD2, CBP, and p300 expression. (B) Co-immunoprecipitation assay (Co-IP) results. The cell lysates from HepG2-HBx and HepG2-Mock cells were immunoprecipitated with anti-HBx antibody, followed by Western blotting with anti-MBD2, anti-CBP, and anti-p300 antibodies. IgG served as a negative control. (C-E) Reversal co-immunoprecipitation (rCo-IP) assay results. The cell lysates from HepG2-HBx and HepG2-Mock cells were immunoprecipitated with anti-MBD2 (C), anti-CBP (D), and anti-p300 (E) antibodies, followed by Western blotting with anti-HBx antibody. IgG served as a negative control.
HBx enhances MBD2 and CBP/p300 recruitment to the hypomethylated P3 and P4 promoters of the IGF-II gene in vivo
We further investigated whether HBx could activate endogenous MBD2 and CBP/p300 recruitment to the hypomethylated P3 and P4 promoters of the IGF-II gene. For this purpose, qChIP assays were performed with specific antibodies and PCRs using the designed primers against the P3 (-491/-331 bp) and P4 (-523/-398 bp) promoter fragments, which are within the above hypomethylated P3 (-540/-290 bp) and P4 (-555/-248 bp) promoter fragments, respectively. The results showed that HBx occupancy in the hypomethylated P3 and P4 promoter fragments greatly increased in HepG2-HBx cells compared with the control cells and that HBx elevated MBD2 and CBP/p300 recruitment to the above P3 and P4 promoter fragments with increased levels of the corresponding acetylated histone H3 lysine 18 (H3K18ac) and acetylated histone H4 lysine 5/8/12/16 (H4Kac) in HepG2-HBx cells compared with the control cells (Figure 10A and 10B). These data suggest that the increase in MBD2-HBx-CBP/p300 complex recruitment may be involved in the HBx-mediated hypomethylated activation of the P3 and P4 promoters.
Figure 10.
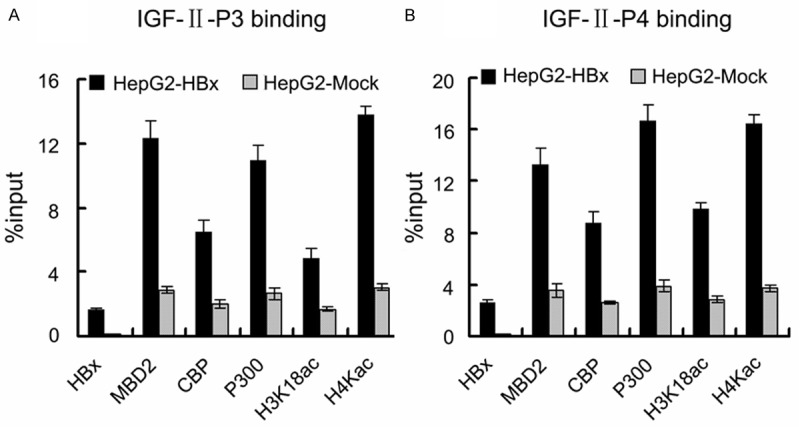
HBx increases endogenous MBD2 and CBP/p300 recruitment to the hypomethylated P3 and P4 promoters and elevates the regional H3K18ac and H4Kac levels. (A and B) The chromatin from HepG2-HBx and HepG2-Mock cells was isolated and immunoprecipitated with antibodies specific for anti-HBx, anti-MBD2, anti-CBP, anti-p300, anti-acetyl H3 lysine 18 (H3K18ac), and anti-acetylated histone H4 lysine 5/8/12/16 (H4Kac). Associated DNA was analyzed by qPCR using primers that amplify the hypomethylated P3 promoter fragment (-491/-331 bp) (A) and P4 promoter fragment (-523/-398 bp) (B). The occupancies of HBx, MBD2, CBP, p300, H3K18ac, and H4Kac in the hypomethylated P3 and P4 promoter fragments significantly increase in HepG2-HBx cells compared with HepG2-Mock cells (All the p values are 0.000).
MBD2 and CBP/p300 are required for IGF-II overexpression induced by the HBx-mediated hypomethylation of the P3 and P4 promoters
To further investigate the role of MBD2 and CBP/p300 in HBx-induced IGF-II overexpression, siRNAs were used to inhibit the endogenous expression of MBD2 and CBP/p300 in HepG2 cells. HepG2 cells were first transfected with the siRNAs specific for MBD2 and CBP/p300, and a negative control siRNA was used. After 24 h, the cells were co-transfected with pCMV-tag2B-HBx [HepG2 (HBx)] or pCMV-tag2B [HepG2 (Mock)]. The transfection of HepG2 cells with the siRNAs specific for MBD2 and CBP/p300 greatly decreased MBD2 and CBP/p300 expression compared with the negative control siRNA (Figure 11). The results shown in Figure 12 indicated that the depletion of MBD2 or CBP/p300 resulted in the significant decrease in P3 and P4 mRNA expression with the increase in the methylation of the above P3 and P4 promoter fragments compared with the negative control siRNA in HepG2 (Mock) cells. The transcriptional activation and hypomethylation of the P3 and P4 promoters by HBx were abolished in HepG2 (HBx) cells transfected with the siRNAs directed against MBD2 or CBP/p300 (Figure 12). Further results showed that the depletion of MBD2 or CBP/p300 led to reduced MBD2 or CBP/p300 recruitment to the hypomethylated P3 and P4 promoter fragments compared with the negative control siRNA (Figures 13 and 14) and that the depletion of CBP/p300 resulted in reduced levels of the corresponding H3K18ac and H4Kac (Figure 15A-D), but the depletion of MBD2 did not affect the levels of H3K18ac and H4Kac (Figure 15E-H). Furthermore, we found that the depletion of CBP/p300 in the above HepG2 cells resulted in reduced binding of MBD2 to the hypomethylated P3 and P4 promoter fragments and that, in contrast, CBP/p300 binding did not decrease after MBD2 depletion (Figures 13C, 13E, 13F, 14C, 14E and 14F), which suggests that CBP/p300 presence is partially required for MBD2 binding to the P3 and P4 promoters and that CBP/p300 binding is independent of MBD2 binding. Taken together, these data indicate that both endogenous MBD2 and CBP/p300 are necessary for HBx-induced IGF-II overexpression and that MBD2 binding is partially dependent on CBP/p300 presence.
Figure 11.
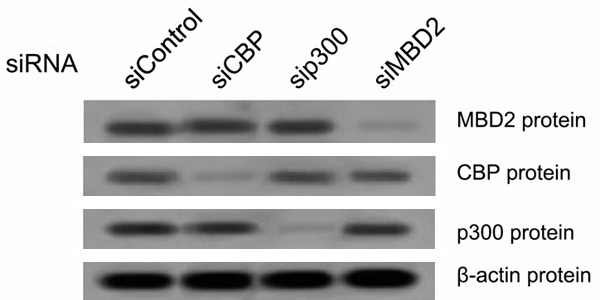
Western blot results of MBD2, CBP, and p300 protein expression in HepG2 cells transfected with the siRNA specific for MBD2, CBP, and p300 or with negative control siRNA.
Figure 12.
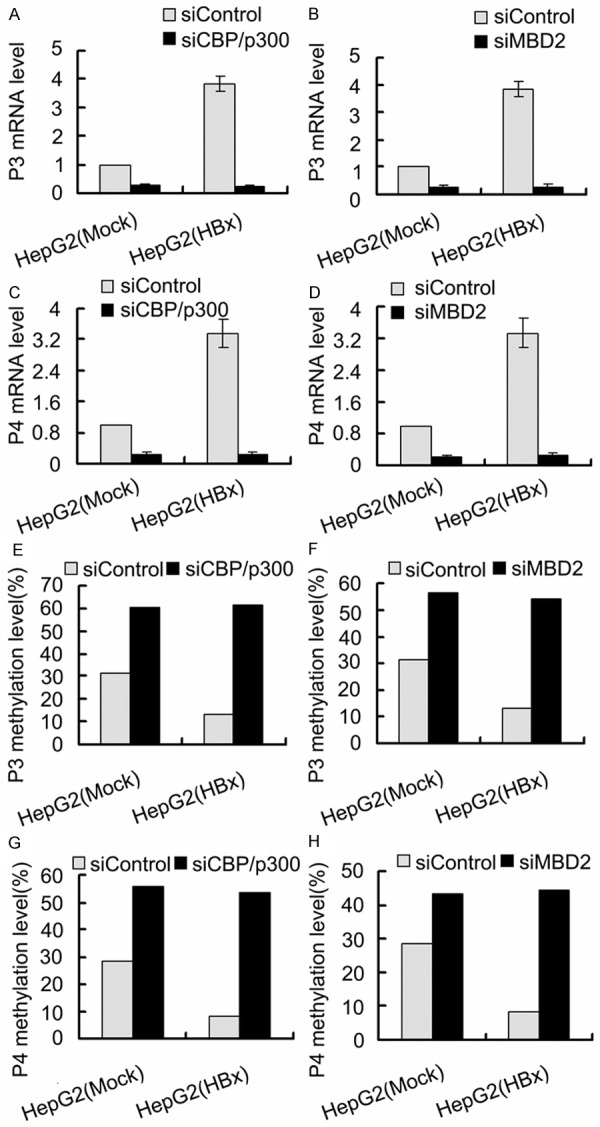
Effects of depletion of MBD2 or CBP/p300 on P3 and P4 mRNA levels and P3 and P4 promoter methylation levels in HepG2 (HBx) cells with transient HBx expression and in HepG2 (Mock) cells. The transfected quantities of HBx expression plasmid were 1.0 μg per 1 × 10⁶ cells. Depletion of MBD2 or CBP/p300 resulted in the significant decrease in P3 mRNA (A) (p = 0.000, p = 0.000) and (B) (p = 0.000, p = 0.000) and P4 mRNA (C) (p = 0.000, p = 0.000) and (D) (p = 0.000, p = 0.000) levels, and the increase in the methylation levels of P3 promoter (E). (p = 0.000, p = 0.000) and (F) (p = 0.000, p = 0.000) and P4 promoter (G). (p = 0.000, p = 0.000) and (H) (p = 0.010, p = 0.000) fragments compared with the negative control siRNA.
Figure 13.
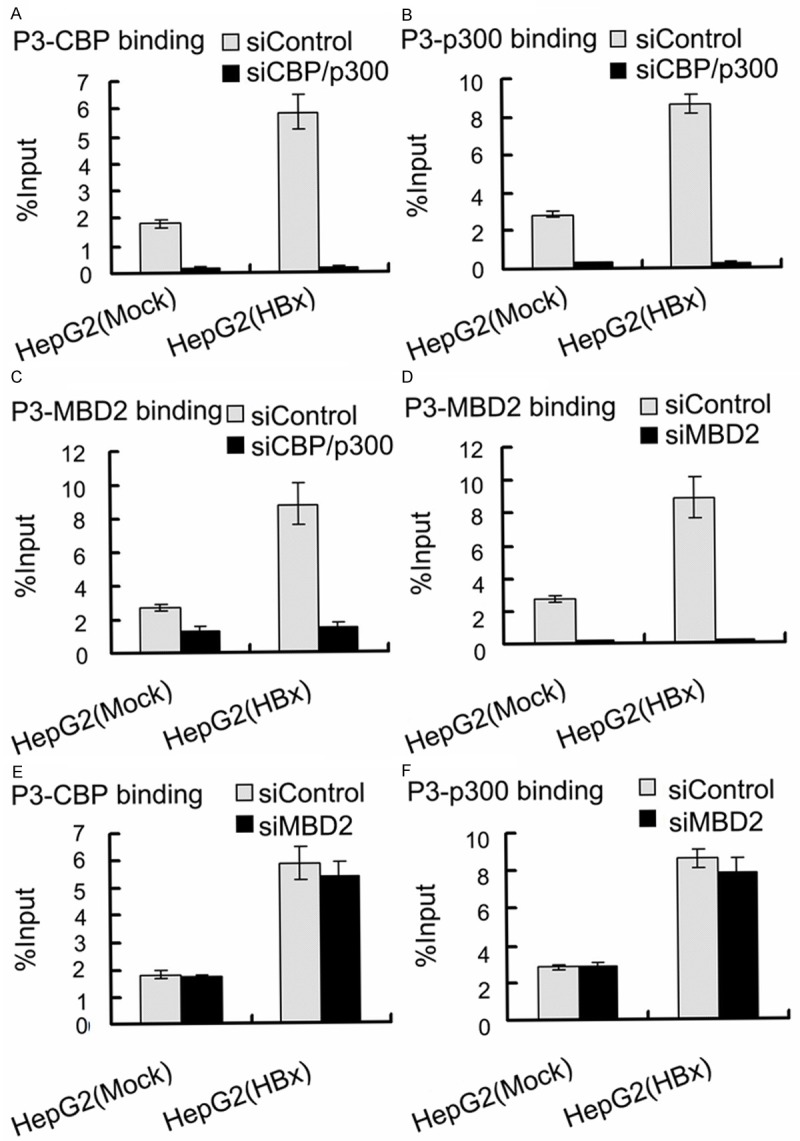
Effects of depletion of MBD2 or CBP/p300 on MBD2 or CBP/p300 binding to the hypomethylated P3 promoter fragment in HepG2 (HBx) cells with transient HBx expression and in HepG2 (Mock) cells. The transfected quantities of HBx expression plasmid were 1.0 μg per 1 × 10⁶ cells. qChIP assays were performed according to “Materials and Methods”. Depletion of CBP/p300 reduced CBP (A) (p = 0.000, p = 0.000), p300 (B) (p = 0.000, p = 0.000), and MBD2 (C) (p = 0.000, p = 0.002) binding to the hypomethylated P3 promoter fragment; depletion of MBD2 only reduced MBD2 (D) (p = 0.000, p = 0.000), but not CBP (E) (p = 0.383, p = 0.385) and p300 (F) (p = 0.226, p = 0.713), binding to the hypomethylated P3 promoter fragment compared with the negative control siRNA in HepG2 (HBx) and HepG2 (Mock) cells.
Figure 14.
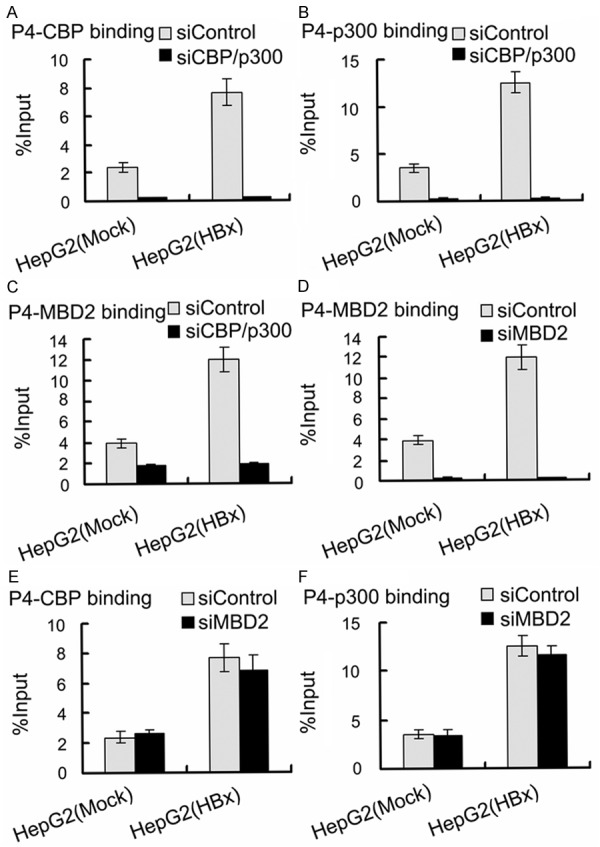
Effects of depletion of MBD2 or CBP/p300 on MBD2 or CBP/p300 binding to the hypomethylated P4 promoter fragment in HepG2 (HBx) cells with transient HBx expression and in HepG2 (Mock) cells. The transfected quantities of HBx expression plasmid were 1.0 μg per 1 × 10⁶ cells. qChIP assays were performed according to “Materials and Methods”. Depletion of CBP/p300 reduced CBP (A) (p = 0.000, p = 0.000), p300 (B) (p = 0.000, p = 0.000), and MBD2 (C) (p = 0.000, p = 0.000) binding to the hypomethylated P4 promoter fragment; depletion of MBD2 only reduced MBD2 (D) (p = 0.000, p = 0.000), but not CBP (E) (p = 0.345, p = 0.472) and p300 (F) (p = 0.332, p = 0.818), binding to the hypomethylated P4 promoter fragment compared with the negative control siRNA in HepG2 (HBx) and HepG2 (Mock) cells.
Figure 15.
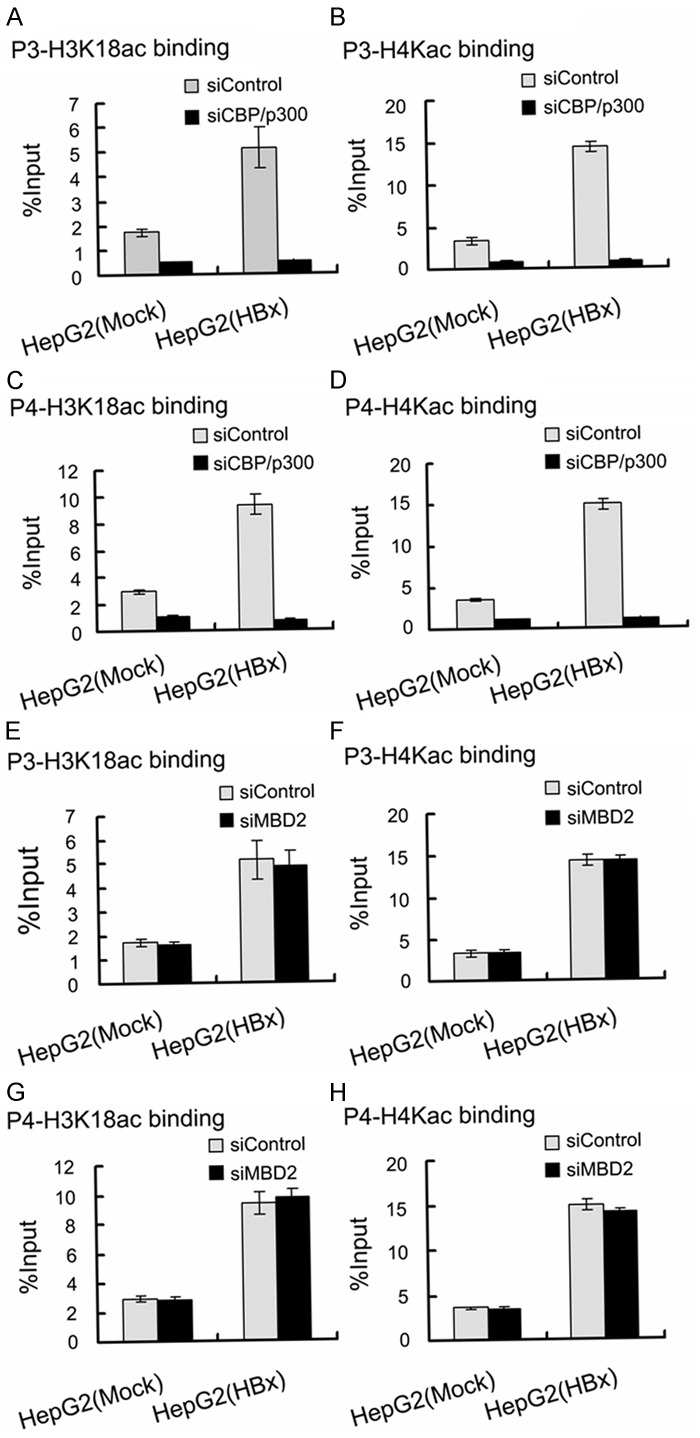
Effects of depletion of MBD2 or CBP/p300 on H3K18ac and H4Kac levels associated with the hypomethylated P3 and P4 promoter fragments in HepG2 (HBx) cells with transient HBx expression and in HepG2 (Mock) cells. The transfected quantities of HBx expression plasmid were 1.0 μg per 1 × 10⁶ cells. qChIP assays were performed according to “Materials and Methods”. Depletion of CBP/p300 reduced the levels of H3K18ac (A) (p = 0.000, p = 0.000) and H4Kac (B) (p = 0.000, p = 0.000) binding to the hypomethylated P3 promoter fragment, and the levels of H3K18ac (C) (p = 0.000, p = 0.000) and H4Kac (D) (p = 0.000, p = 0.000) binding to the hypomethylated P4 promoter fragment. Depletion of MBD2 did not affect the levels of the H3K18ac (E) (p = 0.361, p = 0.671) and H4Kac (F) (p = 0.776, p = 0.930) binding to the hypomethylated P3 promoter fragment, and the levels of H3K18ac (G) (p = 0.480, p = 0.505) and H4Kac (H) (p = 0.477, p = 0.102) binding to the hypomethylated P4 promoter fragment.
Discussion
Elevated expression levels of IGF-II have been detected in a variety of human cancers, including cancers of the breast, bladder, prostate, colon, and liver [12,39,40], which is mainly results from the reactivation of the fetal promoters P3 and P4 [19,41]. However, the mechanisms that may contribute to the re-expression of the two fetal transcripts are not well understood.
In the current study, our data showed that the stable or transient expression of HBx enhanced P3 mRNA, P4 mRNA, and IGF-II protein levels and reduced the methylation levels of the P3 and P4 promoters in HepG2 and Huh7 cells. Consistent with the above results, the transient expression of HBx stimulated the luciferase activity of in vitro premethylated P3 and P4 promoter-luciferase constructs in Huh-7 cells in a dose-dependent manner. On the other hand, the higher levels of P3 and P4 mRNA and the lower methylation levels of the P3 and P4 promoters were detected in HCC samples with HBV infection compared with HCC samples without HBV infection, and P3 and P4 mRNA levels were positively correlated to HBx protein level and the methylation levels of the P3 and P4 promoters were negatively correlated to HBx protein level in HCC specimens. Moreover, our results also revealed that P3 and P4 mRNA abundances were negatively correlated to the methylation status of the P3 and P4 promoters, respectively, in HCC specimens. These in vitro and in vivo findings suggest that HBx may induce the hypomethylation of the P3 and P4 promoters and, in turn, promote P3 and P4 mRNA expression in human HCC. Similar to our findings, Tong et al. reported that HBx induced the hypomethylation of the promoters of three genes (ALDH1, RBP, and CRPB1) and activated their transcription in a stable HBx-transfected cell line (HepG2-HBx) [42]. Zheng et al. also found that the promoters of IGFBP3 and CDH6, which were two HBx-activated genes in HBx-Ad-transfected Huh7 cells, were hypomethylated compared with the control cells [43].
MBD2 is a member of a family of methyl-CpG-binding proteins that has been reported to be both a transcriptional repressor and a DNA demethylase [26,44]. Its activity might depend on the promoter context as well as the accessibility of acetylated histones [28]. The transcriptional coactivators CBP and p300 are key regulators of gene transcription [45], and also possess HAT activity [46,47]. CBP and p300 HAT domains have > 90% sequence identity, and are conserved in metazoans with many overlapping functions and therefore are referred to as p300/CBP [48].
To further understand the potential mechanisms involved in the hypomethylation of the P3 and P4 promoters and their increased mRNA expression induced by HBx, we investigated whether HBx could change the levels of epigenetic-associated proteins, such as MBD2 and CBP/p300, and whether HBx could interact with MBD2 and CBP/p300 and then enhance their recruitment to the hypomethylated P3 and P4 promoters. We first showed that the stable or transient expression of HBx elevated the mRNA and protein levels of MBD2, but not CBP/p300 (data not shown), in HepG2 and Huh-7 cells; that higher MBD2 protein level was detected in HCC samples with HBV infection compared to HCC samples without HBV infection; and that MBD2 and HBx protein levels were positively correlated in HCC samples. Next, we showed that the methylation levels of the P3 and P4 promotes were negatively correlated to MBD2 protein level, and that P3 and P4 mRNA abundances were positively correlated to MBD2 protein level in HCC samples. Taken together, these results suggest that MBD2 overexpression induced by HBx may be involved in the hypomethylation and transcriptional activation of the P3 and P4 promoters. Our data are similar to a previous report in which Stefanska et al. found that MBD2 expression is higher in HCC samples than that in matched adjacent normal tissues and that MBD2 expression correlates with the extent of hypomethylation of the 9 genes in HCC samples [38]. Similarly, Chuturgoon et al. reported that Fumonisin B1 significantly upregulated MBD2 demethylase expression and activity in HepG2 cells [49]. Consistent with our results, MBD2 was previously shown to be involved in the activation and demethylation of PLAU and MMP2 in breast and prostate cancer cells [50,51].
Further, co-immunoprecipitation analysis indicated that HBx physically interacted with MBD2 and CBP/p300 in vivo, suggesting the formation of a multi-protein complex MBD2-HBx-CBP/p300. qChIP assays revealed that HBx immunoprecipitated the hypomethylated fragments of the P3 (-491/-331 bp) and P4 (-523/-398 bp) promoters and that HBx enhanced MBD2 and CBP/p300 binding to the hypomethylated P3 and P4 fragments. Further results indicated that increased acetylation levels of the corresponding histones H3 and H4 were also detected. A previous study has demonstrated that HBx interacts physically with DNMT3A and recruits it to the hypermethylated promoters of the MT1F and IL4R genes to repress their expression [43]. HBx has also been observed to interact and cooperate with CBP/p300 to modify the chromatin dynamics of target genes and to synergistically enhance CREB activity [37].
Finally, using siRNA knockdown assays, we found that both MBD2 and CBP/p300 are necessary for the P3 and P4 mRNA overexpression induced by the HBx-mediated hypomethylation of the P3 and P4 promoters, and that the depletion of CBP/p300 brought about reduction of both CBP/p300 and MBD2 binding to the hypomethylated P3 and P4 promoter fragments and reduction of the corresponding H3K18ac and H4Kac levels, but the depletion of MBD2 only reduced MBD2 binding and did not affect CBP/p300 binding and the corresponding H3K18ac and H4Kac levels, suggesting that the presence of endogenous CBP/p300 is partially required for MBD2 binding and its demethylase activity, and that CBP/p300-mediated acetylation of histones H3 and H4 may be a rate-limiting step for the hypomethylation and reactivation of these two promoters in HCC. Similar to the results, Cervoni et al. showed that the demethylation of ectopically methylated DNA is dependent on both the abundance of MBD2 demethylase and the state of histone acetylation, and the ectopic expression of MBD2 does not demethylate a methylated DNA that is not associated with acetylated histones even after TSA treatment [28].
In summary, the data presented in this study support an attractive and potentially general model in which MBD2 becomes a DNA demethylase and activates gene expression by causing demethylation of certain promoters when this protein associates with HATs (such as CBP/p300) that acetylate histones. In the present study, this model indicates that HBx directly interacts with MBD2 and CBP/p300 and induces formation of the MBD2-HBx-CBP/p300 complex, which is recruited to the IGF-II-P3 and P4 promoters, of which CBP/p300 HAT activity enhances acetylation levels of the corresponding histones H3 and H4. This acetylation results in a more open chromatin configuration that increases the accessibility of the MBD2 methylase to the DNA to activate this gene by removing the repressive methyl residues. In this process, increased MBD2 expression by HBx may augment the hypomethylation and transcriptional activation of the P3 and P4 promoters, and CBP/p300-mediated acetylation of histones H3 and H4 is essential for MBD2 demethylase activity.
Acknowledgements
We wish to thank Dr. Jian Xiao Tian for help with the manuscript; Department of Molecular Biology, College of Life Science and Technology, Jinan University for quantitative chromatin immunoprecipitation assays. This work was supported by Natural Science Foundation of Guangdong Province, China (No. 915100890100000), The Fundamental Research Funds for the Central Universities, China (No. 11610407), Medical Scientific Research Foundation of Guangdong Province, China (No. A2012332; No. A2013344), and Scientific Research Training Foundation of The First Affiliated Hospital, Jinan University, Guangzhou, China (No. 2012109).
Disclosure of conflict of interest
None.
References
- 1.Trepo C, Chan HL, Lok A. Hepatitis B virus infection. Lancet. 2014;384:2053–2063. doi: 10.1016/S0140-6736(14)60220-8. [DOI] [PubMed] [Google Scholar]
- 2.Lucifora J, Arzberger S, Durantel D, Belloni L, Strubin M, Levrero M, Zoulim F, Hantz O, Protzer U. Hepatitis B virus X protein is essential to initiate and maintain virus replication after infection. J Hepatol. 2011;55:996–1003. doi: 10.1016/j.jhep.2011.02.015. [DOI] [PubMed] [Google Scholar]
- 3.Neuveut C, Wei Y, Buendia MA. Mechanisms of HBV-related hepatocarcinogenesis. J Hepatol. 2010;52:594–604. doi: 10.1016/j.jhep.2009.10.033. [DOI] [PubMed] [Google Scholar]
- 4.Lupberger J, Hildt E. Hepatitis B virus-induced oncogenesis. World J Gastroenterol. 2007;13:74–81. doi: 10.3748/wjg.v13.i1.74. [DOI] [PMC free article] [PubMed] [Google Scholar]
- 5.Jung JK, Arora P, Pagano JS, Jang KL. Expression of DNA methyltransferase 1 is activated by hepatitis B virus X protein via a regulatory circuit involving the p16INK4a-cyclin D1-CDK 4/6-pRb-E2F1 pathway. Cancer Res. 2007;67:5771–5778. doi: 10.1158/0008-5472.CAN-07-0529. [DOI] [PubMed] [Google Scholar]
- 6.Park IY, Sohn BH, Yu E, Suh DJ, Chung YH, Lee JH, Surzycki SJ, Lee YI. Aberrant epigenetic modifications in hepatocarcinogenesis induced by hepatitis B virus X protein. Gastroenterology. 2007;132:1476–1494. doi: 10.1053/j.gastro.2007.01.034. [DOI] [PubMed] [Google Scholar]
- 7.Constancia M, Hemberger M, Hughes J, Dean W, Ferguson-Smith A, Fundele R, Stewart F, Kelsey G, Fowden A, Sibley C, Reik W. Placental-specific IGF-II is a major modulator of placental and fetal growth. Nature. 2002;417:945–948. doi: 10.1038/nature00819. [DOI] [PubMed] [Google Scholar]
- 8.Brissenden JE, Ullrich A, Francke U. Human chromosomal mapping of genes for insulin-like growth factors I and II and epidermal growth factor. Nature. 1984;310:781–784. doi: 10.1038/310781a0. [DOI] [PubMed] [Google Scholar]
- 9.Jeng YM, Chang CC, Hu FC, Chou HY, Kao HL, Wang TH, Hsu HC. RNA-binding protein insulin-like growth factor II mRNA-binding protein 3 expression promotes tumor invasion and predicts early recurrence and poor prognosis in hepatocellular carcinoma. Hepatology. 2008;48:1118–1127. doi: 10.1002/hep.22459. [DOI] [PubMed] [Google Scholar]
- 10.Breuhahn K, Longerich T, Schirmacher P. Dysregulation of growth factor signaling in human hepatocellular carcinoma. Oncogene. 2006;25:3787–3800. doi: 10.1038/sj.onc.1209556. [DOI] [PubMed] [Google Scholar]
- 11.Chao W, D’Amore PA. IGF2: epigenetic regulation and role in development and disease. Cytokine Growth Factor Rev. 2008;19:111–120. doi: 10.1016/j.cytogfr.2008.01.005. [DOI] [PMC free article] [PubMed] [Google Scholar]
- 12.Kalla Singh S, Tan QW, Brito C, De Leon M, Garberoglio C, De Leon D. Differential insulin-like growth factor II (IGF-II) expression: A potential role for breast cancer survival disparity. Growth Horm IGF Res. 2010;20:162–170. doi: 10.1016/j.ghir.2009.12.002. [DOI] [PMC free article] [PubMed] [Google Scholar]
- 13.Wilkin F, Gagne N, Paquette J, Oligny LL, Deal C. Pediatric adrenocortical tumors: molecular events leading to insulin-like growth factor II gene overexpression. J Clin Endocrinol Metab. 2000;85:2048–2056. doi: 10.1210/jcem.85.5.6589. [DOI] [PubMed] [Google Scholar]
- 14.Breuhahn K, Schirmacher P. Reactivation of the insulin-like growth factor-II signaling pathway in human hepatocellular carcinoma. World J Gastroenterol. 2008;14:1690–1698. doi: 10.3748/wjg.14.1690. [DOI] [PMC free article] [PubMed] [Google Scholar]
- 15.Breuhahn K, Vreden S, Haddad R, Beckebaum S, Stippel D, Flemming P, Nussbaum T, Caselmann WH, Haab BB, Schirmacher P. Molecular profiling of human hepatocellular carcinoma defines mutually exclusive interferon regulation and insulin-like growth factor II overexpression. Cancer Res. 2004;64:6058–6064. doi: 10.1158/0008-5472.CAN-04-0292. [DOI] [PubMed] [Google Scholar]
- 16.Lund P, Schubert D, Niketeghad F, Schirmacher P. Autocrine inhibition of chemotherapy response in human liver tumor cells by insulin-like growth factor-II. Cancer Lett. 2004;206:85–96. doi: 10.1016/j.canlet.2003.10.018. [DOI] [PubMed] [Google Scholar]
- 17.Nussbaum T, Samarin J, Ehemann V, Bissinger M, Ryschich E, Khamidjanov A, Yu X, Gretz N, Schirmacher P, Breuhahn K. Autocrine insulin-like growth factor-II stimulation of tumor cell migration is a progression step in human hepatocarcinogenesis. Hepatology. 2008;48:146–156. doi: 10.1002/hep.22297. [DOI] [PubMed] [Google Scholar]
- 18.Luo JH, Ren B, Keryanov S, Tseng GC, Rao UN, Monga SP, Strom S, Demetris AJ, Nalesnik M, Yu YP, Ranganathan S, Michalopoulos GK. Transcriptomic and genomic analysis of human hepatocellular carcinomas and hepatoblastomas. Hepatology. 2006;44:1012–1024. doi: 10.1002/hep.21328. [DOI] [PMC free article] [PubMed] [Google Scholar]
- 19.Tang SH, Yang DH, Huang W, Zhou M, Zhou HK, Lu XH, Ye G. Differential promoter usage for insulin-like growth factor-II gene in Chinese hepatocellular carcinoma with hepatitis B virus infection. Cancer Detect Prev. 2006;30:192–203. doi: 10.1016/j.cdp.2005.12.004. [DOI] [PubMed] [Google Scholar]
- 20.Kew MC. Hepatitis B virus x protein in the pathogenesis of hepatitis B virus-induced hepatocellular carcinoma. J Gastroenterol Hepatol. 2011;26(Suppl 1):144–152. doi: 10.1111/j.1440-1746.2010.06546.x. [DOI] [PubMed] [Google Scholar]
- 21.Qian J, Yao D, Dong Z, Wu W, Qiu L, Yao N, Li S, Bian Y, Wang Z, Shi G. Characteristics of hepatic igf-ii expression and monitored levels of circulating igf-ii mRNA in metastasis of hepatocellular carcinoma. Am J Clin Pathol. 2010;134:799–806. doi: 10.1309/AJCPTFDSE2V3LCZP. [DOI] [PubMed] [Google Scholar]
- 22.Metivier R, Gallais R, Tiffoche C, Le Peron C, Jurkowska RZ, Carmouche RP, Ibberson D, Barath P, Demay F, Reid G, Benes V, Jeltsch A, Gannon F, Salbert G. Cyclical DNA methylation of a transcriptionally active promoter. Nature. 2008;452:45–50. doi: 10.1038/nature06544. [DOI] [PubMed] [Google Scholar]
- 23.Schubeler D. Function and information content of DNA methylation. Nature. 2015;517:321–326. doi: 10.1038/nature14192. [DOI] [PubMed] [Google Scholar]
- 24.Yang Y, Bedford MT. Protein arginine methyltransferases and cancer. Nat Rev Cancer. 2013;13:37–50. doi: 10.1038/nrc3409. [DOI] [PubMed] [Google Scholar]
- 25.Barr H, Hermann A, Berger J, Tsai HH, Adie K, Prokhortchouk A, Hendrich B, Bird A. Mbd2 contributes to DNA methylation-directed repression of the Xist gene. Mol Cell Biol. 2007;27:3750–3757. doi: 10.1128/MCB.02204-06. [DOI] [PMC free article] [PubMed] [Google Scholar]
- 26.Detich N, Theberge J, Szyf M. Promoter-specific activation and demethylation by MBD2/demethylase. J Biol Chem. 2002;277:35791–35794. doi: 10.1074/jbc.C200408200. [DOI] [PubMed] [Google Scholar]
- 27.Fujita H, Fujii R, Aratani S, Amano T, Fukamizu A, Nakajima T. Antithetic effects of MBD2a on gene regulation. Mol Cell Biol. 2003;23:2645–2657. doi: 10.1128/MCB.23.8.2645-2657.2003. [DOI] [PMC free article] [PubMed] [Google Scholar]
- 28.Cervoni N, Szyf M. Demethylase activity is directed by histone acetylation. J Biol Chem. 2001;276:40778–40787. doi: 10.1074/jbc.M103921200. [DOI] [PubMed] [Google Scholar]
- 29.Rando OJ, Chang HY. Genome-wide views of chromatin structure. Annu Rev Biochem. 2009;78:245–271. doi: 10.1146/annurev.biochem.78.071107.134639. [DOI] [PMC free article] [PubMed] [Google Scholar]
- 30.Allis CD, Berger SL, Cote J, Dent S, Jenuwien T, Kouzarides T, Pillus L, Reinberg D, Shi Y, Shiekhattar R, Shilatifard A, Workman J, Zhang Y. New nomenclature for chromatin-modifying enzymes. Cell. 2007;131:633–636. doi: 10.1016/j.cell.2007.10.039. [DOI] [PubMed] [Google Scholar]
- 31.Bedford DC, Kasper LH, Fukuyama T, Brindle PK. Target gene context influences the transcriptional requirement for the KAT3 family of CBP and p300 histone acetyltransferases. Epigenetics. 2010;5:9–15. doi: 10.4161/epi.5.1.10449. [DOI] [PMC free article] [PubMed] [Google Scholar]
- 32.Livak KJ, Schmittgen TD. Analysis of relative gene expression data using real-time quantitative PCR and the 2(-Delta Delta C(T)) Method. Methods. 2001;25:402–408. doi: 10.1006/meth.2001.1262. [DOI] [PubMed] [Google Scholar]
- 33.Liao B, Hu Y, Herrick DJ, Brewer G. The RNA-binding protein IMP-3 is a translational activator of insulin-like growth factor II leader-3 mRNA during proliferation of human K562 leukemia cells. J Biol Chem. 2005;280:18517–18524. doi: 10.1074/jbc.M500270200. [DOI] [PubMed] [Google Scholar]
- 34.Saito Y, Kanai Y, Sakamoto M, Saito H, Ishii H, Hirohashi S. Expression of mRNA for DNA methyltransferases and methyl-CpG-binding proteins and DNA methylation status on CpG islands and pericentromeric satellite regions during human hepatocarcinogenesis. Hepatology. 2001;33:561–568. doi: 10.1053/jhep.2001.22507. [DOI] [PubMed] [Google Scholar]
- 35.Jiang J, Wei Y, Shen J, Liu D, Chen X, Zhou J, Zong H, Yun X, Kong X, Zhang S, Yang Y, Gu J. Functional interaction of E1AF and Sp1 in glioma invasion. Mol Cell Biol. 2007;27:8770–8782. doi: 10.1128/MCB.02302-06. [DOI] [PMC free article] [PubMed] [Google Scholar]
- 36.Detich N, Bovenzi V, Szyf M. Valproate induces replication-independent active DNA demethylation. J Biol Chem. 2003;278:27586–27592. doi: 10.1074/jbc.M303740200. [DOI] [PubMed] [Google Scholar]
- 37.Cougot D, Wu Y, Cairo S, Caramel J, Renard CA, Levy L, Buendia MA, Neuveut C. The hepatitis B virus X protein functionally interacts with CREB-binding protein/p300 in the regulation of CREB-mediated transcription. J Biol Chem. 2007;282:4277–4287. doi: 10.1074/jbc.M606774200. [DOI] [PubMed] [Google Scholar]
- 38.Stefanska B, Huang J, Bhattacharyya B, Suderman M, Hallett M, Han ZG, Szyf M. Definition of the landscape of promoter DNA hypomethylation in liver cancer. Cancer Res. 2011;71:5891–5903. doi: 10.1158/0008-5472.CAN-10-3823. [DOI] [PubMed] [Google Scholar]
- 39.Fichera E, Liang S, Xu Z, Guo N, Mineo R, Fujita-Yamaguchi Y. A quantitative reverse transcription and polymerase chain reaction assay for human IGF-II allows direct comparison of IGF-II mRNA levels in cancerous breast, bladder, and prostate tissues. Growth Horm IGF Res. 2000;10:61–70. doi: 10.1054/ghir.2000.0141. [DOI] [PubMed] [Google Scholar]
- 40.Gutschner T, Hammerle M, Pazaitis N, Bley N, Fiskin E, Uckelmann H, Heim A, Grobeta M, Hofmann N, Geffers R, Skawran B, Longerich T, Breuhahn K, Schirmacher P, Muhleck B, Huttelmaier S, Diederichs S. Insulin-like growth factor 2 mRNA-binding protein 1 (IGF2BP1) is an important protumorigenic factor in hepatocellular carcinoma. Hepatology. 2014;59:1900–1911. doi: 10.1002/hep.26997. [DOI] [PubMed] [Google Scholar]
- 41.Tovar V, Alsinet C, Villanueva A, Hoshida Y, Chiang DY, Sole M, Thung S, Moyano S, Toffanin S, Minguez B, Cabellos L, Peix J, Schwartz M, Mazzaferro V, Bruix J, Llovet JM. IGF activation in a molecular subclass of hepatocellular carcinoma and pre-clinical efficacy of IGF-1R blockage. J Hepatol. 2010;52:550–559. doi: 10.1016/j.jhep.2010.01.015. [DOI] [PMC free article] [PubMed] [Google Scholar]
- 42.Tong A, Gou L, Lau QC, Chen B, Zhao X, Li J, Tang H, Chen L, Tang M, Huang C, Wei YQ. Proteomic profiling identifies aberrant epigenetic modifications induced by hepatitis B virus X protein. J Proteome Res. 2009;8:1037–1046. doi: 10.1021/pr8008622. [DOI] [PubMed] [Google Scholar]
- 43.Zheng DL, Zhang L, Cheng N, Xu X, Deng Q, Teng XM, Wang KS, Zhang X, Huang J, Han ZG. Epigenetic modification induced by hepatitis B virus X protein via interaction with de novo DNA methyltransferase DNMT3A. J Hepatol. 2009;50:377–387. doi: 10.1016/j.jhep.2008.10.019. [DOI] [PubMed] [Google Scholar]
- 44.Bhattacharya SK, Ramchandani S, Cervoni N, Szyf M. A mammalian protein with specific demethylase activity for mCpG DNA. Nature. 1999;397:579–583. doi: 10.1038/17533. [DOI] [PubMed] [Google Scholar]
- 45.Kalkhoven E. CBP and p300: HATs for different occasions. Biochem Pharmacol. 2004;68:1145–1155. doi: 10.1016/j.bcp.2004.03.045. [DOI] [PubMed] [Google Scholar]
- 46.Crump NT, Hazzalin CA, Bowers EM, Alani RM, Cole PA, Mahadevan LC. Dynamic acetylation of all lysine-4 trimethylated histone H3 is evolutionarily conserved and mediated by p300/CBP. Proc Natl Acad Sci U S A. 2011;108:7814–7819. doi: 10.1073/pnas.1100099108. [DOI] [PMC free article] [PubMed] [Google Scholar]
- 47.Kornacki JR, Stuparu AD, Mrksich M. Acetyltransferase p300/CBP Associated Factor (PCAF) Regulates Crosstalk-Dependent Acetylation of Histone H3 by Distal Site Recognition. ACS Chem Biol. 2015;10:157–164. doi: 10.1021/cb5004527. [DOI] [PMC free article] [PubMed] [Google Scholar]
- 48.Tang Y, Holbert MA, Wurtele H, Meeth K, Rocha W, Gharib M, Jiang E, Thibault P, Verreault A, Cole PA, Marmorstein R. Fungal Rtt109 histone acetyltransferase is an unexpected structural homolog of metazoan p300/CBP. Nat Struct Mol Biol. 2008;15:738–745. doi: 10.1038/nsmb.1448. [DOI] [PMC free article] [PubMed] [Google Scholar]
- 49.Chuturgoon A, Phulukdaree A, Moodley D. Fumonisin B1 induces global DNA hypomethylation in HepG2 cells - An alternative mechanism of action. Toxicology. 2014;315:65–69. doi: 10.1016/j.tox.2013.11.004. [DOI] [PubMed] [Google Scholar]
- 50.Pakneshan P, Szyf M, Farias-Eisner R, Rabbani SA. Reversal of the hypomethylation status of urokinase (uPA) promoter blocks breast cancer growth and metastasis. J Biol Chem. 2004;279:31735–31744. doi: 10.1074/jbc.M401669200. [DOI] [PubMed] [Google Scholar]
- 51.Shukeir N, Pakneshan P, Chen G, Szyf M, Rabbani SA. Alteration of the methylation status of tumor-promoting genes decreases prostate cancer cell invasiveness and tumorigenesis in vitro and in vivo. Cancer Res. 2006;66:9202–9210. doi: 10.1158/0008-5472.CAN-06-1954. [DOI] [PubMed] [Google Scholar]