

Abstract
Epistatic miniarray profile (E-MAP) is a popular large-scale genetic interaction discovery platform. E-MAPs benefit from quantitative output, which makes it possible to detect subtle interactions with greater precision. However, due to the limits of biotechnology, E-MAP studies fail to measure genetic interactions for up to 40% of gene pairs in an assay. Missing measurements can be recovered by computational techniques for data imputation, in this way completing the interaction profiles and enabling downstream analysis algorithms that could otherwise be sensitive to missing data values. We introduce a new interaction data imputation method called network-guided matrix completion (NG-MC). The core part of NG-MC is low-rank probabilistic matrix completion that incorporates prior knowledge presented as a collection of gene networks. NG-MC assumes that interactions are transitive, such that latent gene interaction profiles inferred by NG-MC depend on the profiles of their direct neighbors in gene networks. As the NG-MC inference algorithm progresses, it propagates latent interaction profiles through each of the networks and updates gene network weights toward improved prediction. In a study with four different E-MAP data assays and considered protein–protein interaction and gene ontology similarity networks, NG-MC significantly surpassed existing alternative techniques. Inclusion of information from gene networks also allowed NG-MC to predict interactions for genes that were not included in original E-MAP assays, a task that could not be considered by current imputation approaches.
Key words: : data integration, epistatic miniarray profile, gene network, genetic interaction, matrix completion, missing value imputation
1. Introduction
The epistatic miniarray profile (E-MAP) technology (Schuldiner et al., 2005; Collins et al., 2006; Roguev et al., 2008; Wilmes et al., 2008; Surma et al., 2013) is based on a synthetic genetic array (SGA) approach (Tong et al., 2001, 2004) and generates quantitative measurements of both positive and negative genetic interactions (GIs) between genes. E-MAP was developed to study the phenomenon of epistasis, wherein the presence of one mutation modulates the effect of another mutation. The power of epistasis analysis is greatly enhanced by quantitative measurements of interactions (Collins et al., 2006). E-MAP has provided high-throughput measurements of hundreds of thousands of GIs in yeast (Schuldiner et al., 2005; Collins et al., 2007; Wilmes et al., 2008) and has been shown to significantly improve gene function prediction (Collins et al., 2007). However, E-MAP data suffer from a large number of missing values that can be as high as ∼40% for a given assay (see also Table 1). Missing values correspond to pairs of genes for which the strength of the interaction could not be measured during the experimental procedure or that were subsequently removed due to low reliability. A high proportion of missing values can adversely affect analysis algorithms or even prevent their use (Nanni et al., 2012). Missing data can introduce instability in clustering results (de Brevern et al., 2004) or bias the inference of prediction models (Liew et al., 2011). Accurate imputation of quantitative GIs is therefore an appealing option to improve downstream data analysis and correspondence between genetic and functional similarity (Collins et al., 2007; Pu et al., 2008; Bandyopadhyay et al., 2008; Ulitsky et al., 2008; Järvinen et al., 2008).
Table 1.
Overview of the E-MAPs Considered
| Data set | Genes | Missing interactions | Measured interactions |
|---|---|---|---|
| Chromosome biology | 743 | 34.0% | 187,000 |
| Lipid | 741 | 9.2% | 250,000 |
| RNA | 552 | 29.6% | 107,000 |
| Early secretory pathway | 424 | 7.5% | 83,000 |
The missing value problem in E-MAPs resembles that from gene expression data where imputation has been studied well (Troyanskaya et al., 2001; Brock et al., 2008; Liew et al., 2011). The objective of both tasks is to estimate the values of missing elements in the given incomplete data matrix. Both types of data may exhibit correlation between mutant and gene profiles that is indicative of pathway membership in the case of E-MAP data (Ryan et al., 2010) and coregulation in the case of gene expression data. E-MAP data sets are therefore often investigated with tools originally developed for gene expression data analysis (Zheng et al., 2010). However, there are important differences between E-MAP and gene expression data that limit direct application of gene expression imputation techniques to E-MAPs (Ryan et al., 2010). E-MAP matrices report on pairwise relations between genes and have substantially different dimensionality than gene expression data sets. They often contain substantially more missing values than gene expression data sets with the latter having up to 5% missing data rate (Bø et al., 2004; Liew et al., 2011). These differences coupled with the biological significance of E-MAP studies have spurred the development of specialized computational techniques for recovery of missing interaction measurements in E-MAP-like data sets (Ryan et al., 2010).
We here propose NG-MC (network-guided matrix completion), a hybrid and knowledge-assisted method for imputing missing values in E-MAP-like data sets. NG-MC builds upon two concepts: probabilistic matrix completion and propagation of NG-MC-inferred latent gene interaction profiles. Matrix completion uses information on global correlation of elements in the E-MAP score matrix. Propagation of latent profiles exploits the local similarity of genes as specified by the gene networks. The use of prior knowledge in the form of gene networks gives NG-MC the potential to improve imputation accuracy beyond purely data-driven approaches. This could be especially important for data sets with small number of genes and high missing data rate such as E-MAPs. In what follows we present mathematical formulation of the proposed approach and in a comparative study that includes several state-of-the-art imputation techniques demonstrate its accuracy across several E-MAP data sets.
2. Related Work
Imputation algorithms for gene expression data sets are reviewed in Liew et al. (2011), where they are categorized into four classes based on how they utilize or combine local and global information from within the data (local, global, and hybrid algorithms) and their use of prior knowledge in imputation (knowledge-assisted algorithms). Local methods based on k-nearest neighbors that include KNNimpute (Troyanskaya et al., 2001), local least squares (LLS) (Kim et al., 2005), and adaptive least squares (LSimpute) (Bø et al., 2004) rely on local similarity of genes to recover missing values. Global methods decompose data matrices using variations of singular value decomposition (SVDimpute) (Troyanskaya et al., 2001), singular value thresholding algorithm for matrix completion (SVT) (Cai et al., 2010), and Bayesian principal component analysis (BPCA) (Oba et al., 2003). Hybrid imputation approaches for gene expression data make predictions by combining estimates from both local and global imputation methods (Jörnsten et al., 2005).
Only a handful of missing data imputation algorithms directly address E-MAP-like data sets. Ulitsky et al. (2009) experimented with a variety of genomic features, such as the existence of physical interaction or coexpression between genes, that were used as input to a classification algorithm. The NG-MC differs from this approach as it directly uses the matrix of measured GI scores and does not require data-specific feature engineering. Ryan et al. (2010, 2011) considered four general strategies for imputing missing values—three local methods and one global method—and adapted these strategies for E-MAPs. They modified unweighted and weighted k-nearest neighbors imputation methods (uKNN and wNN, respectively) and adapted LLS and BPCA algorithms to handle symmetric E-MAP data. We refer the reader to Ryan et al. (2010) for details on the algorithm modifications. We compare their imputation approaches with the NG-MC (sec. 6). Pan et al. (2011) proposed an ensemble approach to combine the outputs of two global and four local imputation methods based on diversity of estimates of individual algorithms. In this article, we focus on the development of a single algorithm that, if necessary, could be used in an ensemble, and therefore compare it with ensemble-free algorithms.
Another venue of research focuses on predicting qualitative, that is, binary, instead of quantitative interactions. Here, predictions estimate the presence or absence of certain types of interactions rather than their strength (Wong et al., 2004; Kelley and Ideker, 2005; Qi et al., 2008; Pandey et al., 2010). A major distinction between these techniques and the method presented in this article is that we aim to accurately impute quantitative genetic interactions using the scale of GI scores. Individual GI may by itself already provide valuable biological insight as each interaction attests to a functional relationship of a pair of genes. Prediction of synthetic sick and lethal interaction types in S. cerevisiae was pioneered by Wong et al. (2004), who applied probabilistic decision trees to diverse genomic data. Wong et al. introduced 2-hop features to capture the relationship between a pair of genes and a third gene. For example, if protein g physically interacts with protein h, and gene w is synthetic lethal with the encoding gene of h, then this observation increases the likelihood of a synthetic lethal interaction between the encoding gene of g and gene w. Two-hop features were shown to be crucial when predicting GIs (Wong et al., 2004; Bandyopadhyay et al., 2008; Ulitsky et al., 2009) and are the rationale behind our concept of propagating latent profiles over gene networks.
3. Methods
We start by presenting a probabilistic model of matrix completion for missing value imputation in E-MAP-like data sets in which the prediction of missing interaction measurement depends only on the E-MAP score matrix. We then develop an efficient model-fitting approach called network-guided matrix completion (NG-MC), which can additionally consider the prior knowledge in the form of any number of gene networks. NG-MC uses information on topology of gene networks to propagate latent gene interaction profiles among neighboring genes. It exploits the transitivity of interactions; that is, the property of the relationship between a gene pair and a third gene (sec. 2). As such, NG-MC predicts missing values by integrating E-MAP data with available network data. Any type of knowledge that can be expressed in the form of gene networks can be passed to NG-MC. In our experiments we consider gene ontology (Ashburner et al., 2000) semantic similarity network and protein–protein interaction network.
3.1. Problem definition
In the E-MAP study we have a set of n genes,  . Genetic interaction of two genes is scored according to the fitness of the corresponding double mutant and reported with an S-score, which reflects both the magnitude and the sign of observed interaction measurement (Collins et al., 2006). Scored GIs are reported in partially observed matrix
  . In this matrix, the element Gij contains measurement of GI between gi and gj. We assume that G is symmetric, Gij = Gji, and has its values scaled to [0, 1]-interval. Genetic interactions are mapped to [0, 1]-interval by normalizing G before data imputation is performed.
Network-guided matrix completion can simultaneously consider multiple gene networks. Given a weighted adjacency matrix  of a gene network from a collection of networks
  denotes a set of direct neighbors of g in P, where for
  the value Pgh (Pgh ≠ 0) represents the strength of association of gene g with gene h. Prior to the inference of factorized model we normalize each row of P by the sum of the weights of incident edges such that
  for all i. A nonzero entry Pgh denotes the dependence of g-th latent feature vector on h-th latent feature vector. Using this idea, latent features of genes that are indirectly connected in the network P become dependent after a certain number of algorithm iterations, the number of steps being determined by the distance between genes in the network. Hence, information about gene latent representation propagates through network P.
The model inference task is defined as follows: given a pair of genes, gi and gj, for which Gij (and Gji) is unknown, predict quantitative GI between gi and gj using G and  . Let
. Let  and
and  be gene latent feature matrices with column vectors Fi and Hj representing k-dimensional gene-specific latent feature vectors of gi and gj, respectively. Let
  be the networks weighting matrix where Wip represents the influence of gi's neighborhod in
  on the latent feature vector of gi. Network-guided matrix completion infers gene latent feature matrices and network weighting matrix and utilizes them for missing value imputation in E-MAP-like data sets.
3.2. Preliminaries
We begin with a probabilistic view of matrix completion for missing value imputation that does not consider prior biological knowledge. This approach builds upon probabilistic matrix factorization of Mnih and Salakhutdinov (2007) and Salakhutdinov and Mnih (2008), and we refer to it as MC. Genome-scale genetic interaction mapping (Costanzo et al., 2010) has suggested the existence of coherent groups of genes participating in related biological processes. Hence, a desirable computational model of interactions should model interactions not only in terms of pairwise measurements, but also in terms of how these measurements relate to each other. Matrix completion models this intuition by assuming E-MAP score matrix G has low rank and factorizes observed values in G into a product of two low-dimensional latent feature matrices, F and H. In order to learn gene latent feature matrices MC formulates the conditional probability of observed interactions as:
 |
where  is Gaussian distribution with mean μ and variance σ2, and
  is an indicator function that is equal to 1 if the interaction measurement of gi and gj is available and is equal to 0 otherwise. As such, the conditional probability of interaction data regards only observed entries in matrix G. It should be noted that predictions of matrix completion are not biased by a priori setting the missing entries in G to some fixed value selected in an ad hoc manner, which is otherwise common in matrix factorization algorithms (Lee and Seung, 2000; Lee et al., 2012; Wang et al., 2013). Another appealing property of matrix completion is sharing of gene latent feature vectors between all estimates of interaction measurements that involve a certain gene. In particular, latent feature vector Fi is used in estimations of interaction measurements Gij for all j. Similar factor sharing is used in estimations of H. The function g is a logistic function, g(x) = 1/(1 + e−0.5x), which bounds the range of
  within interval (0, 1). Our assumption of Gaussian distribution in Equation (1) is justified by the scoring scheme of genetic interactions in E-MAP technology that uses a modified t-value score, called S-score (Collins et al., 2006). We further assume a zero-mean Gaussian prior for gene latent feature vectors in F given by
  and similarly, endow H with Gaussian prior distribution,
  , parameterized by
  and
and  , respectively.
Through Bayesian inference we obtain the log-posterior probability of latent feature matrices given the interaction measurements,  . We then select the factorized model consisting of F and H by finding maximum a posteriori estimate with gradient descent technique while keeping the observation noise variance
  and prior variance
  and
and  fixed.
3.3. Network-guided matrix completion
Network-guided matrix completion (NG-MC) extends matrix completion model (MC) from the previous section by borrowing latent feature information from neighboring genes in networks  . An illustration of NG-MC algorithm with prior knowledge of one gene network is shown in Figure 1. The biological motivation for the propagation of interactions stems from the transitive relationship between a gene pair and a third gene (see sec. 2) and indicates that the behavior of a gene is affected by its direct and indirect neighbors in the underlying gene networks
  . In other words, the latent feature vector of gene g, Fg, is in each iteration of NG-MC algorithm dependent on the latent feature vectors of its direct neighbors,
  in networks
  . The influence is formulated as
  , where
  is the estimated latent feature vector of g given feature vectors of its direct neighbors, and Wgp is the weight of g in network P as inferred by NG-MC. Thus, latent feature vectors in F of genes that are indirectly connected in networks
  are dependent and hence information about their latent representation propagates according to the connectivity of gene networks as the NG-MC algorithm progresses.
FIG. 1.
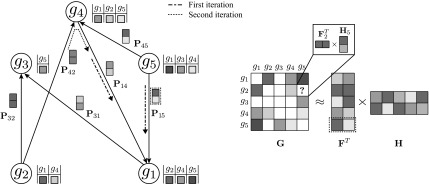
A toy application of the network-guided matrix completion (NG-MC) algorithm. A hypothetical E-MAP data set with five genes is given,  . Prior knowledge is presented through one gene network P (
 ). Gene interaction profiles are listed next to corresponding nodes in gene network P (left) and are shown in the sparse and symmetric matrix G (right). Different shades of gray quantify interaction strength while white elements in G denote missing values. Matrices F and H are gene latent feature matrices. Gene latent feature vector Fgi depends on each iteration of the NG-MC on the latent feature vectors of gi's direct neighbors in P. For instance, the latent vector of gene g1 in F depends on the first iteration of the NG-MC algorithm on latent vectors of its neighbors g4 and g5 (Fg4 and Fg5 are shown on input edges of g1) whose degrees of influence are determined by P14 and P15, respectively. In the second iteration, the update of Fg1 depends also on the latent vector of g1's 2-hop neighbor, g2, hence the influence of gene latent feature vectors propagates through P. Gene latent feature matrix H is not influenced by gene neighborhoods in P.
Suppose that for a given i and j, the observation in Gij comes from distribution  . Considering that interaction measurements are generated independently, we model partially observed matrix G as
  . We achieve the coupling of interaction measurements by sharing latent gene profiles among all measurements of a certain gene. Note that incorporating prior knowledge in the form of gene networks
  does not change our probabilistic model of observed interaction measurements from Equation (1). Instead, it only affects the formulation of gene latent feature vectors in F. We describe them with two factors: a zero-mean Gaussian prior to avoid overfitting and a conditional distribution of gene latent feature vectors given the latent feature vectors of their direct neighbors:
 |
Such formulation of gene latent matrix keeps gene feature vectors in F both small and close to the latent feature vectors of their direct neighbors. Because NG-MC borrows its strength across all available observations and gene neighborhoods in estimating each Gij, it can lead to more accurate inference than simply learning Gij independently of any additional domain knowledge. In a Bayesian estimation setting of our NG-MC model, one is interested in the behavior of the posterior distribution of gene latent feature matrices F and H given the observed genetic interaction scores G and gene networks  :
:
 |
We then compute the log-posterior probability to obtain:
 |
Our goal is to learn F, H, and W, which maximize the conditional posterior probability over gene latent feature vectors. To do so, we formulate a minimization problem that is equivalent to maximization of the log-posterior probability in Equation (4) and employ gradient descent technique on F, H, and W to solve it. In particular, we minimize the objective function:
 |
where  ,
,  , and
, and  . We normalize interaction measurements in G before performing numerical optimization such that the elements of G are in [0,1] interval. Normalization is due to estimates in
  being bounded by the logistic function g. We keep the observation noise variance
  and prior variances
  ,
,  , and
, and  fixed and use gradient descent algorithm to find the local minimum of
  and estimate gene latent feature matrices. The parameters λF and λH serve as to regularize latent gene profiles and the presence of
  trades off the sole reliance on observed measurements against the inclusion of domain knowledge.
NG-MC algorithm (Alg. 1) iteratively updates gene latent feature vectors Fi and Hj for each i and j based on the latent feature vectors from the previous iteration and gene neighbors in network  . In each iteration, NG-MC also refines weights of genes in considered gene networks given in W in order to account for the contribution of genes to current latent feature vectors of their neighbors. Successive updates of Fi and Hj converge to a maximum a posteriori estimate of the posterior probability formulated in Equation (3). In practice, the algorithm stops iterating once the reconstruction error over observed interaction measurements does not decrease after the update of F, H, and W.
Input: Sparse matrix  containing interaction measurements, gene networks containing interaction measurements, gene networks  , parameters λF = λH, , parameters λF = λH,  , rank k, and learning rates α and , rank k, and learning rates α and  . . | |
Output: Data matrix  , latent matrices F and H and gene networks weights W. , latent matrices F and H and gene networks weights W. | |
1. Normalize each row of  such that such that  . . | |
2. Sample  and and  and set and set  . . | |
| 3. Repeat until convergence: | |
a. For  : : | |
| |
b. For  and and  : : | |
| |
c. Set  for for  . . | |
d. Set  for for  . . | |
e. Set  for for  and and  . . | |
4. Compute  . Predict interaction of gi and gj as . Predict interaction of gi and gj as  . . |

Algorithm 1. Network-guided matrix completion (NG-MC) algorithm. We observed that parameter values λH = λF = 0.01 and learning rates α = 0.1 and  gave accurate results across a number of different data sets. Parameter
  , which controls the influence of gene networks
  on gene latent feature vectors in F, depended on data set complexity (Brock et al., 2008). We omitted step 3.e in experiments that included only one gene network (
 ).
).
4. Experimental Setup
In the experiments, we consider an existing incomplete E-MAP matrix from each of the E-MAP studies and artificially introduce an additional 1% of missing values for a set of arbitrarily selected gene pairs (Ryan et al., 2010; Pan et al., 2011). These gene pairs and their data constitute a test set on which we evaluate the performance of imputation algorithms. Because of E-MAP symmetry, for a given test gene pair and its corresponding entry Gij, we also hide the value of Gji. We repeat this process 30 times and report on the averaged imputation performance.
It may be noted that established performance evaluation procedure of missing value imputation methods for gene expression data is not directly applicable to E-MAPs for several reasons discussed in Ryan et al. (2010). That procedure first constructs a complete data matrix by removing genes with missing values and then artificially introduces missing values for evaluation. Gene expression data contain a substantially lower fraction of missing data than E-MAPs (Table 1), and removing a small number of genes and experimental conditions does not significantly reduce the size of gene expression data sets, whereas this does not hold for E-MAP data sets.
We select the latent dimensionality k and regularization parameters λF and  of the NG-MC with the following procedure. For each data set and before the performance evaluation, we leave out 1% of randomly selected known values and attempt to impute them with varying values of parameters in grid search fashion. Parameter values that result in the best estimation of the left-out values are then used in all experiments involving the data set. Notice that the left-out values are determined before performance evaluation and are therefore not included in the test data set. We set the parameters of competitive methods to values recommended by Ryan et al. (2010) (for wNN, LLS, and BPCA) or optimize parameter selection through grid search (for SVT, MC, and NG-MC).
We consider two measures of imputation accuracy. These are the Pearson correlation (CC) between the imputed and the true values, and the normalized root mean square error (NRMSE) (Oba et al., 2003) given as  , where y and
  denote vectors of true and imputed values, respectively. More accurate imputations give a higher correlation score and a lower NRMSE.
To test if the differences in performance of imputation methods are significant, we use the Wilcoxon signed-rank test, a nonparametric equivalent of a paired t-test. Its advantage is that it does not require Gaussian distribution or homogeneity of variance, but it has less statistical power, so there is a risk that some differences are not recognized as significant.
5. Data
We consider four E-MAP data sets in a comparative evaluation of NG-MC with five state-of-the-art methods for missing value imputation. The evaluated data sets are from budding yeast S. cerevisiae; they include S-scores of interaction measurements, but differ in the subset of studied genes and the proportion of missing values (Table 1):
• Chromosome biology (Collins et al., 2007) is the largest data set considered, encompassing interactions between 743 genes involved in various aspects of chromosome biology, such as chromatid segregation, DNA replication, and transcriptional regulation.
• RNA processing (denoted by RNA) (Wilmes et al., 2008) focused on the relationships between and within RNA processing pathways involving 552 mutants, 166 of which were hypomorphic alleles of essential genes.
• The early secretory pathway (denoted by ESP) (Schuldiner et al., 2005) generated genetic interaction maps of genes acting in the yeast early secretory pathway to identify pathway organization and components of physical complexes.
• Lipid E-MAP (Surma et al., 2013) focused on lipid metabolism, sorting, trafficking, and various aspects of lipid biology, and its data were indicative of a dedicated bilayer stress response for membrane homeostasis.
We have considered two data sources for gene network construction. The first network is constructed based on gene ontology (GO) (Ashburner et al., 2000) annotation data. It is a weighted network of genes included in the E-MAP study whose edge weights correspond to the number of shared GO terms between connected genes, excluding annotations inferred from GI studies (i.e., those with the igi evidence code). The second network represents physical interaction data from BioGRID 3.2 (Stark et al., 2006). The physical interaction network is a binary network in which two genes are connected if their gene products physically interact. Depending on the considered network, we denote their corresponding NG-MC models by NG-MC-GO and NG-MC-PPI, respectively.
6. Results and Discussion
6.1. Imputation performance
Table 2 shows the CC and NRMSE scores of imputation algorithms along with the baseline method of filling-in with zeros. NG-MC-PPI and NG-MC-GO achieved highest accuracies on all considered data sets. We compared their scores with the performance of the second-best method (i.e., LLS on chromosome biology data set, SVT on ESP data set, and MC on RNA data set) and found that improvements were significant in all data sets.
Table 2.
Accuracy as Measured by the Pearson Correlation Coefficient and Normalized Root Mean Squared Error Across Three E-MAP Data sets and Eight Imputation Methods
| Chromosome biology | ESP | RNA | ||||
|---|---|---|---|---|---|---|
| Approach | CC | NRMSE | CC | NRMSE | CC | NRMSE |
| Filling with zeros | 0.000 | 1.021 | 0.000 | 1.011 | 0.000 | 1.000 |
| BPCA (k = 300) | 0.539 | 0.834 | 0.619 | 0.796 | 0.589 | 0.804 |
| wNN (k = 50) | 0.657 | 0.744 | 0.625 | 0.776 | 0.626 | 0.787 |
| LLS (k = 20) | 0.678 | 0.736 | 0.626 | 0.764 | 0.626 | 0.776 |
| SVT (k = 40) | 0.631 | 0.753 | 0.672 | 0.719 | 0.649 | 0.765 |
| MC (k = 40) | 0.641 | 0.742 | 0.653 | 0.722 | 0.651 | 0.760 |
| NG-MC-GO (k = 60) | 0.691 | 0.693 | 0.732 | 0.648 | 0.727 | 0.641 |
| NG-MC-PPI (k = 60) | 0.722 | 0.668 | 0.742 | 0.667 | 0.701 | 0.652 |
MC denotes matrix completion model (sec. 3.2). The NG-MC-GO and NG-MC-PPI are network-guided matrix completion models (sec. 3.3) that utilize gene ontology annotation and physical interaction data, respectively. For descriptions of other methods see sec. 2. Highlighted results are significantly better than the best non-NG-MC method according to the Wilcoxon signed-rank test at 0.05 significance level.
ESP, early secretory pathway; CC, Pearson correlation coefficient; NRMSE, normalized root mean squared error; BPCA, Bayesian principal component analysis; wNN, weighted k-nearest neighbors; LLS, local least squares; SVT, singular value thresholding algorithm.
We did not observe any apparent connection between the proportion of missing values in a data set and the performance of any of the imputation methods. The performance was better on smaller ESP and RNA data sets, although differences were small and further investigation appears to be worthwhile.
The baseline method of filling-in with zeros had the worst performance on all data sets. While this approach seems naïve, it is justified by the expectation that most genes do not interact. We observed that BPCA failed to match the performance of weighted neighbor-based and local least squares methods, wNN and LLS, respectively, on all three evaluated E-MAP data sets. Local imputation methods, wNN and LLS, demonstrated good performance across all three data sets. Solid performance of neighbor-based methods on larger data sets could be explained by a larger number of neighbors to choose from when imputing missing values, which resulted in more reliable missing value estimates.
Global methods, BPCA, SVT, and MC, performed well on the ESP data set but poorly on a much larger chromosome biology data set. These methods assume the existence of a global covariance structure between all genes in the E-MAP score matrix. When this assumption is not appropriate, that is, when genes predominantly exhibit local similarity substructure, the imputation becomes less accurate. The comparable performance of SVT and MC across data sets was expected. Both methods solve related optimization problems and operate under the assumption that the E-MAP score matrix has low rank.
The superior performance of NG-MC models over other imputation methods can be explained by their ability to introduce circumstantial evidence into model inference. As a hybrid imputation approach, NG-MC can benefit from both global information present in the E-MAP data and local similarity structure between genes. One could vary the level of influence of global and local patterns on the imputation through  parameter of the NG-MC model, where a higher value of
  indicates more emphasis on locality. In this way, our approach can adequately address data of varying underlying complexity (Brock et al., 2008), where data complexity indicates the difficulty of mapping the E-MAP score matrix to a low-dimensional space. To quantify the complexity of gene expression matrices, Brock et al. (2008) devised an entropy-based imputation algorithm selection scheme that was based on observation that global imputation methods performed better on gene expression data with lower data complexity and local methods performed better on data with higher complexity. Their selection scheme could be adapted to work with E-MAP-like data sets and be used to set
  in an informed way.
We studied the sensitivity of NG-MC to variations in algorithm parameters. In particular, we investigated how NG-MC imputation performance was affected as a function of parameters values. The parameters of NG-MC algorithm are the latent dimensionality of the factorized model (k), the degree of regularization of latent matrices (λF), and the impact of network neighborhood ( ). In additional experiments performed on ESP data set (Fig. 2) and with NG-MC-GO model we found that performance of our NG-MC approach is robust for a broad range of parameter values.
FIG. 2.
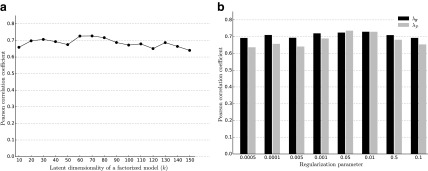
Impact of different values for latent dimensionality (a) and regularization parameters (b) on the imputation performance of network-guided matrix completion. Experiments that varied latent dimensionality set the regularization parameters to λF = 0.01 and  . When investigating the influence of regularization the latent dimensionality was set to k = 60 and the remaining regularization parameter to 0.01. Results of sensitivity to parameter selection is reported for the early secretory pathway data set and network derived from gene ontology annotations. Similar behavior was observed with other E-MAP data sets.
6.2. Missing value abundance and distribution
Ulitsky et al. (2009) described three different scenarios of missing values in E-MAP experiments (Fig. 3). The simplest and the most studied scenario is the random model for which we assume that missing measurements are generated independently and uniformly by a random process. The submatrix model corresponds to the case where all interactions within a subset of genes (e.g., essential genes) are missing. The cross model arises when interactions between two disjoint subsets of genes are missing. This model concurs with the situation when two E-MAP data sets that share a subset of genes are combined into a single large data set. We identified the fourth missing value configuration, which we call the prediction scenario (Fig. 4d). It occurs when complete GI profiles are missing. Learning in such a setting is substantially harder than learning with other missing value arrangements as genes with missing values in the prediction scenario do not have any associated interaction measurements. In the previous section, we compared the imputation methods using the random configuration, and we study other configurations in this section. Here we are interested in the effect that various missing data configurations have on NG-MC, and we compared the NG-MC algorithm to its variant, which does not use domain knowledge (MC).
FIG. 3.
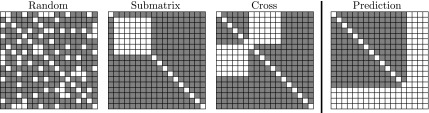
The four configurations producing missing values in E-MAP data. Random configuration has hidden a subset of genetic interactions selected uniformly at random. Submatrix and cross configurations have hidden all interactions within a random subset of genes or between two random disjoint subsets of genes, respectively. In the prediction scenario, complete genetic interaction profiles of a gene subset are removed.
FIG. 4.
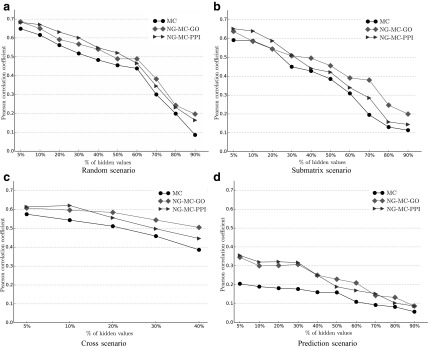
Performance of imputation methods (Pearson correlation coefficient) proposed in this article for different missing data rates and missing value configurations. Refer to the main text and Figure 3 for description of the missing value scenarios. MC denotes matrix completion approach (sec. 3.2). Network-guided matrix completion (sec. 3.3) is represented by NG-MC-GO and NG-MC-PPI. Performance was assessed for the early secretory pathway E-MAP data set, because it contains the least missing values. The cross configuration is not applicable when more than 50% of the values are missing.
Figure 4 reports on the predictive performance of our matrix completion approach obtained by varying the fraction of missing values in the four missing data scenarios presented in Figure 3. For  we hid x% of E-MAP measurements in the ESP data and inferred prediction model. Our results are reasonably accurate (CC > 0.4) when up to 60% of the E-MAP values were hidden in the Random and Submatrix models. It should be noted that when we hide 60% of the ESP E-MAP measurements, the E-MAP scores are present in less than 40% of the matrix because the original ESP data set already contains ∼8% missing values (Table 1). When more than 80% of the data were removed, the three considered prediction models still achieved higher accuracy (CC ≈ 0.2) than filling-in with zeros. As expected, predictions were more accurate for the random model than for the submatrix model for almost all fractions of hidden data (cf., Fig. 4a and b). However, the difference in performance between the random and submatrix models tended to be small when less than 30% or more than 70% of the measurements were hidden. From this experiment we conclude that inclusion of additional genomic data is more useful in structured missing value scenarios, that is, the submatrix and the cross model (Fig. 4b and c), demonstrating that individual gene networks provide complementary information.
Imputation accuracy has improved (Fig. 4) when E-MAP data were combined with gene annotation (NG-MC-GO) or protein–protein interaction (NG-MC-PPI) networks. These results support findings from experimental studies (Tong et al., 2004; Collins et al., 2007; Costanzo et al., 2010) that showed that if two proteins act together to carry out a common function, deletions of their corresponding encoding genes may have similar GI profiles. Furthermore, gene ontology annotations and synthetic lethality are correlated with ∼12% and ∼27% of genes that genetically interact, having either identical or highly similar gene ontology annotations, respectively (Tong et al., 2004; Michaut and Bader, 2012). Our NG-MC-GO and NG-MC-PPI models could exploit these strong links between functionally similar genes, physically interacting proteins, and GIs. Performance of integrated models in Figure 4 suggests the importance of combining interaction and functional networks for prediction of missing values in E-MAP data sets.
We observed deterioration of imputation accuracy when complete genetic interaction profiles were removed and NG-MC could only utilize circumstantial evidence (Fig. 4d). Decreased prediction performance suggests that measured gene interactions are the best source of information for predicting missing values in the E-MAP data. However, when the proportion of missing interactions was increased, the inclusion of additional genomic data was more helpful. With the exception of the prediction model for which the opposite behavior was observed, the performance difference between MC and NG-MC was small (∼10%) as long as <50% of the data were removed, but rose to above 20% when ≥60% of the data were removed (Fig. 4).
6.3. Data imputation by integration of gene networks
We studied imputation performance of our proposed approach on the recent lipid E-MAP data set by Surma et al. (2013). Figure 5 shows the Pearson correlation between the imputed and true interaction measurements when different types of circumstantial evidence were considered and various amounts and distributions of genetic interactions were excluded from the training set. Similarly as in experiments with the ESP data set (Fig. 4), prediction models inferred from the lipid E-MAP data that included prior knowledge performed better than models, which considered only interaction measurements. Figure 5 also reveals that best performance was attained when our NG-MC approach collectively considered both protein–protein interaction network and network derived from gene functional annotation data (NG-MC-GO-PPI). The NG-MC can simultaneously consult multiple gene networks during model inference and modify gene weights in each of the networks to achieve better prediction accuracy. As such, it does not require substantial network preprocessing prior model inference and is able to adjust for network influence by taking into account entire collections of considered networks. Figure 5 also conveys that the inclusion of additional knowledge into prediction models is more pronounced in scenarios with high missing data rates and nontrivial structure of missing measurements. Good performance of our approach in such scenarios is an appealing property and hence, NG-MC seems to be an attractive data imputation approach.
FIG. 5.
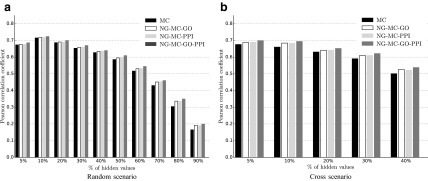
Imputation performance of network-guided matrix completion (NG-MC) for different fractions and distributions of missing values in the lipid E-MAP data set and for various sources of biological network information. Prior knowledge is included in the form of protein–protein interaction network (PPI), a network derived from gene ontology annotation data (GO) and collective consideration of both PPI and GO. Refer to Figure 3 for description of random and cross missing value configurations.
7. Conclusion
We have proposed a new missing value imputation method called network-guided matrix completion (NG-MC) that targets gene interaction data sets. The approach is unique in combining gene interaction and network data through inference of a single probabilistic model. Experiments with epistatic MAP interaction data sets show that inclusion of prior knowledge is crucial and helps NG-MC to perform better than a number of state-of-the-art algorithms we have included in our study. The results are encouraging and have potentially high practical value for prediction of genetic interactions that are otherwise unavailable to existing interaction measurements.
Acknowledgments
This work was supported by the Slovenian Research Agency (P2-0209, J2-5480), the National Institutes of Health (P01-HD39691), the European Commission (Health-F5-2010-242038), and the Fulbright scholarship.
Author Disclosure Statement
No competing financial interests exist.
References
- Ashburner M., Ball C.A., Blake J.A., et al. 2000. Gene Ontology: tool for the unification of biology. Nat. Genet. 25, 25–29 [DOI] [PMC free article] [PubMed] [Google Scholar]
- Bandyopadhyay S., Kelley R., Krogan N.J., et al. 2008. Functional maps of protein complexes from quantitative genetic interaction data. PLoS Comput. Biol. 4, e1000065. [DOI] [PMC free article] [PubMed] [Google Scholar]
- Bø T.H., Dysvik B., and Jonassen I. 2004. LSimpute: accurate estimation of missing values in microarray data with least squares methods. Nucleic Acids Res. 32, e34. [DOI] [PMC free article] [PubMed] [Google Scholar]
- Brock G.N., Shaffer J.R., Blakesley R.E., et al. 2008. Which missing value imputation method to use in expression profiles: a comparative study and two selection schemes. BMC Bioinformatics 9, 12. [DOI] [PMC free article] [PubMed] [Google Scholar]
- Cai J.-F., Candès E.J., and Shen Z. 2010. A singular value thresholding algorithm for matrix completion. SIAM J. Optimiz. 20, 1956–1982 [Google Scholar]
- Collins S.R., Miller K.M., Maas N.L., et al. 2007. Functional dissection of protein complexes involved in yeast chromosome biology using a genetic interaction map. Nature 446, 806–810 [DOI] [PubMed] [Google Scholar]
- Collins S.R., Schuldiner M., Krogan N.J., et al. 2006. A strategy for extracting and analyzing large-scale quantitative epistatic interaction data. Genome Biol. 7, R63. [DOI] [PMC free article] [PubMed] [Google Scholar]
- Costanzo M., Baryshnikova A., Bellay J., et al. 2010. The genetic landscape of a cell. Science 327, 425–431 [DOI] [PMC free article] [PubMed] [Google Scholar]
- de Brevern A.G., Hazout S., and Malpertuy A. 2004. Influence of microarrays experiments missing values on the stability of gene groups by hierarchical clustering. BMC Bioinformatics 5, 114. [DOI] [PMC free article] [PubMed] [Google Scholar]
- Järvinen A.P., Hiissa J., Elo L.L., et al. 2008. Predicting quantitative genetic interactions by means of sequential matrix approximation. PLoS One 3, e3284. [DOI] [PMC free article] [PubMed] [Google Scholar]
- Jörnsten R., Wang H.Y., Welsh W.J., et al. 2005. DNA microarray data imputation and significance analysis of differential expression. Bioinformatics 21, 4155–4161 [DOI] [PubMed] [Google Scholar]
- Kelley R., and Ideker T. 2005. Systematic interpretation of genetic interactions using protein networks. Nat. Biotechnol. 23, 561–566 [DOI] [PMC free article] [PubMed] [Google Scholar]
- Kim H., Golub G.H., and Park H. 2005. Missing value estimation for DNA microarray gene expression data: local least squares imputation. Bioinformatics 21, 187–198 [DOI] [PubMed] [Google Scholar]
- Lee C.M., Mudaliar M.A., Haggart D., et al. 2012. Simultaneous non-negative matrix factorization for multiple large scale gene expression datasets in toxicology. PLoS One 7, e48238. [DOI] [PMC free article] [PubMed] [Google Scholar]
- Lee D.D., and Seung H.S. 2000. Algorithms for non-negative matrix factorization. In Adv. Neur. Inf. Proc. Sys., 556–562 [Google Scholar]
- Liew A.W.-C., Law N.F., and Yan H. 2011. Missing value imputation for gene expression data: computational techniques to recover missing data from available information. Brief. Bioinform. 12, 498–513 [DOI] [PubMed] [Google Scholar]
- Michaut M., and Bader G.D. 2012. Multiple genetic interaction experiments provide complementary information useful for gene function prediction. PLoS Comput. Biol. 8, e1002559. [DOI] [PMC free article] [PubMed] [Google Scholar]
- Mnih A., and Salakhutdinov R. 2007. Probabilistic matrix factorization. In Adv. Neur. Inf. Proc. Sys., 1257–1264 [Google Scholar]
- Nanni L., Lumini A., and Brahnam S. 2012. A classifier ensemble approach for the missing feature problem. Artif. Intell. Med. 55, 37–50 [DOI] [PubMed] [Google Scholar]
- Oba S., Sato M.A., Takemasa I., et al. 2003. A Bayesian missing value estimation method for gene expression profile data. Bioinformatics 19, 2088–2096 [DOI] [PubMed] [Google Scholar]
- Pan X.-Y., Tian Y., Huang Y., and Shen H.-B. 2011. Towards better accuracy for missing value estimation of epistatic miniarray profiling data by a novel ensemble approach. Genomics 97, 257–264 [DOI] [PubMed] [Google Scholar]
- Pandey G., Zhang B., Chang A.N., et al. 2010. An integrative multi-network and multi-classifier approach to predict genetic interactions. PLoS Comput. Biol. 6, e1000928. [DOI] [PMC free article] [PubMed] [Google Scholar]
- Pu S., Ronen K., Vlasblom J., et al. 2008. Local coherence in genetic interaction patterns reveals prevalent functional versatility. Bioinformatics 24, 2376–2383 [DOI] [PubMed] [Google Scholar]
- Qi Y., Suhail Y., Lin Y.Y., et al. 2008. Finding friends and enemies in an enemies-only network: a graph diffusion kernel for predicting novel genetic interactions and co-complex membership from yeast genetic interactions. Genome Res. 18, 1991–2004 [DOI] [PMC free article] [PubMed] [Google Scholar]
- Roguev A., Bandyopadhyay S., Zofall M., et al. 2008. Conservation and rewiring of functional modules revealed by an epistasis map in fission yeast. Science 322, 405–410 [DOI] [PMC free article] [PubMed] [Google Scholar]
- Ryan C., Cagney G., Krogan N.J., et al. 2011. Imputing and predicting quantitative genetic interactions in epistatic MAPs. Methods in Molecular Biology 781, 353–361 [DOI] [PMC free article] [PubMed] [Google Scholar]
- Ryan C., Greene D., Cagney G., et al. 2010. Missing value imputation for epistatic MAPs. BMC Bioinformatics 11, 197. [DOI] [PMC free article] [PubMed] [Google Scholar]
- Salakhutdinov R., and Mnih A. 2008. Bayesian probabilistic matrix factorization using Markov chain Monte Carlo. In Int. Conf. Mach. Learn., 880–887 [Google Scholar]
- Schuldiner M., Collins S.R., Thompson N.J., et al. 2005. Exploration of the function and organization of the yeast early secretory pathway through an epistatic miniarray profile. Cell 123, 507–519 [DOI] [PubMed] [Google Scholar]
- Stark C., Breitkreutz B. J., Reguly T., et al. 2006. BioGRID: a general repository for interaction datasets. Nucleic Acids Res. 34, D535–D539 [DOI] [PMC free article] [PubMed] [Google Scholar]
- Surma M.A., Klose C., Peng D., et al. 2013. A lipid E-MAP identifies Ubx2 as a critical regulator of lipid saturation and lipid bilayer stress. Mol. Cell 51, 519–530 [DOI] [PMC free article] [PubMed] [Google Scholar]
- Tong A.H.Y., Evangelista M., Parsons A.B., et al. 2001. Systematic genetic analysis with ordered arrays of yeast deletion mutants. Science 294, 2364–2368 [DOI] [PubMed] [Google Scholar]
- Tong A.H.Y., Lesage G., Bader G.D., et al. 2004. Global mapping of the yeast genetic interaction network. Science 303, 808–813 [DOI] [PubMed] [Google Scholar]
- Troyanskaya O., Cantor M., Sherlock G., et al. 2001. Missing value estimation methods for DNA microarrays. Bioinformatics 17, 520–525 [DOI] [PubMed] [Google Scholar]
- Ulitsky I., Krogan N.J., and Shamir R. 2009. Towards accurate imputation of quantitative genetic interactions. Genome Biol. 10, R140. [DOI] [PMC free article] [PubMed] [Google Scholar]
- Ulitsky I., Shlomi T., Kupiec M., et al. 2008. From E-MAPs to module maps: dissecting quantitative genetic interactions using physical interactions. Mol. Syst. Biol. 4, 209. [DOI] [PMC free article] [PubMed] [Google Scholar]
- Wang H., Huang H., Ding C., et al. 2013. Predicting protein–protein interactions from multimodal biological data sources via nonnegative matrix tri-factorization. J. Comp. Biol. 20, 344–358 [DOI] [PubMed] [Google Scholar]
- Wilmes G.M., Bergkessel M., Bandyopadhyay S., et al. 2008. A genetic interaction map of RNA-processing factors reveals links between Sem1/Dss1-containing complexes and mRNA export and splicing. Mol. Cell 32, 735–746 [DOI] [PMC free article] [PubMed] [Google Scholar]
- Wong S.L., Zhang L.V., Tong A.H., et al. 2004. Combining biological networks to predict genetic interactions. Proc. Natl. Acad. Sci. U.S.A. 101, 15682–15687 [DOI] [PMC free article] [PubMed] [Google Scholar]
- Zheng J., Benschop J.J., Shales M., et al. 2010. Epistatic relationships reveal the functional organization of yeast transcription factors. Mol. Syst. Biol. 6, 420. [DOI] [PMC free article] [PubMed] [Google Scholar]