

Abstract
Integrated sequencing analysis identified a group of tumors among clear cell renal cell carcinomas characterized by hotspot mutations in TCEB1 (a gene that contributes to the VHL complex to ubiquitinate hypoxia inducible factor). We analyzed 11 tumors from two distinct cohorts with TCEB1 mutations along with an expanded cohort to assess whether these should be considered an entity distinct from clear cell renal cell carcinoma and clear cell papillary renal cell carcinoma. All tumors were characterized by hotspot mutations in TCEB1 Y79C/S/F/N or A100P. Morphologic and immunohistochemical characteristics of the tumors were assessed by two experienced genitourinary pathologists. Clinical and pathologic variables, copy number alterations, mutations and expression signatures were compared to a cohort of TCEB1 wild type tumors. All TCEB1 mutated tumors were VHL and PBRM1 wild type and contained distinct copy number profiles including loss of heterozygosity of chromosome 8, the location of TCEB1 (8q21.11). All tumors lacked the clear cell renal cell carcinoma signature 3p loss and contained distinct gene expression signatures. None of the clear cell papillary tumor harbored TCEB1 mutations. Pathologically, TCEB1-mutated tumors all shared characteristic features including thick fibromuscular bands transecting the tumor, pure clear cell cytology frequently with cells showing voluminous cytoplasm, clear cell renal cell carcinoma-like acinar areas associated with in-folding tubular and focally papillary architecture. The presence of voluminous cytoplasm, absence of luminal polarization of tumor nuclei and lack of extensive cup-like distribution of carbonic anhydrase IX expression distinguish it from clear cell papillary carcinoma. No patients had developed metastases at last follow-up (median 48 months). In sum, TCEB1-mutated renal cell carcinoma is a distinct entity with recurrent hotspot mutations, specific copy number alterations, pathway activation and characteristic morphologic features. Further clinical followup is needed to determine whether these tumors are more indolent compared to conventional clear cell renal cell carcinoma.
Keywords: Genomics, Renal Cell Carcinoma, TCEB1, VHL
Introduction
Renal cell carcinoma is a broad term encompassing multiple different malignant subtypes arising from the kidney with various histopathologic appearances, molecular alterations and clinical outcomes. For the past several decades, tumor subtyping primarily relied on morphologic and immunohistochemical characterization, recognizing tumors including the most common and aggressive, clear cell renal cell carcinoma, as well as papillary and chromophobe subtypes.(1) Nevertheless morphologic overlap is common and unique classes of tumors are now being recognized from within these classic subtypes. Clear cell-papillary renal cell carcinoma exemplifies a now well-recognized entity with unique growth pattern characteristics and immunohistochemical features that has been distinguished from the clear cell renal cell carcinoma group.(2) At the same time, while clear cell renal cell carcinoma and clear cell papillary renal cell carcinoma tumors are morphologically distinct tumors, they share common activation of hypoxia-inducible factor (HIF) pathway.
Several large-scale molecular and genomic studies including ongoing work by the Cancer Genome Atlas (TCGA) have further refined these morphologic subtypes. Exome and copy number analysis has shown loss of 3p and VHL mutations to be fundamental events in carcinogenesis of clear cell renal cell carcinoma.(3, 4) More recent work has identified PBRM1 as the next most commonly mutated gene (~30-60%).(3, 5, 6) Additional loss of multiple 3p tumor suppressors is common in clear cell renal cell carcinoma and often correlates with disease aggressiveness.(7, 8)
Sato and colleagues recently identified a group of tumors within clear cell renal cell carcinoma that lacked the characteristic 3p loss and VHL mutations.(4) These tumors were defined by loss of heterozygosity on chromosome 8q along with characteristic transcription elongation factor B (TCEB1) hotspot mutations, affecting the binding site of VHL and thus the ability to ubiquitinate the hypoxia inducible factor (HIF) complex. These tumors may suggest a novel mechanism for the origin of a group of clear cell renal cell carcinoma that does not involve the loss of VHL. We hypothesize that they may represent a distinct tumor entity and utilized the rich genomic, pathologic and clinical data from two distinct data sets, Sato et al. and TCGA, to further investigate.
Material and Methods
Genomic Data
Publically available genomic data for the Sato et al and TCGA data sets were acquired. The Sato et al cohort consisted of 8, mostly low-grade tumors with TCEB1 mutation. Five out of the eight tumors had whole-exome sequencing data and mRNA gene expression array data, and the remaining three tumors had targeted deep DNA sequencing data available. All 8 tumors contained SNP array copy number data. An additional 67 low-grade (Fuhrman nuclear grade 1 and 2) tumors had SNP array copy number and mRNA expression data available (ArrayExpress accession number “EMTAB-1980”). We chose low-grade tumors as a comparison group given that TCEB1-mutated tumors are mostly low-grade and appear to have an indolent clinical behavior, and thus attempted to avoid spurious findings related to more aggressive tumors.
In the TCGA cohort, three TCEB1-mutated tumors were identified, all of which had whole-exome sequencing, copy number and mRNA expression data (RNA-seq) available. To draw statistical genomic comparisons to clear cell renal cell carcinomatumors, similar to that done in Sato et al cohort, we also compared TCEB1-mutated tumors to low-grade tumors within the TCGA cohort with complete genomic data available (n=193; n=180 including mRNA expression data). All TCGA datasets were obtained from the Broad FireHose (http://gdac.broadinstitute.org/, January 16 2013 data run).
Comparative analysis of tumor genomic profiles
To compare TCEB1 mutant and wild-type tumor genomic profiles, we combined TCEB1 mutant tumor samples from Sato et al and TCGA (n=11) and compared these to low grade TCGA tumors with complete genomic data (n=193). We computed genome-wide estimates of DNA copy number gain or loss frequencies in the two tumor sets using the Integrated Genomics Viewer (gain: log2(CN/2) > 0.1; loss: log2(CN/2) <-0.1). Somatic mutation frequencies in the two tumor sets were computed for all recurrently mutated genes identified in a separate published analysis of the TCGA cohort (n=15)(9).
Gene expression analysis
Gene expression profiles of TCEB1 mutant tumors from the Sato et al (Agilent 4x44k microarrays) and TCGA (RNA-seq) cohorts, was performed by computing gene expression changes between TCEB1-mutated (Sato: n=5, TCGA: n=3) and wild-type (Sato: n=67, TCGA: n=180) tumors separately for each of the two distinct cohorts. The correspondence in gene expression changes between the two cohorts was evaluated using the Pearson's correlation coefficient (two-tailed t-test) and Spearman rank correlation coefficient (two tailed t-test). In order to combine gene expression profiles from the cohorts, log-expression levels were normalized using z-scores. For individual genes, we tested changes in expression between TCEB1-mutated and wild-type tumors using the non-parametric Wilcoxon rank-sum test (two-tailed p-values).
Gene set and pathway enrichment analysis
We used Gene Set Enrichment Analysis (GSEA) (10) to statistically evaluate the extent that particular gene sets or pathways were dysregulated in TCEB1-mutated tumors. We analyzed gene expression profiles of n=5 mutated vs 67 low-grade clear cell renal cell carcinoma tumors from the Sato et al cohort. Genes were sorted by mRNA expression change in TCEB1 mutant versus wild-type tumors, and GSEA was used to evaluate the null hypothesis that genes in particular gene sets or pathways were not differentially expressed in mutant versus wild-type samples. P-values were estimated by sample phenotype permutations (n=100), and we tested 1196 curated gene sets using this approach (MSigDB v 4.0, c2 collection of curated gene sets).
Pathologic Analysis
All hematoxylin and eosin (H&E) slides from the cases of TCEB1-mutated renal cell carcinoma from Sato et al cohort, as well as all the available digital slides from 2 of 3 cases from the TCGA cohort, were reviewed by two experienced genitourinary pathologists (VER, SKT). Additional unstained slides were acquired from the Sato et al cohort and immunohistochemical stains for carbonic anhydrase-IX (CA-IX), hypoxiainducible factor 1-alpha (HIF-1a), CK7, CD10 and high molecular weight cytokeratin (34BE12) were performed. The choice of immunohistochemical stains was based on the utility of these markers among certain renal cell carcinomas that may be confused with these TCEB1-mutated tumors because of some morphologic overlaps. (2, 11)
Available digital slides of clear cell renal cell carcinoma from TCGA web-portal (https://tcga-data.nci.nih.gov/tcga/) were reviewed to ascertain if the morphologic features of TCEB1-mutated tumors are unique, or whether these were shared by some other clear cell renal cell carcinoma tumors.
Results
Copy number Analysis
As previously reported by Sato et al. all of the TCEB1-mutated tumors were characterized by broad loss of heterozygosity of chromosome 8, with one tumor (clear cell renal cell carcinoma-42) containing broad copy neutral loss of heterozygosity, one tumor (clear cell renal cell carcinoma-48) containing loss of heterozygosity of most of 8q along with copy neutral loss of heterozygosity of TCEB1 (Supplemental Figure 1). Additionally, none of the tumors contained 3p loss, 5q amplifications, (one tumor contained whole chromosome 5 gain), 9p or 14q loss, which represent the most common copy number aberrations in clear cell renal cell carcinoma. All three TCEB1-mutated tumors in the TCGA demonstrated nearly identical copy number alterations. All tumors contained broad loss of heterozygosity of chromosome 8, and none contained 3p loss, 5q gain, 9p or 14q loss (Figure 1A for comparison to TCGA cohort). Four of the 11 TCEB1-mutated tumors contained broad gains of chromosome 7, but no other recurrent events were noted.
Figure 1.

A) Genome wide copy number plots depicting chromosomal gains (red) and losses (blue) in low grade clear cell renal cell carcinomasamples from the TCGA vs TCEB1 mutated samples in the combined TCGA and Sato et al data sets. B) Recurrent mutations in both the combined low grade clear cell renal cell carcinomacohort vs TCEB1 mutated samples.
Mutation Analysis
All TCGA TCEB1 mutations exclusively involved VHL-binding site residues Tyr79. The TCEB1 mutant tumors, as assessed from either Sato et al or TCGA cohorts, had completely different mutation patterns compared to clear cell renal cell carcinoma which show frequently mutated 3p genes including VHL, PBRM1 or SETD2 (Supplemental Fig 2). One tumor in the Sato et al cohort contained a mutation in BAP1, however this was a missense mutation predicted to have low functional impact, and was not accompanied by 3p loss. Additionally, immunohistochemical staining of this tumor showed retained BAP1 protein (data not shown). Further interrogation of both cohorts identified only two recurrent clear cell renal cell carcinoma-associated mutations in the TCEB1-mutated samples, a PIK3CA mutation (ccrcc-48) and a MUC4 mutation (ccrcc-35) (Figure 1B).
Expression analysis
After demonstrating that TCEB1-mutated tumors possess unique copy number and mutation profiles, we hypothesized that these tumors would possess specific expression signatures. We compared the expression profiles of TCEB1-mutated tumors to a large number of low-grade TCEB1 wild-type tumors.
First, we compared the whole transcriptome expression profiles of TCEB1 mutant tumors from the Sato et al and TCGA cohorts (n=5 and 3, respectively). Comparing expression changes (measured by microarrays and RNA-seq) between the two cohorts identified a strong global correlation (Spearman correlation rho=0.47, p=0, Figure 2). This correlation was not due to a bias in DNA copy number profiles, as the same level of correlation (rho = 0.46) was present even after removing all genes on chromosomes with frequent copy number alterations (chromosomes 3, 5, 9, 14 and 8) (data not shown). This result was concordant with our hypothesis that TCEB1 mutant tumors had unique expression signatures.
Figure 2.
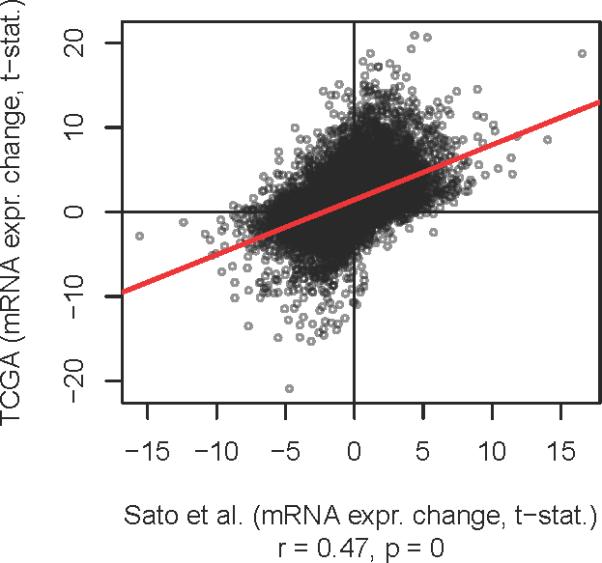
Genome wide mRNA expression correlation between Sato et al and TCGA datasets when comparing TCEB1 mutated tumors vs low grade clear cell renal cell carcinoma(X and Y axses respectively).
Combined dataset pathway-based analysis revealed statistically significant gene expression changes associated with TCEB1 mutations. Several of the top ranking down-regulated gene sets (p<0.05) were associated with TCEB1 gene function and its role in formation and activation of RNA polymerase II elongation (Supplemental Table 1). Interestingly, TCEB1-mutated tumors showed mRNA down regulation of multiple components involved in RNA Pol II elongation such as TCEB1, TCEB2, POLR2C, POLR2E, and CDK7 (p < 0.05, TCGA and Sato et al data combined, Figure 3A and B). In addition to the TCEB mutations, all TCEB1-mutated tumors also carried chromosome 8 loss of heterozygosity (8-loss of heterozygosity) in the other allele. On the other hand, while 25 low-grade clear cell renal cell carcinoma tumors showed 8-loss of heterozygosity, none had a TCEB1 mutation. We therefore analyzed expression changes in these tumors separately from other low-grade tumors in order to investigate if the effect on the RNA pol II elongation pathway gene expression levels could be associated to 8-loss of heterozygosity alone. As expected, TCEB1 (encoded on chromosome 8) mRNA expression levels were lower in 8-loss of heterozygosity samples compared to other low-grade clear cell renal cell carcinoma tumors (Figure 3B). However, other Pol II elongation pathway genes such as POLR2C, CDK7, POLR2E and TCEB2 were only significantly down-regulated in the presence of TCEB1 mutations (Figure 3B).
Figure 3.
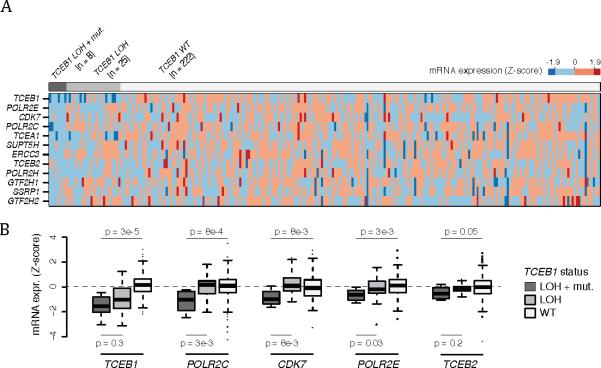
Pathway analysis reveals down regulation of Pol II Elongation genes in TCEB1 mutated tumors. A) Heatmap of mRNA expression of Pol II elongation genes stratified by TCEB1 mutation and concomitant loss of heterozygosity (loss of heterozygosity ), loss of heterozygosity alone, and in the wildtype setting. B) Box plot of specific Pol II elongation genes demonstrating a lack of expression changes in tumors with loss of heterozygosity alone compared to combined TCEB1 mutation and loss of heterozygosity .
In summary, these data suggest that TCEB1 mutations may affect RNA Pol II elongation efficiency by causing a concomitant reduction in expression of other elongation pathway members through mechanisms unknown at present. Additional intriguing pathway alterations were also noted, most clearly when analyzing the cohorts independently. When analyzing the Sato data set (5 mutated tumors vs 67 low grade clear cell renal cell carcinomas), several gene sets related to 5' AMP-activated protein kinase (AMPK) pathway activation were downregulated in the TCEB1-mutated tumors, suggesting a lack of reliance on the mTOR pathway as compared to clear cell renal cell carcinoma(Supplemental Figure 3). This signal was also evident in the TCGA cohort, although without statistical significance likely related to the smaller cohort (3 mutated tumors vs 180 low grade clear cell renal cell carcinomas).
Histopathology results
Microscopic features
All the tumors in which the tumor borders could be assessed (9 of 10) were well-circumscribed with at least partial encapsulation. Variable amount of cystic change was present in all. All 10 showed thick fibro-muscular bands traversing (as well as surrounding at least partially in most cases) the tumor (Figure 4 A), imparting a multi-nodular appearance to the tumor on scanner-view evaluation (Supplemental Figure 4A). Tumor architecture ranged from small acinar with intricately branching thin vascular septations (akin to that seen in a typical clear cell renal cell carcinoma) (Supplemental Figure 4B), to more solid alveolar (Supplemental Figure 4C), tubular (often branching, with infoldings) (Figure 4B), to foci with mostly small papillary tufting or occasional longer papillations (Figure 4C). Cytologically, the tumor cells appeared to have clear cytoplasm at low-magnification evaluation. At higher magnification, however, these “clear” cells often showed finely granular or reticulate cytoplasm (Figure 4D). All tumors appeared to have voluminous cytoplasm at least in some areas of the neoplasm (Figure 4D). The cell membranes were prominent, particularly in such areas. The nuclei in 9/10 were low-grade (equal to Fuhrman grade 2) with only few foci showing easily identifiable nucleoli (similar to Fuhrman grade 3) in one. Three tumors showed linear arrangement of the nuclei, away from the basement membrane (mimicking clear cell-papillary renal cell carcinoma) (Supplemental Figure 4D), but this arrangement was only focal. No tumor necrosis, lymphovascular invasion, or histiocytes were present in any tumor. All tumors were confined to the renal parenchyma (Table 2 for summary of the morphology).
Figure 4.
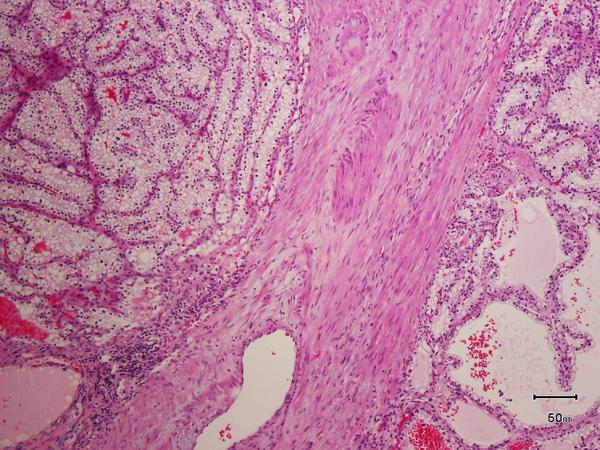
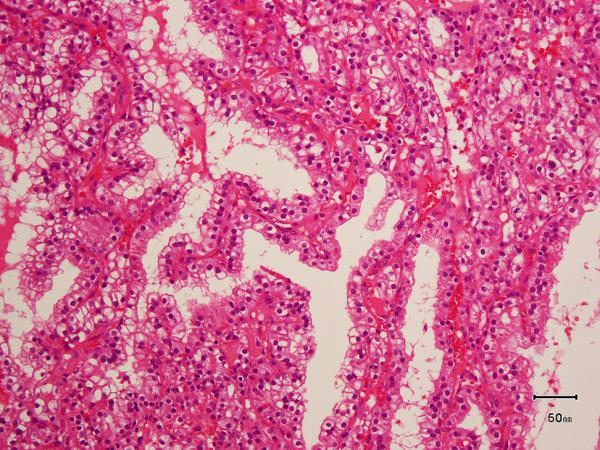
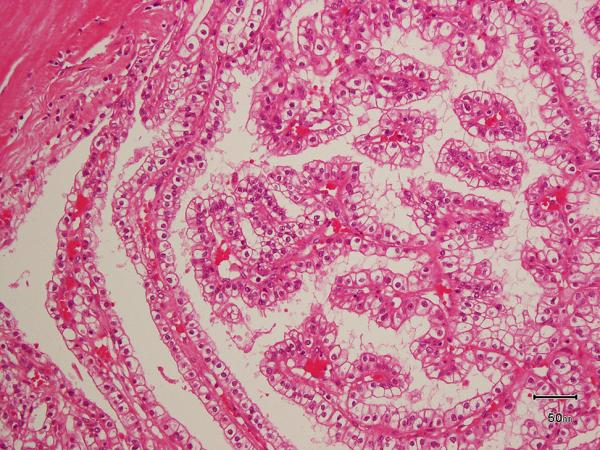
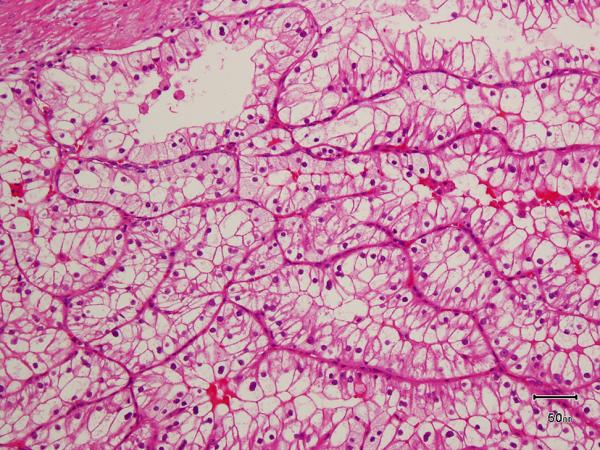
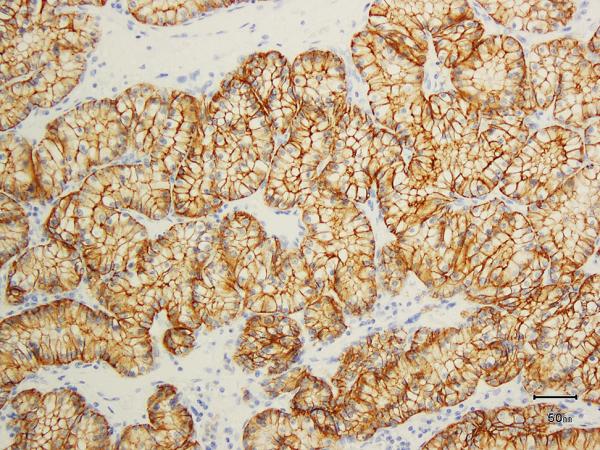
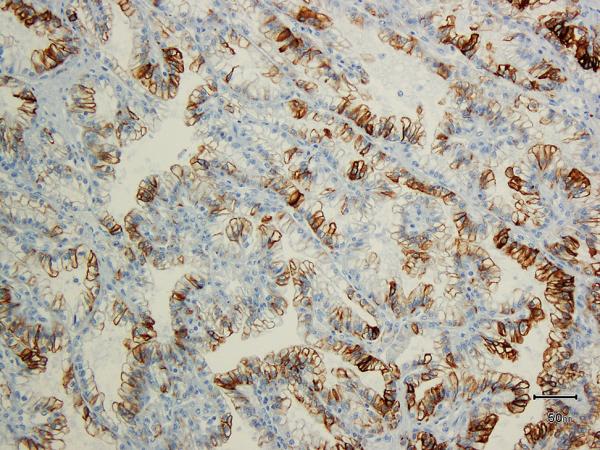
A) Two nodules of the tumor separated by a thick band of fibromuscular stroma, B) branching tubules in the tumor; the branchings and infoldings give the appearance of papillations, C) long, true papillations are also common in the tumor, D) the clear-appearing cells in the tumor often show fine granules and fibrillations in the cytoplasm; the cells typically appear voluminous with prominent cell membranes, E) immunohistochemical stain for carbonic anhydrase-IX (CA-IX) shows diffuse, membranous (box-like) positivity in all tumors, and F) all tumors are immunoreactive for cytokeratin 7 (CK7), exhibiting patchy (as shown here) to more diffuse positivity.
Table 2.
Morphological and immunohistochemical features of TCEB1-mutated tumors in the Sato and TCGA data sets
| Case# | Fibromuscular bands | Nodular configuration | Architectural patterns (in descending order)* | Clear cells with voluminous cytoplasm & prominent borders | ccPRCC-like nuclear arrangement | HIF-1a (% positive cells) | CA-IX (% positive cells) | CK7 (% positive cells) | CD10 (% positive cells) | 34be12 (% positive cells) |
|---|---|---|---|---|---|---|---|---|---|---|
| 1 | + | + | TU/BTU, Cystic, Pap | + | – | 85 | 100 | 60 | 15 | 0 |
| 2 | + | + | TU/BTU, Pap, Acinar, Cystic | + | – | 20 | 100 | 40 | 3 | 0 |
| 3 | + | + | Cystic,TU/BTU, Acinar | + | + | 95 | 100 | 75 | 40 | 10 |
| 4 | + | + | Cystic, TU/BTU, Sol alv | + | – | 75 | 100 | 10 | 40 | 0 |
| 5 | + | + | Tu/BTU, Cystic, Acinar | + | – | 20 | 100 | 80 | 50 | 0 |
| 6 | + | + | TU/BTU, Solid alv, Acinar, Cystic, Pap | + | + | 70 | 100 | 8 | 0 | 0 |
| 7 | + | + | TU/BTU, Cystic, Pap | + | + | 35 | 100 | 85 | 20 | 0 |
| 8 | + | + | Solid alv, Acinar, TU/BTU, Cystic | + | – | 80 | 100 | 12 | 8 | 0 |
| 9 | + | + | TU/BTU, Sol alv, Acinar, Cystic, Pap | + | – | ND | ND | ND | ND | ND |
| 10 | + | + | Pap, Acinar, Cystic, TU/BTU | + | – | ND | ND | ND | ND | ND |
+= present; -= not present; TU/BTU*= tubular, branching tubules; Pap*= true papillations; Sol Alv*= solid alveolar; ccPRCC= clear cell papillary renal cell carcinoma; HIF-1a= hypoxia inducible factor-1 alpha; CA-IX= carbonic anhydrase-IX
Except for the 3 tumors with TCEB1 mutations, none of the other 300 consecutive tumors with digital slides in the TCGA portal that were reviewed, showed morphological features similar to the TCEB1-mutated tumors.
Immunohistochemistry
All 8 tumors on which IHC was performed showed diffuse positivity for CA-IX (membranous, box-like in 100% of cells) (Figure 4E). HIF-1 alpha (nuclear) was diffusely positive in 5 (Supplemental Figure 4E), and showed patchy positivity in 3. CK7 was positive in all 8 tumors (Figure 4F); in 5 tumors immunoreactivity was diffuse, whereas in 3 it was patchy with only 10-15% cells showing any positivity. CD10 was completely negative in 1 and diffusely positive in 1 (75% cells); in the rest it showed only focal positivity (Supplemental Figure 4F). 34BE12 was negative in all but 1 tumor, in which very focal staining was observed. See Table 2 for summary.
Molecular Comparison
Because some TCEB1-mutated tumors showed some features that are commonly seen in the recently described clear cell papillary (clear cell papillary renal cell carcinoma) renal cell carcinoma (i.e., CA-IX , HIF-1 and CK7 positivity, focal linear arrangement of the nuclei, and fibromuscular stroma), we sequenced 10 clear cell papillary renal cell carcinoma tumors, all of which were found to be wild type for both TCEB1 and VHL (data not shown).
Clinical Features
All 11 were pT stage 1 (pT1) tumors, and none has metastasized at last follow up (median 48 months - Table 1).
Table 1.
Clinical and pathologic features if TCEB1-mutated tumors in the Sato and TCGA data sets.
| Sample ID | Sex | Age | Stage at diagnosis | Fuhrman grade | Sarcomatoid component | Metastases | Outcome | Follow up (months) |
|---|---|---|---|---|---|---|---|---|
| ccRCC-27 | M | 56 | pT1aN0M0 | 1 | - | - | alive | 53 |
| ccRCC-35 | M | 67 | pT1aN0M0 | 1 | - | - | alive | 46 |
| ccRCC-42 | M | 73 | pT3aN0M0 | 3 | - | - | alive | 39 |
| ccRCC-48 | M | 42 | pT1bN0M0 | 2 | - | - | alive | 33 |
| ccRCC-54 | M | 57 | pT1bN0M0 | 2 | - | - | alive | 40 |
| ccRCC-107 | M | 66 | pT1aN0M0 | 2 | - | - | alive | 106 |
| ccRCC-186 | M | 60 | pT1aN0M0 | 2 | - | - | alive | 48 |
| ccRCC-193 | M | 77 | pT1aN0M0 | 2 | - | - | alive | 85 |
| TCGA-CJ-4889 | F | 63 | pT1aN0M0 | Pathology slides unavailable for review | - | - | alive | 64 |
| TCGA-CZ-4862 | M | 46 | pT1bN0M0 | 2 | - | - | alive | 61 |
| TCGA-B8-5545 | M | 42 | pT1aN0M0 | 2 | - | - | alive | 17 |
Discussion
Detailed comprehensive molecular and pathologic analysis of renal cell carcinoma has lead to the discovery and expansion of the various renal cell carcinoma subtypes. The latest International Society of Urological Pathology consensus conference on Renal Neoplasms has identified 5 new distinct renal cell carcinoma entities, including clear cell-papillary renal cell carcinoma, acquired cystic disease-associated renal cell carcinoma and some types of MiTF family translocation associated renal cell carcinoma's.(1, 12, 13) Similarly our combination of genomic and pathologic interrogation suggests that TCEB1-mutated renal cell carcinoma tumors deserve to be added as a novel variant of renal cell carcinoma.
Utilizing a combined cohort of 11 TCEB1-mutated tumors we found a complete lack of fundamental events of clear cell renal cell carcinoma carcinogenesis, namely losses of 3p and VHL, which have been detected at rates as high as 80-90% in clear cell renal cell carcinoma.(3, 14, 15) Further distinguishing these tumors from clear cell renal cell carcinoma, they lack secondary alterations in tumors suppressors such as PBRM1, and mutations in genes such as SETD2, KDM5C and BAP1, which predict for aggressive forms of clear cell renal cell carcinoma (one tumor with a BAP1 missense mutation had no loss of 3p and had retained BAP1 protein expression on immunohistochemistry). TCEB1-mutated tumors also did not possess any additional recurrent copy number events such as 5q amplifications or 14q or 9p losses that are common in clear cell renal cell carcinoma. These distinct mutation and copy number profiles were exclusive in the TCEB1-mutated samples even when comparing them to a similarly low-grade cohort found in the clear cell renal cell carcinoma TCGA samples, as well as clear cell papillary renal cell carcinoma renal cell carcinoma.
Intriguingly, TCEB1 mutational patterns do not follow the classic tumor suppressor profile; the mutations almost always occur at a single hotspot amino acid residue (Tyr 79), which would follow more of an oncogene paradigm – although data from Sato et al suggests that the region interferes with VHL binding. On the other hand, all TCEB1-mutated samples were always accompanied by a loss of the companion allele, which is a feature associated with a tumor suppressor. To our knowledge this is the first known example of this phenomenon.
Further evidence of genomic uniqueness of these tumors came from mRNA expression analysis, which was available on 8 tumors. First, unbiased genome wide analysis showed a strong correlation between differently expressed genes in the TCEB1-mutated tumors vs the low grade TCGA tumors in both independent cohorts. Secondly, pathway-based analysis of expression changes showed strong enrichment in pathways in which TCEB1 has a vital function. TCEB1 encodes for the protein elongin C, which is one of 3 subunits of the factor B (SIII) complex. This entire complex is essential for proteasomal degradation of hydroxylated HIF1a through the recruitment of VHL and explains how these tumors display overexpressed HIF1a and its downstream signaling patterns such as CA-IX (figure 4E) without loss of VHL.(16, 17) This factor also increases the RNA polymerase II (POL II) transcription elongation past template-encoded arresting sites.(17) In our analysis, tumors with TCEB1 mutations have down regulation of multiple genes within this complex including POLR2E, POLR2C, CDK7, TCEA1 and TCEB2, in addition to TCEB1 (Figure 3). This polygenic phenomenon suggests that mutated TCEB1, which is also associated with lower TCEB1 mRNA expression levels, may also impact a regulatory feedback loop for other genes in the POL II elongation complex. Further pathway analysis suggested that TCEB1-mutated tumors may be less dependent on mTOR signaling and other AMPK-related metabolic programming. This certainly requires further investigation in larger cohorts.
Morphologic and immunohistochemical analysis also argued for the distinctness of these tumors. All TCEB1 tumors contained thick fibromuscular bands transecting the tumor, clear cell cytology frequently with cells showing voluminous cytoplasm and prominent cell membranes, clear cell renal cell carcinoma-like acinar areas and frequent infolding tubular and focally papillary architecture. Clear cell renal cell carcinoma with prominent fibromuscular stroma with associated CK7 immunoreactivity have been described in the past. (2, 11, 18) Many of such tumors have also been reported to lackVHL mutations and 3p losses. Some of these are now regarded as the distinct entity of clear cell papillary renal cell carcinoma. It is likely that many others may be the TCEB1-mutated tumors as described herein, since specific investigations involving the gene were not performed in these studies. Because of some morphological and immunohistochemical overlap, and an understanding of the molecular profile [2, 16] of clear cell papillary renal cell carcinoma, we also performed targeted sequencing of 10 clear cell papillary renal cell carcinoma tumors for TCEB1 and VHL mutations. All of the clear cell papillary renal cell carcinoma tumors were wild type for both VHL and TCEB1 (data not shown). Table 3 summarizes some of the morphologic and immunoshistochemical differences between clear cell papillary and TCEB1-mutated renal cell carcinomas.
Table 3.
Comparative features of TCEB1-mutated and clear cell papillary renal cell carcinoma
| Features | Clear cell papillary renal cell carcinoma | TCEB-mutated renal cell carcinoma |
|---|---|---|
| Morphological: | ||
| Fibromuscular bands | Maybe present | Present in all tumors |
| Fibromuscular bands imparting a multinodular appearance | No/very uncommon | Present in all tumors |
| Branching tubules and papillations | Present | Present |
| Linear arrangement of nuclei away from basement membrane | Always present, diffusely | Maybe present, focally |
| Voluminous cytoplasm with prominent cell membranes | Not present | Present at least focally in all tumors |
| Immunohistochemical: | ||
| CK7 | Always diffusely positive (in almost 100% cells) | Positive, in variable proportion of cells (not 100% cells) |
| Carbonic anhydrase-IX | Always diffusely positive, in a cup-shaped pattern (luminal membranes mostly do not stain) | Always diffusely positive, in a box-shaped pattern (all membranes stain) |
| CD10 | Usually negative; rarely, focally positive | Variably positive in most tumors |
| High molecular weight cytokeratin (34be12) | Positive in a majority of tumors | Usually negative |
Our analysis of TCEB1 tumors has broader implications for understanding the natural history of many clear cell renal cell carcinoma tumors. While TCEB1-mutated tumors, clear cell renal cell carcinoma and clear cell papillary renal cell carcinoma, may share the commonality of HIF-1a activation, only clear cell renal cell carcinoma possesses the ubiquitous 3p loss. Furthermore, TCEB1 tumors, which are mostly low-grade, lack the secondary alterations in 3p genes such as BAP1 and SETD2, suggesting that these additive hits may be essential in promoting high grade and potentially metastatic tumors.
Conclusions
In sum, we provide multiple areas of evidence that TCEB1-mutated renal cell carcinoma are a unique subtype. While they share similar activation of hypoxia inducible factor as seen in both clear cell renal cell carcinoma and clear cell papillary renal cell carcinoma tumors, the mechanism in which this occurs is through distinct means. The lack of 3p loss and associated mutations potentially explains the indolent nature of these tumors and offers insights into the metastatic underpinnings of clear cell renal cell carcinoma.
Supplementary Material
Acknowledgments
Funded by the Sidney Kimmel Center for Prostate and Urologic Cancers (AAH); J. Randall & Kathleen L. MacDonald Research Fund in Honor of Louis V. Gerstner, Jr (JJH); Tuttle Cancer Research Fund (JJH); Danish Research Council (AJ); MSKCC Center for Translational Cancer Genomic Analysis; U24 CA143840 (PI Sander)
Footnotes
Conflict of Interest: There are no conflicts of interest or pertinent disclosures
References
- 1.Srigley JR, Delahunt B, Eble JN, et al. The International Society of Urological Pathology (ISUP) Vancouver Classification of Renal Neoplasia. Am J Surg Pathol. 2013;37:1469–89. doi: 10.1097/PAS.0b013e318299f2d1. [DOI] [PubMed] [Google Scholar]
- 2.Rohan SM, Xiao Y, Liang Y, et al. Clear-cell papillary renal cell carcinoma: molecular and immunohistochemical analysis with emphasis on the von Hippel-Lindau gene and hypoxia-inducible factor pathway-related proteins. Mod Pathol. 2011;24:1207–20. doi: 10.1038/modpathol.2011.80. [DOI] [PubMed] [Google Scholar]
- 3.Cancer Genome Atlas Research N, Analysis working group: Baylor College of M. Creighton CJ, et al. Comprehensive molecular characterization of clear cell renal cell carcinoma. Nature. 2013;499:43–9. doi: 10.1038/nature12222. [DOI] [PMC free article] [PubMed] [Google Scholar]
- 4.Sato Y, Yoshizato T, Shiraishi Y, et al. Integrated molecular analysis of clear-cell renal cell carcinoma. Nat Genet. 2013;45:860–7. doi: 10.1038/ng.2699. [DOI] [PubMed] [Google Scholar]
- 5.Varela I, Tarpey P, Raine K, et al. Exome sequencing identifies frequent mutation of the SWI/SNF complex gene PBRM1 in renal carcinoma. Nature. 2011;469:539–42. doi: 10.1038/nature09639. [DOI] [PMC free article] [PubMed] [Google Scholar]
- 6.Hakimi AA, Chen YB, Wren J, et al. Clinical and Pathologic Impact of Select Chromatin-modulating Tumor Suppressors in Clear Cell Renal Cell Carcinoma. Eur Urol. 2013;63:848–54. doi: 10.1016/j.eururo.2012.09.005. [DOI] [PMC free article] [PubMed] [Google Scholar]
- 7.Kapur P, Pena-Llopis S, Christie A, et al. Effects on survival of BAP1 and PBRM1 mutations in sporadic clear-cell renal-cell carcinoma: a retrospective analysis with independent validation. Lancet Oncol. 2013;14:159–67. doi: 10.1016/S1470-2045(12)70584-3. [DOI] [PMC free article] [PubMed] [Google Scholar]
- 8.Hakimi AA, Ostrovnaya I, Reva B, et al. Adverse outcomes in clear cell renal cell carcinoma with mutations of 3p21 epigenetic regulators BAP1 and SETD2: a report by MSKCC and the KIRC TCGA research network. Clin Cancer Res. 2013;19:3259–67. doi: 10.1158/1078-0432.CCR-12-3886. [DOI] [PMC free article] [PubMed] [Google Scholar]
- 9.Cancer Genome Atlas Research N Comprehensive molecular characterization of clear cell renal cell carcinoma. Nature. 2013;499:43–9. doi: 10.1038/nature12222. [DOI] [PMC free article] [PubMed] [Google Scholar]
- 10.Subramanian A, Tamayo P, Mootha VK, et al. Gene set enrichment analysis: a knowledge-based approach for interpreting genome-wide expression profiles. Proc Natl Acad Sci U S A. 2005;102:15545–50. doi: 10.1073/pnas.0506580102. [DOI] [PMC free article] [PubMed] [Google Scholar]
- 11.Martignoni G, Brunelli M, Segala D, et al. Renal cell carcinoma with smooth muscle stroma lacks chromosome 3p and VHL alterations. Mod Pathol. 2014;27:765–74. doi: 10.1038/modpathol.2013.180. [DOI] [PubMed] [Google Scholar]
- 12.Medendorp K, van Groningen JJ, Schepens M, et al. Molecular mechanisms underlying the MiT translocation subgroup of renal cell carcinomas. Cytogenet Genome Res. 2007;118:157–65. doi: 10.1159/000108296. [DOI] [PubMed] [Google Scholar]
- 13.Ramphal R, Pappo A, Zielenska M, Grant R, Ngan BY. Pediatric renal cell carcinoma: clinical, pathologic, and molecular abnormalities associated with the members of the mit transcription factor family. Am J Clin Pathol. 2006;126:349–64. doi: 10.1309/98YE9E442AR7LX2X. [DOI] [PubMed] [Google Scholar]
- 14.Beroukhim R, Brunet JP, Di Napoli A, et al. Patterns of gene expression and copy-number alterations in von-hippel lindau disease-associated and sporadic clear cell carcinoma of the kidney. Cancer Res. 2009;69:4674–81. doi: 10.1158/0008-5472.CAN-09-0146. [DOI] [PMC free article] [PubMed] [Google Scholar]
- 15.Nickerson ML, Jaeger E, Shi Y, et al. Improved identification of von Hippel-Lindau gene alterations in clear cell renal tumors. Clin Cancer Res. 2008;14:4726–34. doi: 10.1158/1078-0432.CCR-07-4921. [DOI] [PMC free article] [PubMed] [Google Scholar]
- 16.Kibel A, Iliopoulos O, DeCaprio JA, Kaelin WG., Jr Binding of the von Hippel-Lindau tumor suppressor protein to Elongin B and C. Science. 1995;269:1444–6. doi: 10.1126/science.7660130. [DOI] [PubMed] [Google Scholar]
- 17.Aso T, Lane WS, Conaway JW, Conaway RC. Elongin (SIII): a multisubunit regulator of elongation by RNA polymerase II. Science. 1995;269:1439–43. doi: 10.1126/science.7660129. [DOI] [PubMed] [Google Scholar]
- 18.Michal M, Hes O, Kuroda N, Kazakov DV, Hora M. Difference between RAT and clear cell papillary renal cell carcinoma/clear renal cell carcinoma. Virchows Arch. 2009;454:719. doi: 10.1007/s00428-009-0788-9. [DOI] [PubMed] [Google Scholar]
Associated Data
This section collects any data citations, data availability statements, or supplementary materials included in this article.