

Abstract
Bone size (BS) is one of the major risk factors for osteoporotic fractures. BS variation is genetically determined to a substantial degree with heritability over 50%, but specific genes underlying variation of BS are still largely unknown. To identify specific genes for BS in Chinese, initial genome-wide association scan (GWAS) study and follow-up replication study were performed. In initial GWAS study, a group of 12 contiguous single-nucleotide polymorphism (SNP)s, which span a region of ~ 25 kb and locate at the upstream of HMGN3 gene (high-mobility group nucleosomal binding domain 3), achieved moderate association signals for spine BS, with P values ranging from 6.2E–05 to 1.8E–06. In the follow-up replication study, eight of the 12 SNPs were detected suggestive replicate associations with BS in 1,728 unrelated female Caucasians, which have well-known differences from Chinese in ethnic genetic background. The SNPs in the region of HMGN3 gene formed a tightly combined haplotype block in both Chinese and Caucasians. The results suggest that the genomic region containing HMGN3 gene may be associated with spine BS in Chinese.
Introduction
Osteoporosis is a skeletal disorder characterized by excessive skeletal fragility leading to an increased risk of fracture. Bone size (BS) is one of the major parameters in determining bone quality and strength (Ahlborg et al. 2003; Augat et al. 1996; Fox et al. 1998; McCreadie and Goldstein 2000). Abnormal BS significantly contributes to the pathology of osteoporotic fracture (Deng et al. 2002c; Seeman et al. 2001), the most serious clinical complication of osteoporosis. BS variation is genetically determined to a substantial degree (Deng et al. 2002a; Tan et al. 2008) with heritability over 50%, but specific genes underlying variation of BS are still largely unknown.
Genetic studies via candidate gene association analyses were performed to identify genes contributing to variation of BS (Fang et al. 2007; Lei et al. 2005a, b, c, 2005; Malkin et al. 2005; van der Sluis et al. 2003; Zmuda et al. 2001). However, the number of candidate genes tested in previous candidate gene association analyses is very limited, partly because the selection of candidate genes was based on known significance in bone biology.
Recently developing genome-wide association scan (GWAS) studies are powerful tools to rapidly and systematically identify genes for complex traits/diseases. In Caucasian, our group performed the first GWAS study for BS by interrogating ~380,000 SNPs on the Affymetrix platform in 1,000 homogeneous unrelated Caucasian subjects, and identified that PLCL1 (phospholipase c-like 1) is a novel gene associated with variation of BS (Liu et al. 2008). However, in Chinese, which is the largest population in the world, has well-known difference from Caucasian in ethnic genetic background, no such GWAS study on BS has been performed to dissect the genetic basis of BS at the genome-wide scale.
Here, we performed an initial GWAS study in 1,627 unrelated Chinese subjects using highly dense Affymetrix Genome-Wide Human SNP Arrays that examine ~909,622 SNPs and a subsequent replication study to identify genes important to BS.
Materials and methods
The study was approved by the necessary Institutional Review Board or Research Administration of the involved institutions. Signed informed consent documents were obtained from all study participants before entering the study. For the initial GWAS and replicate samples, areal BS values of lumbar spine (L1–L4) were measured using dual energy X-ray absorptiometry (DXA) machines (Hologic Inc., Bedford, MA, USA) that were calibrated daily.
For the initial GWAS sample, a total of 1,627 Han adult unrelated subjects (age 34.5 ± 13.2 years) including 802 males and 825 females were recruited from two cities (Xi’an and Changsha) and their surrounding areas. All study subjects belong to Chinese Han ethnic group. Strict exclusion criteria (Deng et al. 2002b) were adopted to minimize any known and potential confounding effects on variation of bone phenotype. Briefly, patients with chronic diseases/conditions that may potentially affect bone mass or bone metabolism were excluded. These diseases/conditions included chronic disorders involving vital organs (heart, lung, liver, kidney, and brain), serious metabolic diseases (diabetes, hypo- or hyperparathyroidism, and hyperthyroidism), other skeletal diseases (Paget’s disease, osteogenesis imperfecta, and rheumatoid arthritis), chronic use of drugs affecting bone metabolism (corticosteroid therapy, and anticonvulsant drugs), and malnutrition conditions (chronic diarrhea and chronic ulcerative colitis). For the replication study sample, a total of 1,728 random samples (age 51.6 ± 12.9 years) were recruited in Midwestern US in Kansas City, Missouri and Omaha, Nebraska. All identified subjects were American Caucasians. Basic characteristics of study subjects were summarized in Table 1.
Table 1.
Basic characteristics of study subjects
| Trait | Initial discovery | Replication |
|---|---|---|
| Sample size | 1,627 | 1,728 |
| Age (years) | 34.5 (13.2) | 51.6 (12.9) |
| Height (m) | 1.64 (0.08) | 1.63 (0.06) |
| Weight (kg) | 60.1 (10.5) | 71.4 (16.0) |
| Spine BS (cm2) | 60.4 (7.0) | 58.6 (5.7) |
Mean (SD)
Genotyping
Genomic DNA was extracted from whole human blood using a commercial isolation kit (Gentra systems, Minneapolis, MN, USA) following the protocol of the kit. For the initial GWAS sample, genotyping with the Affymetrix Genome-Wide Human SNP Array 6.0 was performed using the standard protocol recommended by the manufacturer. Fluorescence intensities were quantified using an Affymetrix array scanner 3000 7G. Data management and analyses were performed using the Affymetrix® Gene-Chip® Command Console® Software (AGCC). Contrast QC threshold, which measures how well experiments resolve SNP signals into three genotype clusters, was set at the default value of >0.4 for quality control. Subjects with contrast QC of <0.4 were subject to re-genotyping. The final average contrast QC across the entire sample reached a high level of 2.62. The average missing call rate for all SNPs is 1.67%. Out of the initial full-set of 909,622 SNPs, there are 17,888 SNPs with allele frequencies extremely deviating from Hardy–Weinberg equilibrium (P < 0.01), 202,984 SNPs with minor allele frequency (MAF) <1% and 618 with both. Therefore, the final SNP set maintained in the subsequent analyses contained 689,368 SNPs, yielding an average marker spacing of ~4 kb throughout the human genome. For the replication study sample, genotyping of SNPs was performed with the same Affymetrix Genome-Wide Human SNP Array 6.0 using the standard protocol. The final average contrast QC across the entire sample also reached a high level of 2.32. The average missing call rate for all SNPs is 1.27%.
Statistical analysis
GWAS analysis
Gender and age, two significant covariates, were used to adjust the raw spine BS values for subsequent analyses by using a liner regression method. Spine BS values and gender & age were used as dependent and independent variables, respectively, and the output residuals of spine BS were used as phenotype value in association analysis. PLINK (Purcell et al. 2007) was used to perform genotypic association analyses with the command “–assoc”. Genotypic association analyses were used to compare the difference of mean BS values among three genotypic groups for each SNP. The adjusted spine BS values were in agreement with the asymptotic multivariate normal distribution.
Haplotype analysis
The linkage disequilibrium (LD) [standardized D′ (D/Dmax)] patterns for the detected SNPs were analyzed and plotted using the Haploview program (Barrett et al. 2005) (http://www.broad.mit.edu/mpg/haploview/). Haplotype-specific association analysis in a quantitative trait association model was performed with the command “—hap-assoc” in the PLINK.
Population stratification
EIGENSTRAT was employed to perform principal component analysis to correct for stratification in GWAS studies. We used ~700,000 SNPs to calculate the principal components and the ten default main eigenvectors were used as covariates to adjust BS.
Meta-analysis
Meta-analysis for initial discovery and replication studies for BS was performed with the command “–meta-analysis” in the PLINK. The PLINK calculated four parameters for each SNP including P(F): fixed-effects meta-analysis P value; P(R): random-effects meta-analysis P value; Q: P value for Cochran’s Q statistics to test presence (P < 0.05) versus absence of heterogeneity; I: I2 heterogeneity index to test the extent of heterogeneity (0–100).
Results
Initial GWAS study
As shown in a quantile–quantile (Q–Q) plot (Fig. 1) that demonstrate the distribution of P values involving 689,368 eligible SNPs in the initial sample, the observed P values matched the expected P values over the range of 1 < −log10(P) < 4.5, but little departed at the extreme tail (−log10(P) > 4.5), probably suggesting that the suggestive associations identified are likely due to true variants rather than potential biases such as genotyping error, potential population stratification, and cryptic family relatedness.
Fig. 1.

Quantile–quantile (Q–Q) plot for BS in Chinese. From the Q–Q plot, the observed P values for BS match the expected P values under the null distributions over the range of (1 < −log10(P) < 4.5)
Figure 2 shows the distribution of P values in association analyses across the genome. We detected no significant associations according to the conservative genome-wide threshold of Bonferroni correction (P < 7.3E–08) (0.05/689,368). However, we detected 75 SNPs with moderate association signals (P < 1.0E–04). The most significant association was detected at rs17743190 (P = 1.8E–06), which is located at the upstream of high-mobility group nucleosomal binding domain 3 (HMGN3 gene). Moreover, at the HMGN3 locus, another 11 contiguous SNPs (Table 2), which span a region of ~25 kb, also achieved moderate association signals for spine BS, with P values ranging from 6.2E–05 to 6.1E–06. In the follow-up replication study, eight of the 12 SNPs were detected suggestive replicate association signals with BS in 1,728 unrelated female Caucasians, which have well-known difference from Chinese in ethnic genetic background. We also identified other two distinct groups of contiguous SNPs with moderate consistent association signals to BS, one in the upstream region of ALCAM gene (activated leukocyte cell adhesion molecule) and the other in the intron of COMMD7 gene (COMM domain containing 7) (Supplementary Table 1), but no significant or suggestive replicate association signals were detected for these two distinct groups in the 1,728 unrelated female Caucasians. Due to high phenotypic correlation between BS and height, we also performed association analysis between the 75 SNPs and height. Among the 75 SNPs, 48 SNPs were associated with height (P < 0.05) with the strongest association at rs16878913 (P = 9.5E–07). After we adjusted BS value with height, most of the association P values for the 75 SNPs were much weaker than those without adjustment of height (data not shown). These results taken together suggest that some of the detected SNPs have evident pleiotropic effects on both BS and height.
Fig. 2.
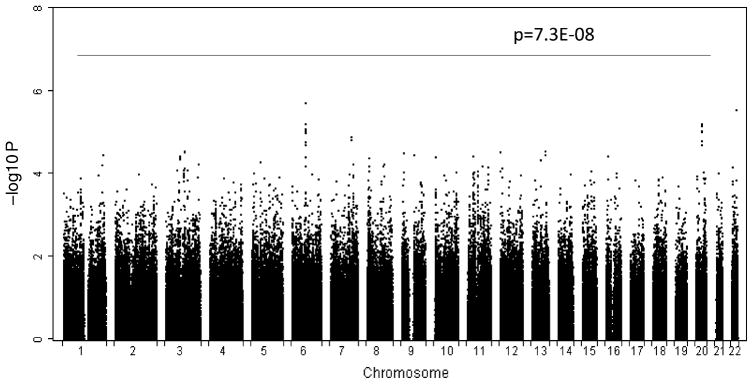
Distribution of P values across the genome in association analyses. The −log10 P values from 689,368 SNPs in 1,627 Chinese are plotted according to its physical position on successive chromosomes. “P = 7.3E–08” is the conservative genome-wide threshold of Bonferroni correction in this study
Table 2.
Associations of 12 SNPs in HMGN3 locus with BS and height
| SNP ID | Position | Allelea | BS
|
Height
|
Meta-analysisd | |||||||||
|---|---|---|---|---|---|---|---|---|---|---|---|---|---|---|
| Initial discovery
|
Replication
|
Chinese
|
|
|||||||||||
| MAF | β | Pb | MAF | βc | P | β | P | P(F) | P(R) | Q | I | |||
| rs17743190 | 80164398 | A/G | 0.09 | 1.83 | 1.8E–06 | 0.09 | 0.40 | 0.27 | 0.61 | 0.11 | 4.2E–05 | 0.12 | 6.6E–03 | 86.5 |
| rs3857454 | 80166252 | A/G | 0.11 | 1.57 | 6.1E–06 | 0.12 | 0.56 | 6.2E–02 | 0.70 | 4.2E–02 | 1.1E–05 | 3.6E–02 | 2.9E–02 | 79.2 |
| rs3907327 | 80164301 | C/A | 0.11 | 1.54 | 7.8E–06 | 0.12 | 0.52 | 8.5E–02 | 0.68 | 4.8E–02 | 2.2E–05 | 4.7E–02 | 2.5E–02 | 80.2 |
| rs17799762 | 80165971 | C/T | 0.11 | 1.53 | 8.3E–06 | 0.12 | 0.51 | 8.5E–02 | 0.67 | 5.1E–02 | 2.4E–05 | 4.9E–02 | 2.4E–02 | 80.5 |
| rs17799805 | 80166050 | C/A | 0.11 | 1.53 | 8.4E–06 | 0.12 | 0.55 | 6.7E–02 | 0.67 | 5.0E–02 | 1.6E–05 | 3.7E–02 | 3.0E–02 | 78.7 |
| rs1385530 | 80164684 | G/A | 0.11 | 1.53 | 8.8E–06 | 0.12 | 0.55 | 6.4E–02 | 0.63 | 6.8E–02 | 1.5E–05 | 3.6E–02 | 3.2E–02 | 78.4 |
| rs17799462 | 80163839 | C/T | 0.09 | 1.52 | 9.3E–06 | 0.09 | 0.17 | 0.60 | 0.68 | 5.0E–02 | 5.2E–04 | 0.21 | 4.7E–03 | 87.5 |
| rs3857453 | 80166130 | G/C | 0.11 | 1.52 | 9.9E–06 | 0.12 | 0.53 | 7.8E–02 | 0.68 | 5.0E–02 | 2.2E–05 | 4.3E–02 | 2.9E–02 | 79.2 |
| rs3857449 | 80163957 | T/C | 0.11 | 1.48 | 1.7E–05 | 0.12 | 0.56 | 6.3E–02 | 0.67 | 5.2E–02 | 2.2E–05 | 3.0E–02 | 4.2E–02 | 75.7 |
| rs10484943 | 80181477 | T/C | 0.11 | 1.50 | 1.9E–05 | 0.12 | 0.52 | 8.5E–02 | 0.61 | 8.6E–02 | 4.1E–05 | 4.4E–02 | 3.2E–02 | 78.2 |
| rs196670 | 80170314 | A/G | 0.19 | 1.43 | 3.8E–05 | 0.19 | 0.13 | 0.59 | 0.53 | 0.13 | 4.7E–03 | 0.24 | 2.2E–03 | 89.4 |
| rs16890720 | 80189011 | A/G | 0.15 | 1.40 | 6.2E–05 | 0.16 | 0.22 | 0.40 | 0.59 | 9.1E–02 | 2.0E–03 | 0.18 | 6.9E–03 | 86.3 |
HMGN3 gene is located at 6q14
The first allele represents the minor allele of each SNP
P values after correction of population stratification: EIGENSTRAT was employed to calculate the principal components and the ten default main eigenvectors were used as covariate to adjust BS
The direction of effect indicated by β is calculated for minor allele
Meta-analysis for initial discovery and replication studies for BS was performed with the command “–meta-analysis” in PLINK
P(F) fixed-effects meta-analysis P value, P(R) random-effects meta-analysis P value, Q P value for Cochran’s Q statistic, I I2 heterogeneity index
As shown in Table 2 and Supplementary Table 1, the fixed-effects meta-analysis P values (P(F)) for most of the 75 SNPs are little weaker than in initial study, but much stronger than in replicate study. However, for the 75 SNPs except for five SNPS (rs2955948, rs16960741, rs16999576, rs16999576 and rs926598), P values for Cochran’s Q statistic are significant and I2 heterogeneity indexes are high, suggesting high heterogeneity in effect of SNP across Chinese and Caucasians. In this situation, random-effects meta-analysis P values (P(R)) are more appropriate to evaluate the combined effects than P(F). The P(R) values for most of the 75 SNPs are much weaker than in initial study, but little stronger than in replicate study.
Figure 3 shows the LD pattern and the haplotype block structure for the SNP group of HMGN3 locus in initial Chinese sample. The SNPs in the region of HMGN3 gene formed a tightly combined haplotype block in initial Chinese sample (Fig. 3) and also in replicate Caucasian sample (data not shown). As shown in Supplementary Table 2, the PLINK detected two haplotypes for the 12 SNPs in the initial Chinese sample, and the associations for the two haplotypes are significant (P = 6.8E–05 at HAPL-1 and P = 9.3E–06 at HAPL-1). However, in the replicate Caucasian sample, six haplotypes were detected, but only one haplotype (HAPL-6) is significant.
Fig. 3.

Haplotype block for 12 SNPs detected in HMGN3 gene locus in Chinese. The detected SNPs are located at the upstream of HMGN3 (~200 kb). The LD patterns for the 12 SNPs were analyzed and plotted using the Haploview program
Previous genetic studies on BS are relatively few. Together, about seven genes (ANKH, PLCL1, COL1A1, COL1A2, ESR1, VDR, and CYP17) (Lei et al. 2005a; Liu et al. 2008; Long et al. 2004; Malkin et al. 2005; van der Sluis et al. 2003; Zmuda et al. 2001) were studied and found significant associations with BS at various skeletal sites (e.g., spine, femoral neck, hip, and hand). We selected 353 SNPs, which were located in the seven genes above and genotyped with Affymetrix Human Genome SNP 6.0, for association analysis with spine BS in initial Chinese sample. Only six SNPs from two genes (estrogen receptor-alpha and vitamin receptor) have P values of <0.05, but these P values will be not significant if adapting multiple testing corrections (FDR_BH).
Discussion
In Caucasian, a lot of genetic studies using genome-wide linkage scan (GWLS) (Shen et al. 2006; Xu et al. 2004) or candidate gene association analyses (Long et al. 2004; van der Sluis et al. 2003) identified quite a few chromosomal regions potentially harboring genes underlying variation of spine BS, or some variants in candidate genes associated with spine BS variation. Recently developing GWAS studies are powerful tools to rapidly and systematically identify genes for complex traits/diseases. Our group performed the first GWAS study of BS in 1,000 homogeneous unrelated Caucasian subjects (Liu et al. 2008). No such GWAS study on BS was performed to dissect the genetic basis of BS at the genome-wide scale in Chinese, which has well-known difference in genetic background from Caucasian. Therefore, it is necessary to perform independent genetic studies to rapidly and systematically identify genes for BS variation in Chinese. This study represents the first GWAS study for BS in Chinese.
HMGN3 is a nuclear protein that binds to nucleosomes, promotes chromatin unfolding, enhances access to nucleosomes, and modulates transcription from chromatin templates. This gene is a new, but important regulator of glucose homeostasis and demonstrates the relevance to glucose-stimulated insulin secretion (Ueda et al. 2009). Insulin acts directly on osteoclast activity, and thiazolidinediones (TZD) may have a negative effect by switching mesenchymal progenitor cells to adipose rather than bone tissue (Montagnani et al. 2011). The data from expression database demonstrated that this gene is expressed in tissues of bone and bone marrow (http://www.ncbi.nlm.nih.gov/UniGene/clust.cgi?UGID=140116&TAXID=9606&SEARCH=HMGN3). The current detected association between the HMGN3 gene and spine BS added further evidence on supporting the link between HMGN3 locus and bone. Such association results should be considered exploratory and will require more replications in larger cohorts to better understand their role on bone. Focused molecular functional studies deserve to be pursued to clarify the regulating mechanisms possibly from the aspect of insulin signaling and glucose metabolism.
In a previous GWAS study of BS in Caucasian subjects, we identified that PLCL1 (phospholipase c-like 1) is a novel gene associated with variation of BS at hip in Caucasian (Liu et al. 2008). However, we have not found any replicate association evidence in the current study at spine in Chinese, possibly suggesting the differences at skeletal sites in genetic determination of BS.
Some bone phenotypes are clearly under ethnic-specific genetic determination (Dvornyk et al. 2005, 2003; Lei et al. 2006, 2003). For example, five candidate genes (Dvornyk et al. 2005) were tested for their contribution of ethnicity to bone mineral density variation in Caucasian and Chinese. The frequencies and distribution patterns of SNPs of some prominent bone candidate genes were different between Caucasian and Chinese (Lei et al. 2003). In this study, all association signals for the 75 detected SNPs (Table 2 and Supplementary Table 1) in the initial study are stronger than in replication study, and some of them even have reverse direction of effect (β). Moreover, all the studied SNPs except for five SNPS (rs2955948, rs16960741, rs16999576, rs16999576, and rs926598), P values for Cochran’s Q statistic are significant and I2 heterogeneity indexes are high, suggesting high heterogeneity in effect of SNP across Chinese and Caucasians. The above observations combined together suggest evident differences in genetic regulators of BS in Chinese versus Caucasians.
This study has several limitations. First, the age between two cohorts are quite different (34.5 in Chinese versus 51.6 in Caucasian). Second, the sex composition is different, with both men and women in Chinese, but only women in Caucasian. These two above-mentioned differences may be the two important factors underlying discrepancy of the findings between Chinese and Caucasian. Second, the statistical power is relatively low. Calculated with a GWA-Power (Feng et al. 2011), the current sample size (n = 1,627) in initial study has only over 11% of power to detect the studied SNPs with strong LD (D′ = 0.9) with QTLs that explain over 1% of spine BS variation according to the conservative genome-wide threshold of Bonferroni correction (P < 7.3E–08) (0.05/689,368).
In conclusion, this study reported the first GWAS for BS in Chinese population. The results of this study suggest that HMGN3 locus may be associated with spine BS.
Supplementary Material
Acknowledgments
The study was partially supported by Natural Science Foundation of China (NSFC) (31071097, 30600364, 30771222, and 30900810), NSFC-CIHR (Canadian Institutes of Health Research) Joint Health Research Initiative Proposal (30811120436), NSFC/RGC (Research Grants Council) Joint Research Scheme (30731160618), and Shanghai Leading Academic Discipline Project (S30501) and startup fund from Shanghai University of Science and Technology. HWD was partially supported by grants from NIH (R03TW008221, R01AR050496, R01AG026564, R01AR057049, and P50AR055081) and Edward G. Schlieder Endowed Chair.
Footnotes
Electronic supplementary material The online version of this article (doi:10.1007/s00439-011-1093-7) contains supplementary material, which is available to authorized users.
Contributor Information
Shu-Feng Lei, Email: lei@hunnu.edu.cn, Laboratory of Molecular and Statistical Genetics and the Key Laboratory of Protein Chemistry and Developmental Biology of Ministry of Education, College of Life Sciences, Hunan Normal University, Changsha 410081, Hunan, People’s Republic of China.
Hui Shen, Department of Biostatistics and Bioinformatics, School of Public Health and Tropical Medicine, Tulane University, New Orleans, LA 70112, USA.
Tie-Lin Yang, School of Life Science and Technology, Xi’an Jiaotong University, Xi’an 710049, Shanxi, People’s Republic of China.
Yan Guo, School of Life Science and Technology, Xi’an Jiaotong University, Xi’an 710049, Shanxi, People’s Republic of China.
Shan-Shan Dong, School of Life Science and Technology, Xi’an Jiaotong University, Xi’an 710049, Shanxi, People’s Republic of China.
Xiang-Hong Xu, School of Life Science and Technology, Xi’an Jiaotong University, Xi’an 710049, Shanxi, People’s Republic of China.
Fei-Yan Deng, Department of Biostatistics and Bioinformatics, School of Public Health and Tropical Medicine, Tulane University, New Orleans, LA 70112, USA.
Qing Tian, Department of Biostatistics and Bioinformatics, School of Public Health and Tropical Medicine, Tulane University, New Orleans, LA 70112, USA.
Yong-Jun Liu, Department of Biostatistics and Bioinformatics, School of Public Health and Tropical Medicine, Tulane University, New Orleans, LA 70112, USA.
Yao-Zhong Liu, Department of Biostatistics and Bioinformatics, School of Public Health and Tropical Medicine, Tulane University, New Orleans, LA 70112, USA.
Jian Li, Department of Biostatistics and Bioinformatics, School of Public Health and Tropical Medicine, Tulane University, New Orleans, LA 70112, USA.
Hong-Wen Deng, Email: hdeng2@tulane.edu, Laboratory of Molecular and Statistical Genetics and the Key Laboratory of Protein Chemistry and Developmental Biology of Ministry of Education, College of Life Sciences, Hunan Normal University, Changsha 410081, Hunan, People’s Republic of China. Department of Biostatistics and Bioinformatics, School of Public Health and Tropical Medicine, Tulane University, New Orleans, LA 70112, USA. Center of Systematic Biomedical Research, University of Shanghai for Science and Technology, Shanghai 200093, People’s Republic of China.
References
- Ahlborg HG, Johnell O, Turner CH, Rannevik G, Karlsson MK. Bone loss and bone size after menopause. N Engl J Med. 2003;349:327–334. doi: 10.1056/NEJMoa022464. [DOI] [PubMed] [Google Scholar]
- Augat P, Reeb H, Claes LE. Prediction of fracture load at different skeletal sites by geometric properties of the cortical shell. J Bone Miner Res. 1996;11:1356–1363. doi: 10.1002/jbmr.5650110921. [DOI] [PubMed] [Google Scholar]
- Barrett JC, Fry B, Maller J, Daly MJ. Haploview: analysis and visualization of LD and haplotype maps. Bioinformatics. 2005;21:263–265. doi: 10.1093/bioinformatics/bth457. [DOI] [PubMed] [Google Scholar]
- Deng HW, Deng XT, Conway T, Xu FH, Heaney R, Recker RR. Determination of bone size of hip, spine, and wrist in human pedigrees by genetic and lifestyle factors. J Clin Densitom. 2002a;5:45–56. doi: 10.1385/jcd:5:1:045. [DOI] [PubMed] [Google Scholar]
- Deng HW, Shen H, Xu FH, Deng HY, Conway T, Zhang HT, Recker RR. Tests of linkage and/or association of genes for vitamin D receptor, osteocalcin, and parathyroid hormone with bone mineral density. J Bone Miner Res. 2002b;17:678–686. doi: 10.1359/jbmr.2002.17.4.678. [DOI] [PubMed] [Google Scholar]
- Deng HW, Xu FH, Davies KM, Heaney R, Recker RR. Differences in bone mineral density, bone mineral content, and bone areal size in fracturing and non-fracturing women, and their interrelationships at the spine and hip. J Bone Miner Metab. 2002c;20:358–366. doi: 10.1007/s007740200052. [DOI] [PubMed] [Google Scholar]
- Dvornyk V, Liu XH, Shen H, Lei SF, Zhao LJ, Huang QR, Qin YJ, Jiang DK, Long JR, Zhang YY, Gong G, Recker RR, Deng HW. Differentiation of Caucasians and Chinese at bone mass candidate genes: implication for ethnic difference of bone mass. Ann Hum Genet. 2003;67:216–227. doi: 10.1046/j.1469-1809.2003.00037.x. [DOI] [PubMed] [Google Scholar]
- Dvornyk V, Liu PY, Long JR, Zhang YY, Lei SF, Recker RR, Deng HW. Contribution of genotype and ethnicity to bone mineral density variation in Caucasians and Chinese: a test for five candidate genes for bone mass. Chin Med J (Engl) 2005;118:1235–1244. [PubMed] [Google Scholar]
- Fang Y, van Meurs JB, Rivadeneira F, van Schoor NM, van Leeuwen JP, Lips P, Pols HA, Uitterlinden AG. Vitamin D receptor gene haplotype is associated with body height and bone size. J Clin Endocrinol Metab. 2007;92:1491–1501. doi: 10.1210/jc.2006-1134. [DOI] [PubMed] [Google Scholar]
- Feng S, Wang S, Chen CC, Lan L. GWAPower: a statistical power calculation software for genome-wide association studies with quantitative traits. BMC Genet. 2011;12:12. doi: 10.1186/1471-2156-12-12. [DOI] [PMC free article] [PubMed] [Google Scholar]
- Fox KM, Cummings SR, Powell-Threets K, Stone K. Family history and risk of osteoporotic fracture Study of Osteoporotic Fractures Research Group. Osteoporos Int. 1998;8:557–562. doi: 10.1007/s001980050099. [DOI] [PubMed] [Google Scholar]
- Lei SF, Deng FY, Liu XH, Huang QR, Qin Y, Zhou Q, Jiang DK, Li YM, Mo XY, Liu MY, Chen XD, Wu XS, Shen H, Dvornyk V, Zhao L, Recker RR, Deng HW. Polymorphisms of four bone mineral density candidate genes in Chinese populations and comparison with other populations of different ethnicity. J Bone Miner Metab. 2003;21:34–42. doi: 10.1007/s007740300006. [DOI] [PubMed] [Google Scholar]
- Lei SF, Deng FY, Xiao SM, Chen XD, Deng HW. Association and haplotype analyses of the COL1A2 and ER-alpha gene polymorphisms with bone size and height in Chinese. Bone. 2005a;36:533–541. doi: 10.1016/j.bone.2004.11.002. [DOI] [PubMed] [Google Scholar]
- Lei SF, Liu YZ, Deng FY, Li YM, Li MX, Deng HW. Association and linkage analyses of interleukin-6 gene 634C/G polymorphism and bone phenotypes in Chinese. J Bone Miner Metab. 2005b;23:323–328. doi: 10.1007/s00774-004-0607-y. [DOI] [PubMed] [Google Scholar]
- Lei SF, Wang YB, Liu MY, Mo XY, Deng HW. The VDR, COL1A1, PTH, and PTHR1 gene polymorphisms are not associated with bone size and height in Chinese nuclear families. J Bone Miner Metab. 2005c;23:501–505. doi: 10.1007/s00774-005-0635-2. [DOI] [PubMed] [Google Scholar]
- Lei SF, Chen Y, Xiong DH, Li LM, Deng HW. Ethnic difference in osteoporosis-related phenotypes and its potential underlying genetic determination. J Musculoskelet Neuronal Interact. 2006;6:36–46. [PubMed] [Google Scholar]
- Liu YJ, Liu XH, Lei SF, Li MX, Deng HW. Alpha2-HS glycoprotein gene is associated with bone size at the hip in Chinese. Yi Chuan Xue Bao. 2005;32:1128–1135. [PubMed] [Google Scholar]
- Liu YZ, Wilson SG, Wang L, Liu XG, Guo YF, Li J, Yan H, Deloukas P, Soranzo N, Chinappen-Horsley U, Cervino A, Williams FM, Xiong DH, Zhang YP, Jin TB, Levy S, Papasian CJ, Drees BM, Hamilton JJ, Recker RR, Spector TD, Deng HW. Identification of PLCL1 gene for hip bone size variation in females in a genome-wide association study. PLoS One. 2008;3:e3160. doi: 10.1371/journal.pone.0003160. [DOI] [PMC free article] [PubMed] [Google Scholar]
- Long JR, Liu PY, Lu Y, Xiong DH, Zhao LJ, Zhang YY, Elze L, Recker RR, Deng HW. Association between COL1A1 gene polymorphisms and bone size in Caucasians. Eur J Hum Genet. 2004;12:383–388. doi: 10.1038/sj.ejhg.5201152. [DOI] [PubMed] [Google Scholar]
- Malkin I, Dahm S, Suk A, Kobyliansky E, Toliat M, Ruf N, Livshits G, Nurnberg P. Association of ANKH gene polymorphisms with radiographic hand bone size and geometry in a Chuvasha population. Bone. 2005;36:365–373. doi: 10.1016/j.bone.2004.09.002. [DOI] [PubMed] [Google Scholar]
- McCreadie BR, Goldstein SA. Biomechanics of fracture: is bone mineral density sufficient to assess risk? J Bone Miner Res. 2000;15:2305–2308. doi: 10.1359/jbmr.2000.15.12.2305. [DOI] [PubMed] [Google Scholar]
- Montagnani A, Gonnelli S, Alessandri M, Nuti R. Osteoporosis and risk of fracture in patients with diabetes: an update. Aging Clin Exp Res. 2011;23:84–90. doi: 10.1007/BF03351073. [DOI] [PubMed] [Google Scholar]
- Purcell S, Neale B, Todd-Brown K, Thomas L, Ferreira MA, Bender D, Maller J, Sklar P, de Bakker PI, Daly MJ, Sham PC. PLINK: a tool set for whole-genome association and population-based linkage analyses. Am J Hum Genet. 2007;81:559–575. doi: 10.1086/519795. [DOI] [PMC free article] [PubMed] [Google Scholar]
- Seeman E, Duan Y, Fong C, Edmonds J. Fracture site-specific deficits in bone size and volumetric density in men with spine or hip fractures. J Bone Miner Res. 2001;16:120–127. doi: 10.1359/jbmr.2001.16.1.120. [DOI] [PubMed] [Google Scholar]
- Shen H, Long JR, Xiong DH, Guo YF, Xiao P, Liu YZ, Zhao LJ, Liu YJ, Deng HY, Li JL, Recker RR, Deng HW. A genomewide scan for quantitative trait loci underlying areal bone size variation in 451 Caucasian families. J Med Genet. 2006;43:873–880. doi: 10.1136/jmg.2006.041251. [DOI] [PMC free article] [PubMed] [Google Scholar]
- Tan LJ, Liu YZ, Xiao P, Yang F, Tang ZH, Liu PY, Recker RR, Deng HW. Evidence for major pleiotropic effects on bone size variation from a principal component analysis of 451 Caucasian families. Acta Pharmacol Sin. 2008;29:745–751. doi: 10.1111/j.1745-7254.2008.00806.x. [DOI] [PubMed] [Google Scholar]
- Ueda T, Furusawa T, Kurahashi T, Tessarollo L, Bustin M. The nucleosome binding protein HMGN3 modulates the transcription profile of pancreatic beta cells and affects insulin secretion. Mol Cell Biol. 2009;29:5264–5276. doi: 10.1128/MCB.00526-09. [DOI] [PMC free article] [PubMed] [Google Scholar]
- van der Sluis IM, de Muinck Keizer-Schrama SM, Krenning EP, Pols HA, Uitterlinden AG. Vitamin D receptor gene polymorphism predicts height and bone size, rather than bone density in children and young adults. Calcif Tissue Int. 2003;73:332–338. doi: 10.1007/s00223-002-2130-2. [DOI] [PubMed] [Google Scholar]
- Xu FH, Liu YJ, Deng H, Huang QY, Zhao LJ, Shen H, Liu YZ, Dvornyk V, Conway T, Li JL, Davies KM, Recker RR, Deng HW. A follow-up linkage study for bone size variation in an extended sample. Bone. 2004;35:777–784. doi: 10.1016/j.bone.2004.05.007. [DOI] [PubMed] [Google Scholar]
- Zmuda JM, Cauley JA, Kuller LH, Ferrell RE. A common promotor variant in the cytochrome P450c17alpha (CYP17) gene is associated with bioavailability testosterone levels and bone size in men. J Bone Miner Res. 2001;16:911–917. doi: 10.1359/jbmr.2001.16.5.911. [DOI] [PubMed] [Google Scholar]
Associated Data
This section collects any data citations, data availability statements, or supplementary materials included in this article.