

Summary
Although multiphoton fluorescence excitation microscopy has improved the depth at which useful fluorescence images can be collected in biological tissues, the reach of multiphoton fluorescence excitation microscopy is nonetheless limited by tissue scattering and spherical aberration. Scattering can be reduced in fixed samples by mounting in a medium whose refractive index closely matches that of the fixed material. Using optical ‘clearing’, the effects of refractive index heterogeneity on signal attenuation with depth are investigated. Quantitative measurements show that by mounting kidney tissue in a high refractive index medium, less than 50% of signal attenuates in 100 µm of depth.
Keywords: Multiphoton fluorescence excitation microscopy, refractive index heterogeneity, refractive index mismatch, scattering, spherical aberration, two-photon microscopy
Introduction
Multiphoton fluorescence excitation microscopy (MPM) enables collection of image volumes up to hundreds of micrometres into biological tissue with sub-micrometre resolution and temporal resolution on the order of one image frame per second making this technique invaluable for intravital imaging (Helmchen & Denk, 2005). MPM utilizes near-infrared wavelengths of light (700–1000 nm) for two-photon fluorescence excitation. These wavelengths are within an ‘optical window’ in the absorption spectrum of water making them ideal for imaging aqueous samples (Konig, 2000). Because Rayleigh scattering has a wavelength dependence of ~λ−4, these longer excitation wavelengths scatter less than shorter wavelengths, improving imaging depth compared to conventional or confocal fluorescence microscopy (Centonze & White, 1998). Although MPM improves fluorescence signal with depth over these other fluorescence techniques, imaging depth is still limited due to spherical aberration, absorption of light and light scattering (Centonze & White, 1998; Gerritsen & de Grauw, 1999; Dunn, 2000; Booth & Wilson, 2001; Oheim et al., 2001; de Grauw et al., 2002; Zipfel et al., 2003; Helmchen & Denk, 2005; Lo et al., 2005; Egner, 2006; Theer & Denk, 2006; Muriello & Dunn, 2008).
We, and others, have shown that spherical aberration is one factor limiting the reach of MPM, primarily by degrading the focus (Gerritsen & de Grauw, 1999; Booth & Wilson, 2001; de Grauw et al., 2002; Lo et al., 2005; Egner & Hell, 2006; Muriello & Dunn, 2008). Spherical aberration results from refractive index mismatch between immersion fluid, cover slip and sample. Images collected with an oil immersion objective of agarose samples with refractive index 1.442 were shown to have 3.5-fold improvement in fluorescence signal at 40 µm in depth compared to agarose samples with refractive index 1.342 (Young et al., 2010).
Absorption is likely not a major limit, except in certain kinds of tissues. A few of the main compounds in biological tissue that absorb light are water, haemoglobin, lipids, cytochrome c oxidase, melanin and myoglobin (Hollis, 2002). However, typical absorption coefficients for biological tissue in the visible and near-infrared wavelengths are more than an order of magnitude less than typical scattering coefficients (Beek et al., 1997; Tuchin, 1997; Cuccia et al., 2003; Ren et al., 2005). In fact, scattering has been shown to typically be 10 to 100 times more significant than absorption (Doornbos et al., 1998; Cuccia et al., 2003).
Therefore, scattering is the predominant factor that ultimately limits the reach of MPM resulting from refractive index heterogeneities in tissue, for example from cell membranes or intracellular structures (Hollis, 2002). Biological samples are heterogeneous and do not have a uniform refractive index (Beuthan et al., 1996; Pawley, 2002; Tuchin, 2005). Kidney tissue, for example is made up of a rich vasculature, renal corpuscles, renal tubules and covered in a fibrous capsule. This is unfortunate for biologists interested in using microscopy to study the kidney because the light path through kidney tissue has many interfaces where light is refracted and reflected, and even light in the ‘optical window’ is strongly scattered (Beuthan et al., 1996). Scattering arises due to refractive index mismatch at the boundaries between these inhomogeneities, such as at the extracellular fluid–cell membrane interface. Calculations have shown that nearly all of the fluorescence stimulated 100 µm deep in tissue are scattered before exiting the tissue (Oheim et al., 2001; Helmchen & Denk, 2005) making large-area detectors necessary for deep tissue imaging.
Because MPM can efficiently collect scattered light, scattering primarily impacts depth by reducing power at the focus of illumination. Depth ultimately is limited by the relative amount of excitation at the focus versus shallower depths. The decrease in fluorescence excitation caused by light scattering and absorption can be addressed by increasing laser power with depth into the sample or using a regenerative amplifier, at least up to the fundamental depth limit. Scattering has been shown to fundamentally limit imaging depth (Theer & Denk, 2006). In brain tissue, the fundamental imaging depth was found to be ~1 mm deep (Theer et al., 2003). A regenerative amplifier was used as the excitation source to lower repetition rates while maintaining the average power, significantly increasing depth penetration. However, depth was limited by an increase in out-of-focus fluorescence from the surface of the sample. Near-surface fluorescence is caused by scattered excitation light, increasing the background signal such that fluorescence excited at the focus cannot be discerned from the background levels. However, by decreasing refractive index heterogeneity, the ultimate depth limit can be addressed.
The application of optical clearing methods has been shown to decrease tissue scattering, increasing optical transmittance (Xu et al., 2003; Cicchi et al., 2005; Tuchin, 2005; Millon et al., 2006; Plotnikov et al., 2006; Oldham et al., 2008). The application of optical clearing agents reduces the mismatch between tissue components, reducing scattering and improving penetration depth of light. The refractive index of biological tissue can be defined as the sum of the background index and the mean index variation (Tuchin, 2005). The background index is determined from the refractive indices of the interstitial fluid and the cytoplasm. The mean index variation is determined from the refractive indices of the major contributors to index variation, for example connective tissue fibres have refractive index 1.47 and organelles have refractive index 1.38–1.41. The ratio of the total refractive index of the tissue to the background index determines the reduced scattering coefficient. By immersing kidney tissue in media with refractive index greater than 1.33, the background index of the tissue is raised, reducing refractive index mismatch at interfaces within the tissue and lowering the reduced scattering coefficient (Tuchin, 2005).
Here we quantify the effects of scattering on signal attenuation and resolution in MPM of fixed kidney tissue. In addition, we demonstrate that optical clearing provides a simple method for significantly extending the reach of MPM.
Materials and methods
Sample preparation
Mounting media were prepared as described in Table 1. Media were prepared by weight. Refractive index was measured at room temperature 10 times using an Abbe refractometer (Sino Science & Technology Co., Ltd., ZhangZhou, FuJian, China).
Table 1.
Mounting media refractive indices measured with an Abbe refractometer. DABCO = 1,4-diazabicyclo [2.2.2] octane.
| Mounting medium | Refractive index (22°C) | Standard deviation | |
|---|---|---|---|
| A | 98% PBS, 2% DABCO | 1.3386 | 0.0002 |
| B | 49% PBS, 49% glycerol, 2% DABCO | 1.4031 | 0.0005 |
| C | 19.6% PBS, 78.4% glycerol, 2% DABCO | 1.4744 | 0.0002 |
| D | 13% benzyl alcohol, 85% glycerol, 2% DABCO | 1.4836 | 0.0006 |
| E | 53% benzyl alcohol, 45% glycerol, 2% DABCO | 1.511 | 0.001 |
| F | 83% benzyl alcohol, 15% glycerol, 2% DABCO | 1.5297 | 0.0004 |
Rat kidney tissue was labelled and cleared as described (Clendenon et al., 2010). Rat kidneys were perfusion fixed using 4% paraformaldehyde in phosphate-buffered saline (PBS), pH 7.4. The tissue was then sectioned to 200–300 µm using a vibratome (Technical Products International, Inc., St. Louis, MO, U.S.A.). Samples were blocked and permeabilized in 0.5% Triton-X 100, 1% bovine serum albumin, 5% foetal bovine serum, 1× PBS pH 7.4. Tissue was labelled using Lens culinaris agglutinin-fluorescein (Vector Labs, Burlingame, CA, U.S.A.) at a dilution of 1:200, Hoechst 33342 (10 mg/mL) (Invitrogen, Carlsbad, CA, U.S.A.), and phalloidin-rhodamine at a dilution of 1:100 (Invitrogen).
For the quantitative studies, a 250 g Munich-Wistar rat was anesthetized with pentobarbital (60 mg/kg IP). The femoral vein was then catheterized, and suncoast yellow fluorescent microspheres with 0.2 µm diameter (FS02F, Bangs Laboratories, Inc., Fishers, IN, U.S.A.) were injected. The animal was then killed, and the kidneys were excised. The kidney tissue was fixed by immersion in 4% paraformaldehyde in PBS, pH 7.4, overnight at 4°C. The tissue was sectioned to 100 µm using a vibratome and stored in 0.25% paraformaldehyde in PBS, pH 7.4, at 4°C. Animal studies were conducted within the National Institutes of Health Guide for the Care and Use of Laboratory Animals standards.
Before image collection, samples were washed overnight in PBS at 4°C. Before mounting, the tissue was incubated in a graded series of glycerol in PBS solutions, 17.5%, 35% and 70%, for at least 30 min at room temperature until samples settled to the bottom of the solution. Samples were incubated in mounting solutions for at least 30 min at room temperature until samples settled to the bottom of the solution and then transferred to a fresh aliquot at least once for at least 30 min or overnight. Samples were mounted in fresh solution with #1.5 cover slips (Corning, Lowell, MA, U.S.A.) measured with a micrometer, and water immersion objective correction collar was set accordingly using the ring value.
For the quantitative studies, samples were mounted with #1.5 cover slips (Corning). Only cover slips with uniform thickness (181 ± 2 µm as measured at several locations) were used. The water immersion objective correction collar was set to the average cover slip thickness. Before mounting, suncoast yellow fluorescent microspheres with 0.2 µm diameter (FS02F, Bangs Laboratories, Inc.) were dried to the surface of the cover slip and surface of the slide.
Two-photon microscopy
Images were collected using an FV1000 confocal microscope system (Olympus, Center Valley, PA, U.S.A.) that has been adapted for two-photon microscopy as described (Young et al., 2010). The system is equipped with a Mai-Tai titanium–sapphire laser pumped by a 10 W Argon laser (Spectra-Physics, Santa Clara, CA, U.S.A.), a Pockels cell beam attenuator (Conoptics, Inc., Danbury, CT, U.S.A.) and a Keplerian-style collimator/beam expander aligned to fill the back aperture of the objective. Images were collected using a 60× numerical aperture (NA) 1.4 oil immersion objective (Olympus) using immersion oil, n = 1.515, (Olympus) or a 60× NA 1.2 water immersion objective (Olympus) using immersion water, n = 1.33.
Five to ten XZ cross-sectional images were collected for each immunofluorescent kidney tissue sample. The images were collected with lateral pixel dimension of 0.345 µm and axial step of 0.35 µm. The pixel dwell time was 4.0 µm. The excitation wavelength was 800 nm. Images were collected using descanned detectors with the confocal pinhole maximally open. The gain and black level of the photomultiplier tube (PMT) were kept constant for all images collected. Because fluorescence intensity varied widely between samples mounted in the different media, the laser power was adjusted such that the image at surface of the tissue was just below PMT saturation.
The images of the tissue samples containing fluorescent microspheres were 512 × 512 pixels with XY pixel dimension of 0.101 µm. The pixel dwell time was 2.0 µs, and lines were Kalman averaged ×2. The excitation wavelength was 800 nm. Fluorescence saturation was measured, and laser power was maintained constant for all images and below saturating levels. Images were collected using descanned detectors with the confocal pinhole maximally open. The PMT gain was constant and below PMT saturation, and PMT black level was constant for all images collected. A levelling apparatus mounted on the stage was used to ensure the cover slip was perpendicular to the light path (Arimoto & Murray, 2004). Seven to 10 image volumes were collected of each sample. The axial step size was 0.10 µm. The experiment was repeated three times for each sample.
The image volume of a glomerulus was collected using non-descanned detectors mounted on the right side port of an Olympus IX-81 microscope. The blue channel was collected using a bialkali PMT (Hamamatsu R1924AHA) and a 380–480 nm bandpass filter (Chroma HQ430/100M-2P). The green channel was collected using a multialkali PMT (Hamamatsu R6357HA) and a 500–550 nm bandpass filter (Chroma HQ525/50M). And the red channel was collected using a multialkali PMT (Hamamatsu R6357HA) with a 560–650 nm bandpass filter (Chroma HQ605/90M-2P). The image volume was collected with lateral pixel dimension of 0.414 µm and axial step of 0.41 µm. The pixel dwell time was 4.0 µs, and lines were Kalman averaged ×3. The excitation wavelength was 800 nm.
Quantitative study of signal attenuation and resolution degradation
Images of the tissue samples containing fluorescent microspheres were analysed using IMAGEJ (Abramoff et al., 2004) and a custom plugin written at the Indiana Center for Biological Microscopy as described (Young et al., 2010). Briefly, the IMAGEJ plugin returns the fluorescence intensity of each microsphere, the image plane number of each microsphere and the background intensity of the image volume. The image plane number of the microsphere was used to determine the nominal focal position (NFP) of each microsphere, measured from the cover slip–sample interface, based on the physical movement of the objective. Background signal in each image volume was determined from the average intensity of the last 10 image planes collected, below the microspheres mounted on the slide at the bottom of the image, and was subtracted from the fluorescence intensity of each microsphere. Axial scaling from refractive index mismatch was not measured.
The data from three trials were combined and averaged in intervals such that there were 30 microspheres per bin for data collected with the water immersion objective and 25 microspheres per bin for data collected with the oil immersion objective. The intervals began at 0.5 µm deep to exclude microspheres that were dried on the cover slip and only include microspheres mounted within agarose. Bin widths ranged from 2.34 to 13.42 µm wide for data collected with the water immersion objective and 1.30 to 11.29 µm wide for data collected with the oil immersion objective.
Axial resolution was measured using the image volumes collected of the tissue containing 0.2 µm fluorescent microspheres. Although 0.2 µm is close to the lateral resolution of the microscope, measured to be 0.3 µm using the Olympus 60× NA 1.4 oil immersion objective, it is much less than the axial resolution, measured to be 0.9 µm using 800 nm two-photon excitation and collected using a 560–660 nm emission filter, and is therefore a reasonable size for axial resolution analysis. Axial resolution was measured as the full width at half maximum (FWHM) of the intensity distributed along the axial line that crossed each sphere’s centroid. Data were analysed using a custom plugin written for ImageJ at the Indiana Center for Biological Microscopy and SigmaPlot (Systat Software, Inc.) as described (Young et al., 2010). Briefly, the ImageJ plugin returns pixel values from the line of pixels running axially through the centre of each microsphere and the image plane number of the centre of the microsphere. The FWHM for the fluorescence intensity distribution from each microsphere was then calculated by curve fitting the data to a four-parameter Gaussian curve using SigmaPlot. The axial FWHM was calculated from the fitting parameters. The NFP is calculated from the image plane number.
The data from three trials were combined and averaged in intervals such that there were 31 microspheres per bin for data collected with the water immersion objective and 40 microspheres per bin for data collected with the oil immersion objective. The intervals began at 0.5 µm deep to exclude microspheres that were dried on the cover slip and only include microspheres mounted within agarose. Bin widths ranged from 2.50 to 19.86 µm wide (excluding the deepest bins for each sample the maximum bin width was 8.30 µm wide) for data collected with the water immersion objective and 3.38 to 10.94 µm wide for data collected with the oil immersion objective.
Results and discussion
In order to evaluate the effect of different refractive index of mounting media on MPM of biological tissues, we collected three-dimensional image volumes of kidney tissue labelled with Lens culinaris agglutinin-fluorescein and mounted in a set of clearing solutions with different refractive indices. Figure 1 shows a series of XZ cross-sectional images collected of kidney tissues mounted in different refractive index media, collected with an Olympus 60×, NA 1.2 water immersion objective. Interestingly, the greatest imaging depth was achieved in the samples mounted in the highest refractive index media, refractive index 1.51 and 1.53. This is surprising because these samples should show the greatest amount of spherical aberration, resulting from the greatest refractive index mismatch between the immersion fluid and sample.
Fig. 1.
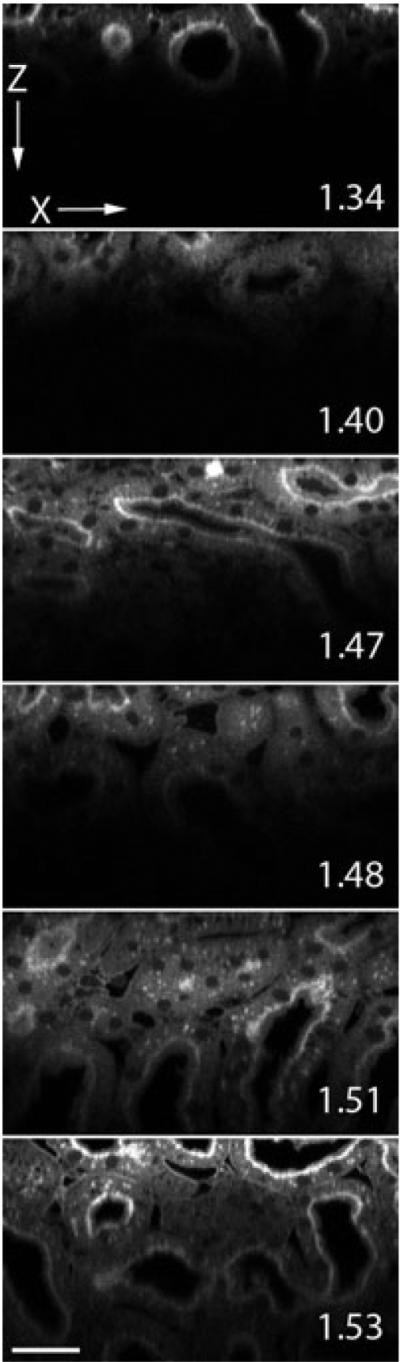
Two-photon microscopy XZ-cross sectional images of kidney tissue mounted in media with refractive index 1.34, 1.40, 1.47, 1.48, 1.51, 1.53 and collected with an Olympus NA 1.2 water immersion objective. Pixel dimensions are 0.345 × 0.35 µm. Scale bar is 30 µm.
In order to quantify the effect of mounting medium refractive index on the rate of signal attenuation with depth, we collected images of 0.2 µm fluorescent microspheres within kidney tissue mounted in media with refractive index 1.34, 1.40 or 1.51. Images were collected using an Olympus 60× NA 1.2 water immersion objective. The average intensity of the microspheres located at the cover slip was calculated and used to normalize the data. Data from the individual microspheres at the cover slip are not plotted to improve visualization because among the nine trials there are 365 individual microspheres at the surface of the samples. The standard error for the data at the cover slip was calculated to be 1–3% for each of the three samples.
Quantization of microsphere fluorescence intensity showed that, as in Fig. 1, signal levels attenuated most rapidly in the sample mounted in a medium of low refractive index (Fig. 2). For example, signal attenuated by 90% over an axial distance of 75 µm in kidney tissue with refractive index 1.51, but the same degree of attenuation was seen over only one third of this distance in a sample with refractive index 1.34. Thus, despite an increase in refractive index mismatch, signal improved with depth, in agreement with the images shown in Fig. 1. This effect most likely resulted from a reduction in refractive index heterogeneity.
Fig. 2.
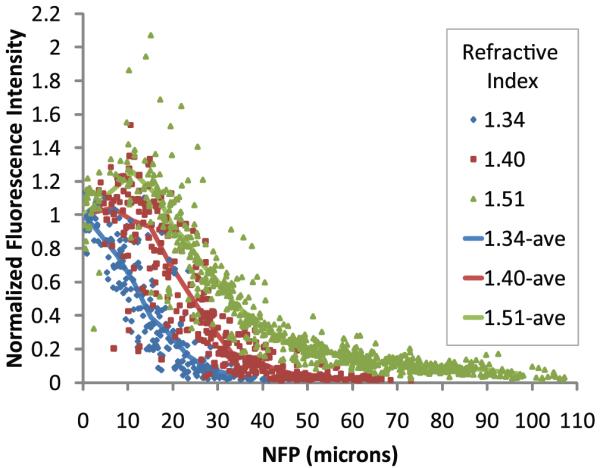
Two-photon microscopy of 0.2 µm fluorescent microspheres in kidney tissue mounted in media with refractive index 1.34, 1.40 or 1.51 and collected with an Olympus 60× NA 1.2 water immersion objective, refractive index 1.33. Lines represent the average of data from 30 microspheres per bin. Bin widths varied from 2.34 to 13.42 µm wide.
Based upon the magnitude of the refractive index mismatch, we expected that fluorescence intensity would attenuate most rapidly in samples mounted in media with higher refractive index. We previously found that refractive index mismatch compromised the achievable imaging depth, by increasing the size of the focus (Young et al., 2010). Interestingly, the results here are more complex. Although we get better depth penetration with high refractive index samples, the axial resolution is lower, as indicated by an increase in the axial FWHM of the intensity profile on injected microspheres (Fig. 3). Data from individual microspheres at the cover slip are again not plotted to improve visualization, only the average FWHM at the surface calculated for each sample with a standard error of 0.006–0.009 µm.
Fig. 3.
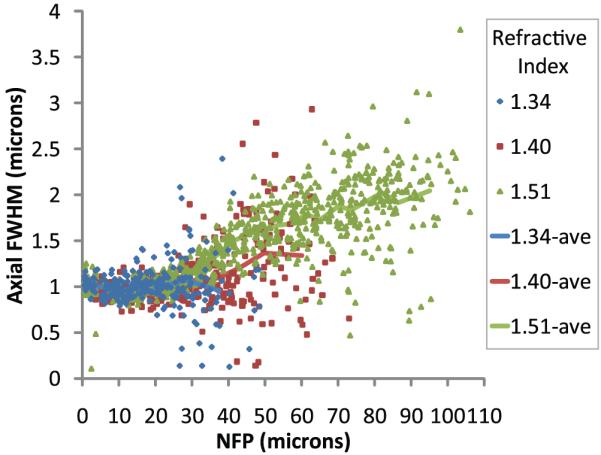
Two-photon microscopy of 0.2 µm fluorescent microspheres in kidney tissue mounted in media with refractive index 1.34, 1.40 or 1.51 and collected with an Olympus 60× NA 1.2 water immersion objective, refractive index 1.33. Lines represent the average of data from 31 microspheres per bin. Bin widths varied from 2.50 to 19.86 µm wide (excluding the deepest bin for each sample the maximum bin width was 8.30 µm wide).
Samples mounted in media with refractive index 1.34 maintained axial resolution on the order of 1 µm up to 40 µm deep into tissue, whereas the axial resolution of samples mounted in media with refractive index 1.51 was measured to be approximately 1.5 and 2.0 µm at depths of 40 and 80 µm, respectively. This is likely because scattering reduces illumination density but does not broaden it so much because scattered illumination photons are discarded from the illumination spot. So, unlike spherical aberration, scattering affects imaging depth by reducing the number of photons reaching the focus, but not really affecting the effective volume of excitation.
Based upon previous results, ideally we would eliminate spherical aberration and scattering. In order to evaluate the effect of simultaneously reducing both, we collected images of kidney tissue labelled with Lens culinaris agglutinin-fluorescein and mounted in various media, using an oil immersion objective. To minimize scattering and spherical aberration, the kidney tissue was mounted in different clearing solutions, and XZ cross-sectional images were collected using an Olympus 60× NA 1.4 oil immersion objective. The deepest imaging depth was achieved in the samples mounted in refractive index media 1.51, clearing the tissue and matching the refractive index of the immersion oil (Fig. 4).
Fig. 4.
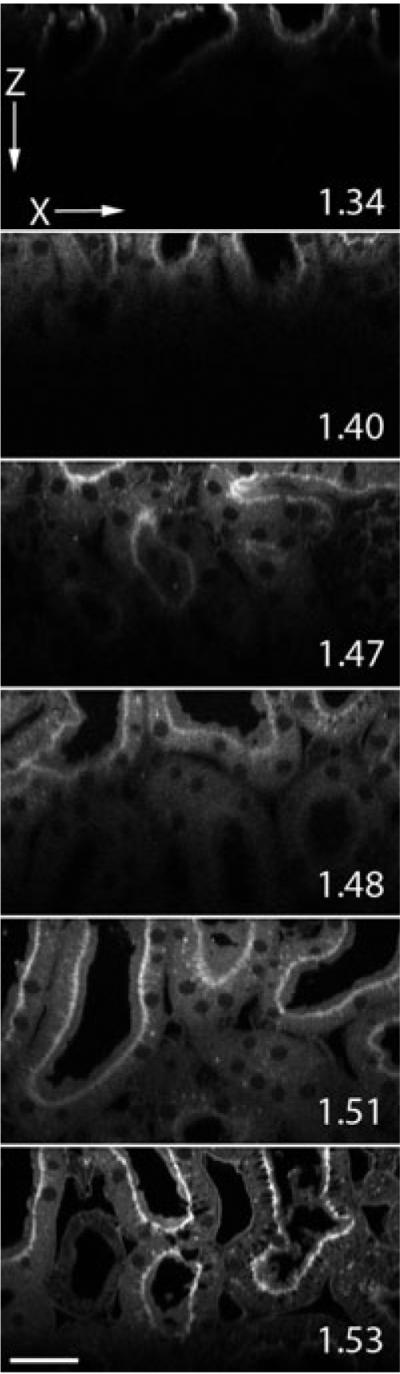
Two-photon microscopy XZ-cross sectional images up to 100 µm into kidney tissue mounted in media with refractive index 1.34, 1.40, 1.47, 1.48, 1.51, 1.53 and collected with an Olympus 60× NA 1.4 oil immersion objective, refractive index 1.51. Pixel dimensions are 0.345 × 0.35 µm. Scale bar is 30 µm.
These qualitative results were supported in quantitative analyses of fluorescent microspheres in kidney tissue. Samples were mounted in media with refractive indices of 1.34, 1.40 or 1.51 and imaged using an Olympus 60× NA 1.4 oil immersion objective (refractive index of the immersion oil, 1.515). The average intensity of the microspheres located at the cover slip was calculated and used to normalize the data. Data from the individual microspheres at the cover slip are not plotted to improve visualization because among the nine trials there are 456 individual microspheres at the surface of the samples. The standard error for the data at the cover slip was calculated to be 1–2% for each of the three samples.
As shown in Fig. 5, the rate of signal attenuation with depth was dramatically decreased in samples mounted in a high refractive index medium. Signal attenuated by 90% in less than 20 µm of depth into kidney tissue mounted in medium with refractive index 1.34, whereas in samples mounted in medium with refractive index 1.51 signal only attenuated by 45% in 100 µm of depth. There results support the notion that scattering of the excitation and fluorescent light, and not spherical aberration, is a major contributor to signal degradation under our experimental conditions.
Fig. 5.
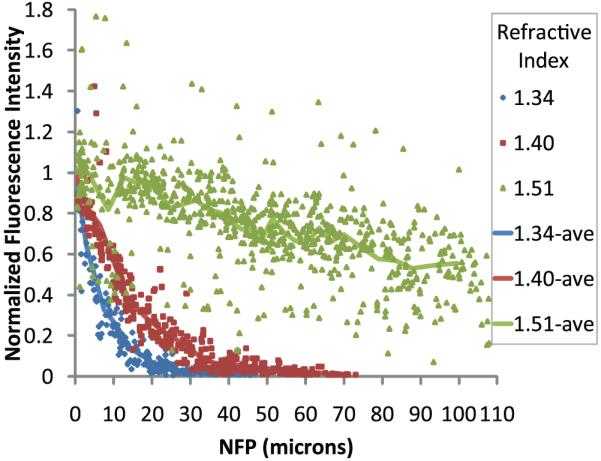
Two-photon microscopy of 0.2 µm fluorescent microspheres in kidney tissue mounted in media with refractive index 1.34, 1.40 or 1.51 and collected with an Olympus 60× NA 1.4 oil immersion objective, refractive index 1.515. Lines represent the average of data from 25 microspheres per bin. Bin widths varied from 1.30 to 11.29 µm wide.
Remarkable results were obtained in samples mounted in the highest refractive index media (Fig. 6). High-quality images were collected through the entire working distance of the objective, 150 µm. Interestingly, even though scattering has been significantly reduced, the shortest wavelength emissions still attenuate faster with depth than the longer wavelengths. This is evident from the Fig. 6(C), 125 µm deep into tissue, which has far more red signal (emission wavelengths 560–650 nm), than Fig. 6(A), 25 µm deep into tissue, which has far more blue signal (emission wavelengths 380–480 nm). This is also evident in Fig. 6(D), XZ cross-section, with more blue signal near the surface and red signal at depth.
Fig. 6.
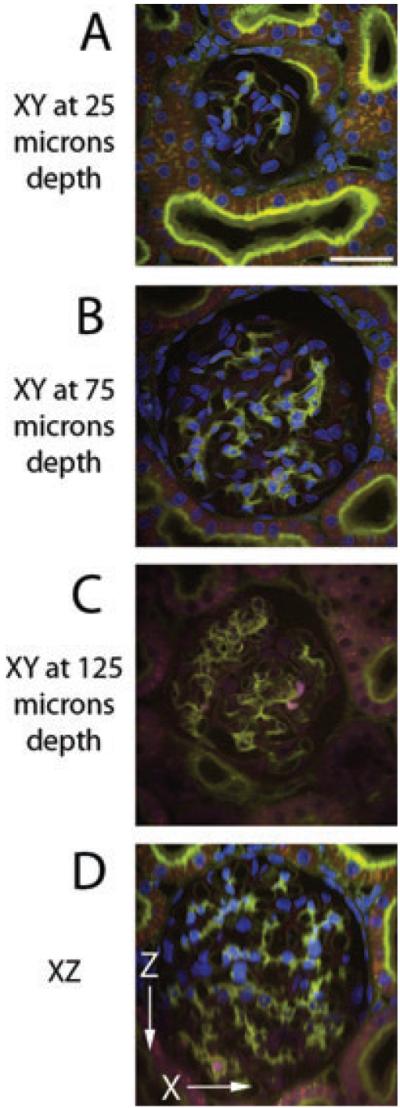
Two-photon microscopy of kidney tissue labelled with Hoechst, Lens culinaris agglutinin-fluorescein and phalloidin-rhodamine and mounted in media with refractive index 1.51. Image volume collected with Olympus 60× NA 1.4 oil immersion objective. Each image is a maximum projection of five images collected (A) 25 µm deep, (B) 75 µm deep, (C) 125 µm deep and (D) XZ cross-section. Pixel dimensions are 0.414 × 0.414 × 0.41 µm. Scale bar is 30 µm. Contrast stretching and unsharp mask were the same for all images.
Our previous studies demonstrate that refractive index mismatch compromises axial resolution in images collected at depth by MPM (Young et al., 2010). Consistent with this observation, increasing the refractive index of the mounting medium to match that of the immersion medium profoundly improved axial resolution of images of microspheres collected at depth in kidney tissue (Fig. 7). Data from individual microspheres at the cover slip are again not plotted to improve visualization, only the average FWHM at the surface calculated for each sample with a standard error of 0.003–0.006 µm.
Fig. 7.
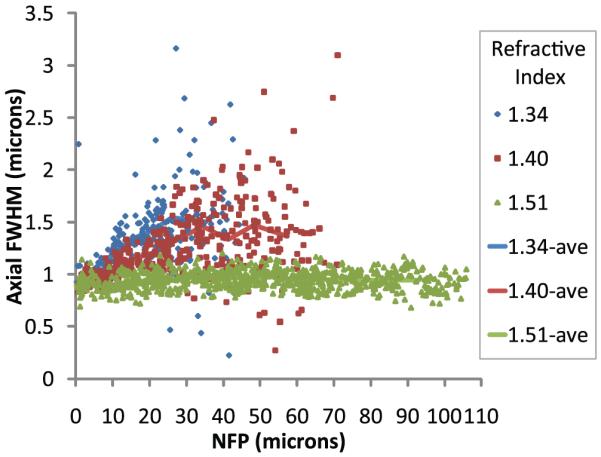
Two-photon microscopy of 0.2 µm fluorescent microspheres in kidney tissue mounted in media with refractive index 1.34, 1.40 or 1.51 and collected with an Olympus 60× NA 1.4 oil immersion objective, refractive index 1.515. Line represents the average of data from 40 microspheres per bin. Bin widths varied from 3.38 to 10.94 µm wide.
Quantitative analysis of microsphere point spread functions in these samples demonstrates that eliminating refractive index mismatch essentially eliminates depth-induced degradation in axial resolution. The axial resolution of samples mounted in media with refractive index 1.34 was measured to be approximately 1.5 µm at 25 µm depth. Samples mounted in media with refractive index 1.51 maintained axial resolution on the order of 0.9 µm up to 100 µm deep into tissue.
Conclusions
Here we have shown that refractive index heterogeneity in kidney tissue plays a significant role in signal attenuation with depth in MPM. Because refractive index heterogeneity causes scattering which has been shown to be a predominant cause of signal attenuation with depth, we investigated a simple way to minimize scatter, which profoundly improves image quality of deep tissue MPM images. Our clearing method utilizes a benzyl alcohol and glycerol solution to raise the background index of kidney tissue, lowering the reduced scattering coefficient.
In previous studies, we have shown that refractive index mismatch between the immersion fluid and sample causes significant attenuation of signal and degradation of resolution with depth. Interestingly, studies with a water immersion objective show that reducing scattering increases reach even when it increases refractive index mismatch. Scattering is apparently the predominant cause of signal attenuation with depth in fixed kidney tissue.
The largest improvements are obtained when both scattering and refractive index mismatch are reduced. Images collected using an oil immersion objective of kidney tissue mounted in media with refractive index 1.51 showed very minor signal attenuation with depth.
We also evaluated axial resolution at depth in kidney tissue. Axial resolution was shown to depend only on refractive index mismatch between the immersion fluid and the sample, but not on refractive index heterogeneity. Our data are consistent with some studies that show that imaging deep into scattering samples has no effect on resolution (Centonze & White, 1998; Dunn et al., 2000; Dong et al., 2003) and contradicts those studies that show scattering degrades resolution with depth (Ying et al., 1999; Schilders & Gu, 2000). However both contradicting studies were conducted with refractive index mismatch between the objective immersion media (air) and the aqueous sample. Schilders & Gu (2000), point out the fact that refractive index mismatch between the objective and sample leads to degradation of resolution; although, they state that resolution degradation caused by refractive index mismatch is negligible compared to the degradation caused by scattering. This may be the case for their samples with extremely short scattering-mean-free-path lengths or at greater depths into the sample. However, our data shows that the degree of scattering in kidney tissue does not degrade axial resolution within 50 µm of depth. As for Ying et al. (1999), their data support the work by Theer et al. (2003), on the fundamental imaging depth (Theer & Denk, 2006). Both studies show that when imaging deep into tissue, scattering causes out-of-focus fluorescence at the surface of the sample, degrading image quality. We suggest that scattering on the order of that occurring in fixed biological tissue eliminates photons from the two-photon excitation point-spread function; therefore, within the fundamental imaging depth, axial resolution is not degraded. Whereas refractive index mismatch causes spherical aberration, broadening the focus and degrading axial resolution.
Therefore, by reducing refractive index heterogeneity and scattering using optical clearing, we were able to improve imaging depth. Further, by matching the refractive index of the sample with the immersion fluid of the objective, we were able to improve both imaging depth and axial resolution at depths spanning the entire working distance (150 µm) of an NA 1.4 oil immersion objective.
Acknowledgements
Much appreciation and thanks to Michael Ferkowicz for his work developing the tissue clearing protocol. This work was supported by a George M. O’Brien award from the NIH (P30 DK 079312–01) and conducted at the Indiana Center for Biological Microscopy.
References
- Abramoff MD, Magelhaes PJ, Ram SJ. Image processing with ImageJ. Biophoton. Int. 2004;11(7):36–42. [Google Scholar]
- Arimoto R, Murray JM. A common aberration with water-immersion objective lenses. J. Microsc. 2004;216(1):49–51. doi: 10.1111/j.0022-2720.2004.01383.x. [DOI] [PubMed] [Google Scholar]
- Beek JF, Blokland P, Posthumus P, Aalders M, Pickering JW, Sterenborg HJMC, van Gemert MJC. In vitro double-integrating-sphere optical properties of tissues between 630 and 1064 nm. Phys. Med. Biol. 1997;42(11):2255–2261. doi: 10.1088/0031-9155/42/11/017. [DOI] [PubMed] [Google Scholar]
- Beuthan J, Minet O, Helfmann J, Herrig M, Müller G. The spatial variation of the refractive index in biological cells. Phys. Med. Biol. 1996;41(3):369–382. doi: 10.1088/0031-9155/41/3/002. [DOI] [PubMed] [Google Scholar]
- Booth MJ, Wilson T. Refractive-index-mismatch induced aberrations in single-photon and two-photon microscopy and the use of aberration correction. J. Biomed. Opt. 2001;6(3):266–272. doi: 10.1117/1.1382808. [DOI] [PubMed] [Google Scholar]
- Centonze VE, White JG. Multiphoton excitation provides optical sections from deeper within scattering specimens than confocal imaging. Biophys. J. 1998;75(4):2015–2024. doi: 10.1016/S0006-3495(98)77643-X. [DOI] [PMC free article] [PubMed] [Google Scholar]
- Cicchi R, Pavone FS, Massi D, Sampson DD. Contrast and depth enhancement in two-photon microscopy of human skin ex vivo by use of optical clearing agents. Opt. Express. 2005;13(7):2337–2344. doi: 10.1364/opex.13.002337. [DOI] [PubMed] [Google Scholar]
- Clendenon SG, Young PA, Ferkowicz M, Phillips C, Dunn KW. Deep tissue fluorescent imaging in scattering specimens. Microsc. Microanal. 2010 doi: 10.1017/S1431927611000535. in press. [DOI] [PMC free article] [PubMed] [Google Scholar]
- Cuccia DJ, Bevilacqua F, Durkin AJ. In vivo quantification of optical contrast agent dynamics in rat tumors by use of diffuse optical spectroscopy with magnetic resonance imaging coregistration. Appl. Opt. 2003;42(16):2940–2950. doi: 10.1364/ao.42.002940. [DOI] [PubMed] [Google Scholar]
- de Grauw CJ, Frederix PLTM, Gerritsen HC. Aberrations and penetration in in-depth confocal and two-photon-excitation microscopy. In: Diaspro A, editor. Confocal and Two-Photon Microscopy: Foundations, Applications, and Advances. Wiley-Liss, Inc; New York: 2002. pp. 153–169. [Google Scholar]
- Dong CY, Koenig K, So PTC. Characterizing point spread functions of two-photon fluorescence microscopy in turbid medium. J. Biomed. Opt. 2003;8(3):450–459. doi: 10.1117/1.1578644. [DOI] [PubMed] [Google Scholar]
- Doornbos RMP, Lang R, Aalders MC, Cross FW, Sterenborg HJCM. The determination of in vivo human tissue optical properties and absolute chromophore concentrations using spatially resolved steady-state diffuse reflectance spectroscopy. Phys. Med. Biol. 1998;1999;44:967–981. doi: 10.1088/0031-9155/44/4/012. [DOI] [PubMed] [Google Scholar]
- Dunn AK, Wallace VP, Coleno M, Berns MW, Tromberg BJ. Influence of optical properties on two-photon fluorescence imaging in turbid samples. Appl. Opt. 2000;39(7):1194–1201. doi: 10.1364/ao.39.001194. [DOI] [PubMed] [Google Scholar]
- Egner AH, Hell SW. Aberrations in confocal and multi-photon fluorescence microscopy induced by refractive index mismatch. In: Pawley JB, editor. Handbook of Biological Confocal Microscopy. Springer; New York: 2006. [Google Scholar]
- Gerritsen HC, de Grauw CJ. Imaging of optically thick specimen using two-photon excitation microscopy. Microsc. Res. Tech. 1999;47(3):206–209. doi: 10.1002/(SICI)1097-0029(19991101)47:3<206::AID-JEMT6>3.0.CO;2-H. [DOI] [PubMed] [Google Scholar]
- Helmchen F, Denk W. Deep tissue two-photon microscopy. Nat. Methods. 2005;2(12):932–940. doi: 10.1038/nmeth818. [DOI] [PubMed] [Google Scholar]
- Hollis V. Doctor of Philosophy, Department of Medical Physics and Bioengineering, University of London; London: 2002. Non-Invasive Monitoring of Brain Tissue Temperature by Near-Infrared Spectroscopy; pp. 29–37. [Google Scholar]
- Konig K. Multiphoton microscopy in life sciences. J. Microsc. 2000;200(Pt 2):83–104. doi: 10.1046/j.1365-2818.2000.00738.x. [DOI] [PubMed] [Google Scholar]
- Lo W, Sun Y, Lin SJ, Jee SH, Dong CY. Spherical aberration correction in multiphoton fluorescence imaging using objective correction collar. J. Biomed. Opt. 2005;10(3):034006-1–034006-5. doi: 10.1117/1.1924614. [DOI] [PubMed] [Google Scholar]
- Millon SR, Roldan-Perez KM, Riching KM, Palmer GM, Ramanujam N. Effect of optical clearing agents on the in vivo optical properties of squamous epithelial tissue. Lasers Surg. Med. 2006;38(10):920–927. doi: 10.1002/lsm.20451. [DOI] [PubMed] [Google Scholar]
- Muriello PA, Dunn KW. Improving signal levels in intravital multiphoton microscopy using an objective correction collar. Opt. Commun. 2008;281(7):1806–1812. doi: 10.1016/j.optcom.2007.05.070. [DOI] [PMC free article] [PubMed] [Google Scholar]
- Oheim M, Beaurepaire E, Mertz J. Two-photon microscopy in brain tissue: parameters influencing the imaging depth. J. Neurosci. Methods. 2001;111(1):29–37. doi: 10.1016/s0165-0270(01)00438-1. [DOI] [PubMed] [Google Scholar]
- Oldham M, Sakhalkar H, Oliver T, Johnson GA, Dewhirst M. Optical clearing of unsectioned specimens for three-dimensional imaging via optical transmission and emission tomography. J. Biomed. Opt. 2008;13(2):021113-1–021113-8. doi: 10.1117/1.2907968. [DOI] [PMC free article] [PubMed] [Google Scholar]
- Pawley JB. Limitations on optical sectioning in live-cell confocal microscopy. Scanning. 2002;24(5):241–246. doi: 10.1002/sca.4950240504. [DOI] [PubMed] [Google Scholar]
- Plotnikov S, Juneja V, Isaacson AB, Mohler WA, Campagnola PJ. Optical clearing for improved contrast in second harmonic generation imaging of skeletal muscle. Biophys. J. 2006;90(1):328–339. doi: 10.1529/biophysj.105.066944. [DOI] [PMC free article] [PubMed] [Google Scholar]
- Ren K, Moa-Anderson B, Bal G, Gu X, Hielscher AH. Optical Tomography and Spectroscopy of Tissue VI, Proceedings of SPIE. SPIE, Bellingham; WA: 2005. Frequency domain tomography in small animals with the equation of radiative transfer. [Google Scholar]
- Schilders SP, Gu M. Limiting factors on image quality in imaging through turbid media under single-photon and two-photon excitation. Microsc. Microanal. 2000;6(2):156–160. doi: 10.1007/s100059910018. [DOI] [PubMed] [Google Scholar]
- Theer P, Denk W. On the fundamental imaging-depth limit in two-photon microscopy. J. Opt. Soc. Am. A Opt. Image Sci. Vis. 2006;23(12):3139–3149. doi: 10.1364/josaa.23.003139. [DOI] [PubMed] [Google Scholar]
- Theer P, Hasan MT, Denk W. Two-photon imaging to a depth of 1000 μm in living brains by use of a Ti:Al2O3 regenerative amplifier. Opt. Lett. 2003;28(12):1022–1024. doi: 10.1364/ol.28.001022. [DOI] [PubMed] [Google Scholar]
- Tuchin VV. Light scattering study of tissues. Phys.-Uspekhi. 1997;40(5):495–515. [Google Scholar]
- Tuchin VV. Optical clearing of tissues and blood using the immersion method. J. Phys. D: Appl. Phys. 2005;38:2497–2518. [Google Scholar]
- Xu X, Wang R, Elder JB. Optical clearing effect on gastric tissues immersed with biocompatible chemical agents investigated by near infrared reflectance spectroscopy. J. Phys. D: Appl. Phys. 2003;36:1707–1713. [Google Scholar]
- Ying J, Liu F, Alfano RR. Spatial distribution of two-photon-excited fluorescence in scattering media. Appl. Opt. 1999;38(1):224–229. doi: 10.1364/ao.38.000224. [DOI] [PubMed] [Google Scholar]
- Young PA, Clendenon SG, Byars JM, Decca RS, Dunn KW. The effects of spherical aberration on multiphoton fluorescence excitation microscopy. J. Microsc. 2010 doi: 10.1111/j.1365-2818.2010.03449.x. DOI:10.1111/j.1365-2818.2010.03449.x. [DOI] [PMC free article] [PubMed] [Google Scholar]
- Zipfel WR, Williams RM, Webb WW. Nonlinear magic: multiphoton microscopy in the biosciences. Nat. Biotechnol. 2003;21(11):1369–1377. doi: 10.1038/nbt899. [DOI] [PubMed] [Google Scholar]